T.C.
ISTANBUL AYDIN UNIVERSITY INSTITUTE OF GRADUATE STUDIES
MULTILAYER ARCHITECTURE FOR VOLTAGE AND FREQUENCY CONTROL İN NETWORKED MİCROGRİD
M.Sc. THESIS
Bilal HASSAN
Department of Electrical & Electronic Engineering Electrical and Electronics Engineering Program
T.C.
ISTANBUL AYDIN UNIVERSITY INSTITUTE OF GRADUATE STUDIES
MULTILAYER ARCHITECTURE FOR VOLTAGE AND FREQUENCY CONTROL İN NETWORKED MİCROGRİD
M.Sc. THESIS
Bilal HASSAN (Y1613.300007)
Department of Electrical & Electronic Engineering Electrical and Electronics Engineering Program
Advisor: Prof. Dr Murtaza FARSADİ
DECLARATION
I hereby declare that all information in this thesis document has been obtained and presented in accordance with academic rules and ethical conduct. I also declare that, as required by these rules and conduct, I have fully cited and referenced all material and results, which are not original to this thesis.
FOREWORD
After thanks to Allah our creator, I would like to thank my mother and my father who raised me to become a good person. They were patient during my mistakes and my bad times and helped me in all times and everything I have accomplished is because of their effort. I hope I can make them happy and return even some of what they gave me during their whole lives.I would like to thank my thesis advisor Dr. Murtaza Farsadi for his guidance, support, and help during my work in the thesis. I thank him for everything I learned from him.I thank all my teachers starting from my school time until today as they had great influence on me and made me love education and I hope I can become one day a good teacher as they were.
January, 2020 Bilal HASSAN
TABLE OF CONTENT
Page
FOREWORD ... iv
TABLE OF CONTENT ... v
ABBREVIATIONS ... vii
LIST OF FIGURES ... viii
ABSTRACT ... x
ÖZET ... xi
1. INTRODUCTION ... 1
1.1 Purpose ... 1
1.2 Overview ... 1
1.3 PID controller (Proportional Integral Derivative) ... 4
1.4 History of PID Controller ... 4
1.5 What is PID: ... 5
1.6 Working of PID Controller ... 5
1.6.1 P Controller: ... 6 1.6.2 I Controller ... 7 1.6.3 PI controller ... 8 1.6.4 D-Controller ... 9 1.6.5 PID controller ... 9 1.7 Tuning ... 9
1.7.1 Trial and error method ... 10
1.7.2 Process reaction curve technique ... 10
1.7.3 Zeigler nichols ... 10
2. SYSTEM AND COMPONENT MODELING... 11
2.1 Renewable energy system ... 11
2.2 Type of RES ... 11
2.2.1 Solar ... 11
2.2.2 Solar cell ... 12
2.2.3 Solar Cell Characteristic ... 13
2.3 Crystalline Silicon PV module ... 14
2.4 Amorphous Silicon PV Module ... 15
2.5 Hybrid Silicon PV Module ... 15
2.6 Mathematical Modeling of PV ... 15
2.7 Boltzmann's Constant: ... 17
2.8 Wind ... 18
2.8.1 Wind power ... 18
2.8.2 Wind turbine ... 19
2.8.3 Types of wind turbine ... 19
2.8.4 Turbine model’s mathematical formula ... 20
2.8.5 Wind MPPT ... 24
2.9 Pitch Angel Control ... 26
2.10.1 Ni-mh batteries: ... 26
2.10.2 Energy storage system (ess) ... 27
2.11 Battery Controller ... 27
2.11.1 State of charge (SOC): ... 28
3. PROPOSED METHODOLOGY ... 29
3.1 Subsystem 1 (PV Module& Wind turbine) ... 30
3.1.1 Subsystem 1(pv & wind turbine) methodology:in this subsystem we have two pvmodules&a wind turbine system. the layout of first subsystem is like asshown below, ... 30
3.1.2 Operation of PV System ... 31
3.1.3 Operation of wind energy System ... 32
3.1.4 Operation of battery System ... 33
3.1.5 Operation of PID controller: ... 35
3.1.6 Operation of PWM Inverter: ... 35
3.2 Subsystem 2 PV Module ... 36
3.2.1 Operation of PV System ... 37
3.2.2 Operation of battery System ... 38
3.2.3 Operation of PID controller: ... 39
4. EXPERİMENTS & RESULTS: ... 40
4.1 Subsystem1 ... 40
4.2 Subsystem2 ... 42
4.3 Subsystem 3 ... 43
4.4 Subsystem 4 ... 44
4.4.1 Battery voltage and SOC behavior of subsystem 4 ... 45
4.5 GRID Side Parameters ... 45
5. CONCLUSION ... 48
5.1 Suggestions ... 48
REFERENCES ... 49
ABBREVIATIONS
PWM : Pulse Width Modulation DC : Direct Current
AC : Alternation Current
PCC : Point of Common Coupling DERS : Distributed Energy Resources PID : Proportional Integral Derivative
MG : Microgrid
DERs : Distributed Energy Resources EMS : Energy Management System ESUs : Energy Storage Units
THD : Total Harmonic Distortion PV : Photovoltaic Panels DG : Distributed Generation
MS : Microsystem
ZN : Zeigler Nichols
ESS : Energy Storage System
SC : Solar Cell
TSR : Tip Speed Ratio Control PSF : Power Signal Feedback HCS : Hill Climb Search Based SOC : State of Charge
LIST OF FIGURES
Page
Figure 1.1: Networked microgrid Structure ... 3
Figure 1.2: PID Basic Control[4] ... 5
Figure 1.3: P Controller ... 6
Figure 1.4: PControllerResponse ... 7
Figure 1.5: PI Controller ... 8
Figure 1.6: PI Controller Response ... 8
Figure 1.7: PID Controller ... 9
Figure 1.8: PID Response ... 9
Figure 1.9: Zeigler Nichols Table ... 10
Figure 2.1: V-I Characteristic at different irradiation of Solar cell[11][11] ... 13
Figure 2.2: Power characteristicSolar cell at different irradiation value ... 13
Figure 2.3: V-I characteristic of Solar cell with different T ... 14
Figure 2.4: Power characteristic Solar cell with different temperature[11] ... 14
Figure 2.5: Circuit of PC ... 15
Figure 2.6: Photovoltaic array ... 16
Figure 2.7: Modelling of PV ... 18
Figure 2.8: Simulated power coefficient ... 24
Figure 2.9: Simulated Power Constant (with variation of constant C4) ... 24
Figure 2.10: Figure Comparison of different ESS[17] ... 27
Figure 3.1: Networked Microgrid ... 30
Figure 3.2: PV Module & Wind Turbine with Battery storage. ... 30
Figure 3.3: PV System ... 31
Figure 3.4: Power generated by solar panels ... 31
Figure 3.5: Wind turbine System ... 32
Figure 3.6: Power Generated by wind turbine system ... 33
Figure 3.7: Charging and discharging of Battery System ... 34
Figure 3.8: SOC and Voltage of Battery Subsystem 1 ... 34
Figure 3.9: Power Control by PID Controller ... 35
Figure 3.10: Operation of PWM Inverter... 36
Figure 3.11: Model of Subsystem 2 PV Module ... 36
Figure 3.12: Operation of PV Module ... 37
Figure 3.13: Irradiation of Solar Panels ... 37
Figure 3.14: Operation of battery System ... 38
Figure 3.15: Operation of PID Controller ... 39
Figure 4.1: PV module DC output power behavior ... 40
Figure 4.2: Wind AC output power behavior ... 40
Figure 4.3: Battery voltage and SOC behavior of subsystem 1 ... 41
Figure 4.4: Behavior graph of power of Subsystem 1 at grid side... 41
Figure 4.5: PV module DC output power behavior ... 42
Figure 4.7: Behavior graph of power of Subsystem 2 at grid side... 43
Figure 4.8: PV module DC output power behavior of subsystem 3 ... 43
Figure 4.9: Battery voltage andSOC behavior of subsystem 3 ... 43
Figure 4.10: Behavior graph of power of Subsystem 3 at grid side... 44
Figure 4.11: PV module DC output power behavior ... 44
Figure 4.12: Behavior graph of power of Subsystem 4 at grid side... 45
Figure 4.13: 3-phase AC Current depiction on grid side ... 45
Figure 4.14: 3-phase AC Voltage depiction on grid sideVoltage ... 46
Figure 4.15: 3-phase AC Power depiction on grid side ... 46
Figure 4.16: Voltage of each subsystem ... 46
Figure 4.17: Power of Subsystem 1 ... 47
Figure 4.18: Power of subsystem 2 ... 47
Figure 4.19: Power of subsystem 3 ... 47
MULTILAYER ARCHITECTURE FOR VOLTAGE AND FREQUENCY CONTROL IN NETWORKED MICROGRID
ABSTRACT
The demand of growing power that requirements to be remotely transported creates a fast and effective solution of Distributed Energy Resources (DERs). Integration (DERs) can reduce the distance between load and Generation side and decrease the transmission lines, Distribution and the minimize carbon emission. Such challenges can be overcome by using networked microgrids, in which different type of (DERs) that give the power to load that connected to each subsystem and extra power given to main grid. Microgrid allowing the power system to sense and control the errors efficiently and do switching with control algorithms so that whole system escape blackouts and minimize the power restoration times. In this work we have four subsystems with load. In this work microgrid system is analyzed in islanded mode in which photovoltaic and wind turbine give desire power to load that attached with grid side. In this novel all microgrid are attached with battery whose power sharing is control by PID. Each microgrid is connect with load and grid. In this novel the renewable energy resources are wind turbine and PV that given a desire voltage to load and the remaining power to main grid. The PID control technique can control output voltage at a desire and standard value.All control strategies of the hybrid AC microgrid are simulated in SIMULINK/MATLAB.A networked microgrid system is a cluster of adjacent microgrids that has capability to share power between the connected microgrids in order to increase the reliability of networked system.In a networked microgrid system, microgrid can be operate in different configurations like islanded microgrid, an asynchronously grid-connected microgrid, a synchronously grid-connected microgrid, and networked microgrid
AĞ MİKROGRİDİNDE GERİLİM VE FREKANS KONTROLÜ İÇİN ÇOKLU OYUNCU
ÖZET
Uzaktan taşınması gereken artan güç talebi, Dağıtılmış Enerji Kaynaklarının (DER) hızlı ve etkili bir çözümünü oluşturur. Entegrasyon (DER'ler) yük ve Üretim tarafı arasındaki mesafeyi azaltabilir ve iletim hatlarını, Dağıtımı ve karbon emisyonunu en aza indirebilir. Bu tür zorluklar, her bir alt sisteme bağlı olan yükü ve ana şebekeye verilen ekstra gücü veren farklı tipte (DER'ler) ağa bağlı mikro ızgaralar kullanılarak aşılabilir. Güç sisteminin hataları etkili bir şekilde algılamasına ve kontrol etmesine ve kontrol algoritmalarıyla geçiş yapmasına izin veren mikrogrid, böylece tüm sistem kesintilerden kaçar ve güç geri yükleme sürelerini en aza indirir. Bu çalışmada dört yüklü alt sistemimiz var. Bu çalışmada mikrogrid sistemi, fotovoltaik ve rüzgar türbininin ızgara tarafına bağlı olanı yüklemek için arzu gücü verdiği adalı modda analiz edilir. Bu romanda tüm mikrogrid, güç paylaşımı PID tarafından kontrol edilen bataryaya bağlanmıştır. Her mikro ızgara yük ve ızgara ile bağlanır. Bu romanda yenilenebilir enerji kaynakları, yük için arzu voltajı ve ana şebekeye kalan güç veren rüzgar türbini ve PV'dir. PID kontrol tekniği, çıkış voltajını bir arzu ve standart değerde kontrol edebilir. Hibrid AC mikro şebekenin tüm kontrol stratejileri SIMULINK / MATLAB [1] 'de simüle edilmiştir.Ağa bağlı bir mikro ızgara sistemi, ağa bağlı sistemin güvenilirliğini artırmak için bağlı mikro ızgaralar arasında gücü paylaşma kapasitesine sahip bitişik bir mikro ızgara kümesidir. Ağa bağlı bir mikro ızgara sisteminde, mikro ızgara, senkronize olmayan bir ızgara olan adalı mikro ızgara gibi farklı yapılandırmalarda çalıştırılabilir. bağlı mikro şebeke, senkronize ızgara bağlantılı mikro şebeke ve ağ bağlantılı mikro şebeke
Anahtar Kelimeler: PID (oransal integral türev), pwm dönüştürücü, dağıtık, enerji
1. INTRODUCTION
1.1 Purpose
The purpose of this thesis is to share & give power to load in islanded mode and remaining power is give to main grid in grid connected mode in networked microgrid. By applying different control methods to control the voltage of the system to make it stable for efficient performance. The implement of networked microgrid is more reliable for rural area that much away from mai n generation side. Integration (DERs) can reduce the distance between load and Generation side and decrease the transmission lines, Distribution and the minimize carbon emission.
1.2 Overview
When we talks about microgrids then it is observed that micro -grids has a long lasting.The first power plant (Thomas Edison) was built in 1882, situated in Manhattan pearl. AT this time centralized grid was not recognized. With the passage of the time in nearly 1886, fifty eight direct-current MG was increased.After some time, the advancement of the electric administrations industry advanced to a state managed restraining infrastructure advertise, this restricts the motivating forces for MG improvement. The variations of tendencies are established to create capabilities in modern world of MG. It became gradually more that the basic infrastructure of present power network, top down framework which relies on the possibility of a predicated unidirectional vitality streams, discarded.Following is elementary concept or a definition of “microgrid” which can described as, an integratedpower system which includes scattered ER and various ELworking as a individual. In micro grid different grid are connected with utility in parallel or in islanded. The most successive design in conveyed vitality assets are combined with individually feeder, & coupling is connected to the grid at a single point. But the main influential feature of a microgrid is the capability to split and cut off itself
which is known as islanding. All distributed generation, likeit’s may be fossil fueled, or renewable, must be cutoff during absent of power. This is the fact by which microgrid advocates, with those who argue specifically when these sources may possibly offer the supreme value to generation owners and soc iety both at the same time. After failure of larger grid system these sources may well provide power services to consumers and owners of disseminated energy generation systems. The outlook of general control of one’s energy services is frightening to politically powerful present electricity utilities, for both privately and publicly owned. Today, these utilities helped to stall pervasive escalation of microgrids throughout, On the other hand new inverter technologies may be mollifying utility opponent to microgrids due to reservations about unintended islanding, which is a conventional safety concern. The five primary microgrid segments are following:
Community or Utility Microgrids: The people group or utility MG incorporates private clients. It is seen that this portion of MGs won't achieve general business acknowledgment until standard principals are set up and oppressive hindrances are disengaged.
Commercial or Industrial Microgrids: Commercial or industrial MG’s are basically designs for the petrochemical industry, features centralized controls and fossil fueled generation sets which are most state of the art models. As Japan dominates in commercial or industrial segment of MG as a contemporary leader.
Institutional or Campus Microgrids: This class of micro grids offers the superlative development break because of the benefit of common ownership. Remote off Microgrids: This segment has extreme amount of MGs presently in service universal, but it has small capability of comparatively with other systems having conventionally feature that is diesel distributed generation. The biggest segment is solar powered and yet little wind powered is probably use to generate energy.
Military Microgrids: Minimal section of MGs which are a little while ago being urbanized. On any supplied fuel this is a mode to vulnerable power supply exclusive of being reliant. About 3.1(GW) of new microgrid capacity is
expected to come online globally which represents a total value of $7.8 billion (P. Asmus, A. Cornelius, and C. Wheelock,2009).
The chapter prologues about microgrid, & challenges faced tocontrol networked microgrid and how to deal with those challenges. The significanceof MGs has extensivelyamplified over the last 10 years because it’s directlyremunerated to provide consistent, environment friendly and sustainable electricity particularly from (RES) under intense climate conditions. There are number of researches works available related to integration of distributed generation (DG)previous to the MG concept was introduce. In this way, MG idea was foreseen to defeat a portion of those issues(S. Gorjian,2018).
.
Figure 1.1: Networked microgrid Structure Sourse: S. Gorjian,2018.
At least two microgrid can make a networked MS that allows them to junction power inside MGs. The microgrid engaged in this NMG can control in variousachievable configurations including, islanded microgrid, an Asynchronously Grid-connected MG, a Synchronously grid connected microgrid, and networked microgrids. These feasible configurations and unambiguous characteristics of RE come up with the challenges in manipulate control and voltage, frequency and power.
A microgrid is hybrid systems consist of different type of converters/sources. The system may have (MIMO) systems that increase the complication to design controller. This complication can be reducing, if we control each control variables independently. Hence, the microgrid can be measured as a combination of various (SISO) system that is easy to control(Zamora, Ramon,2015).On the based above description problem the following questions raised.
Which control method are design which full fill the criteria of frequency and voltage and how to improve forceful responses with variable sources.
Designscontrol method for a hybrid system consists of resources of different distinctiveness and control goals, whereasensure that system strategies goals can be obtained?
Design a reconductor control method to regulate with grid connected,islanded mode and NMG operating circumstances.
Enable economic or flexible operation into microgrid EMS?
1.3 PID controller (Proportional Integral Derivative)
A controller that is used in engineering to control applications & its features like high pressure, temperature and speed it also help to sharing power among the different renewable energy sources. PID controllers use a feedback method to get desire value of variables. For driving a system towards position or level PID controller is a best way which wants in system. PID controller uses closed -loop control feedback to keep actual output of any system close to set point.
1.4 History of PID Controller
The innovation in PID controller started by Elmer Sperry in 1911. Later on in 1933 (TIC) inauguration the first pneumatic controller with a completely tunable proportional controller. After some time, the steady state error overcome by the engineer which present in proportional. This error overcome by resetting the point to some simulated value.Then on the base of resetting,
after that it is known as PID. After that, TIC invented a new PID controller with derivative that can overcome the overshooting issue. However, after two -year1942, Nichols and Ziegler introduce a new fine-tuning method. By use of this method engineer were able toget and set the suitable parameters of PID controllers. After some year in 1950 a automatic PID controller were used widely in engineering sector.
1.5 What is PID:
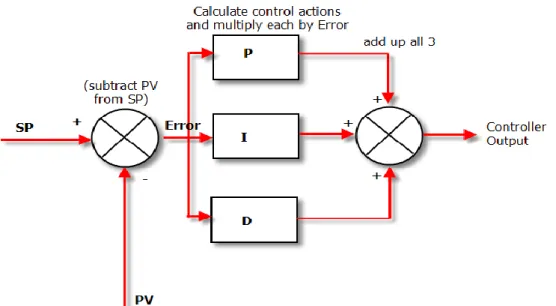
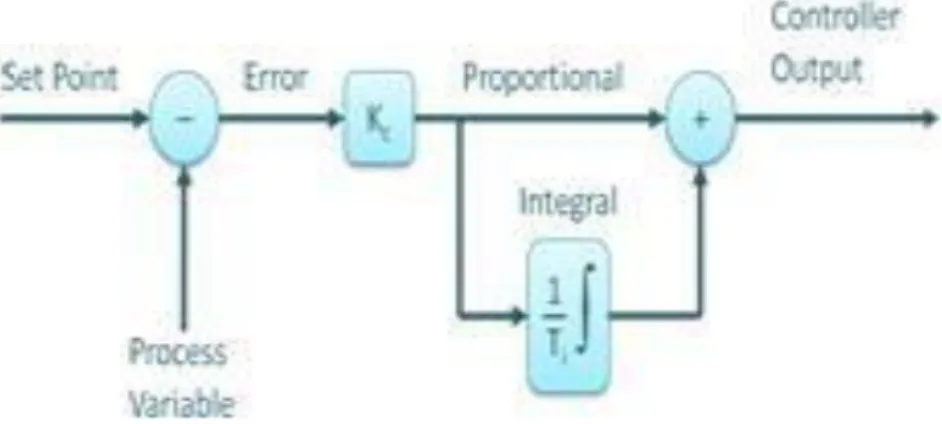
The three actions derivative, proportional & integral combinly called a PID. The value of these three coefficients is different in each PID controller which is use in different application in order to achieve finest reaction. The basis diagram of PID shown below. You can easily understand working of PID.
Figure 1.2: PID Basic Control
Source: Jimhogenson,2019
1.6 Working of PID Controller
A off-on controller have only two state of control whıch are fully off or fully on.Off –On controller in certain control application. In which fully on and fully on state are sufficient to get desire output. But this controller produce oscillating nature, due to oscillating nature its usage is limit. So now PID controllers used as compare to it.
The main objective of PID controller retainszero error b/w reference point and process variable in closed loop process. PID have three control activities which are described below.
There two technique by which PID can control one is manual control other is the programmed control.
In manual control, the operator contrasted the yield worth and want esteem whenever yield didn't meet the with want esteem then he changed the v ariable incentive to get want yield.
The other technique is an automatic controller that are generally utilized in modern. These programmed controllers are comprising of various activities that are given underneath.
ON OFF Controller P Controller PI Controller PD Controller PID Controller 1.6.1 P Controller: Figure 1.3: P Controller Source: Jimhogenson,2019
The output of P controller obtained by multiply of errpr with proportional gain Kc. After that we compare set point with the value of process variable . Then
the resulting error are multiply by Kc to obtaine desire output. If the value of error came zero then output of controller is zero.
P Controller used alone, it need a manual reset. Beacause it not go to steady state have a manual reset condition. It give a stable operation and maintains the steady state error. The Speed of the response time is rise when the Kc rise(PID for Dummies,2019)
Figure 1.4: PControllerResponse
Source: Jimhogenson,2019
1.6.2 I Controller
Steady state error cannot remove or eliminated by P controller. Therefore, to eliminate the SSE, we use I controller. I controller do necessary action to finish the SSE. I controller integrates the error w.r.t of change of time and process continuous start until error will become zero(PID for Dummies,2019).
Output of I control decrease when process go to negative error. P control restricts the speed of response and stability of system also affects. Speed of the response is increased by decreasing Ki.
Figure 1.5: PI Controller
Source: Jimhogenson,2019
1.6.3 PI controller
The integral component sums the error term over time. The result is that even a small error term will cause the integral component to increase slowly. The integral response will continually increase over time unless the error is zero, so the effect is to drive the Steady-State error to zero. Steady-State error is the final difference between the process variable and set point. A phenomenon called integral windup results when integral action saturates a controller without the controller driving the error signal toward zero.
Figure 1.6: PI Controller Response
Source: Jimhogenson,2019
According to figure, the gain of I controller decrease then SSE also decrease.Mostly PI is use for low speed response and not use for high speed response.
1.6.4 D-Controller
Figure 1.7: PID Controller
Source: Jimhogenson,2019
1.6.5 PID controller
I-controller does not tell the error that will come in futrue.Dcontroller solved these problem by prediction of future error. The o/p of PID depend on change of error w.r.t time and multiplied by derivation constant.
Figure 1.8: PID Response
Source: Jimhogenson,2019
The setting time of desire value is decrease by using D controller. As compare to other controller.
1.7 Tuning
Engineer set a default value of a P, I and D constant. But this default value does not give the desire output and system goes toward to instability. Therefore, to get desire output different tuning method are developed which have best value of P, I and D(R. Sen, C. Pati, S. Dutta, and R. Sen,2014).
1.7.1 Trial and error method
The technique to tuning of PID controller. In this technique, we put the value of Kd and Ki term is zero and raise the value of (Kp) until system showed the oscillating. After staring of oscillation, we change the value of K until oscillations will stop and finally by adjusting D to achieve fast response (H. O. Bansal, R. Sharma, and P. R. Shreeraman,2012).
1.7.2 Process reaction curve technique
It is an open loop tuning technique. It produces response when a step in put is applied to the system. If we apply some control change in the system, then we have seen the record curve. We can find the dead time, slope and rise time of the curve. Gain of PID is calculate by putting calculated value in P, I, and D equations.
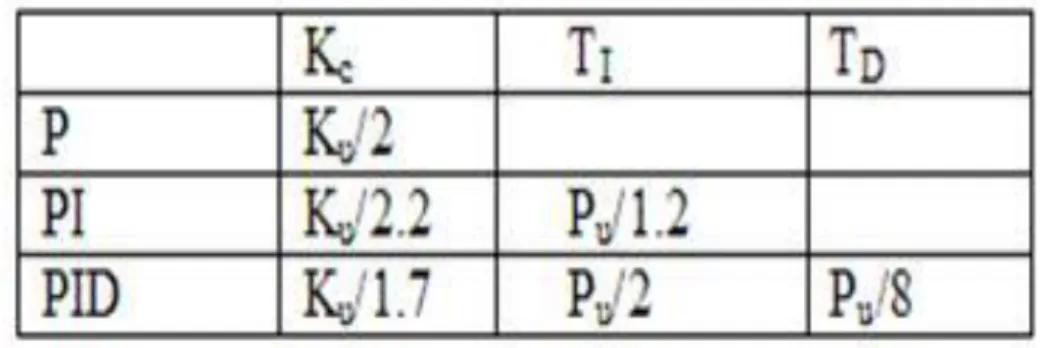
1.7.3 Zeigler nichols
Zeigler Nichols Presented a technique for tuning the PID controller, which is closed loop method. In closed loop used two methods, which are continuous cycling method and damped oscillation method. Both methods have same working, but behavior of oscillation is different. We take Kp constant while values of Ki and Kd are zero. Kp is varies until oscillation of system become constant. The gain at which system give constant oscillations is called ultimate period. The period of oscillations is called ultimate period. After constant oscillation we can change the values of P, I and D in PID controller by ZN table(: R. Sen, C. Pati, S. Dutta, and R. Sen,2014).
Figure 1.9: Zeigler Nichols Table Source: R. Sen, C. Pati, S. Dutta, and R. Sen,2014
2. SYSTEM AND COMPONENT MODELING
In this chapter we discuss the renewable energy resources like wind turbine, PV and Energy Storage System (ESS)which is connect with each subsystem and help to share power with each subsystem and main grid.
In this chapter also discuss different renewable energy sources (RES) and type of (ESS) and also which kind of RES and battery used.
2.1 Renewable energy system
Renewable resources haveinfinite natural resources that can be restore in a short time. RES have lot of energy resources by which we can get energy.
Renewable energy is generated by following NS.
2.2 Type of RES Bio mass Solar wind Tidal Geothermal
In this work used solar and wind as renewable energy sources (renewable energy,2014).
2.2.1 Solar
Solar power (photovoltaics) is most fastest growing and popular sources of unconventional energy. SC are mostly made of crystalline silivon particles. The process includesSCwhich depend on the PV impact to retain photons and change them into electrons. Then, SolarThermal Power (another type of s olar
power) depends on focal points to think an enormous territory of sunlight, or (STE), onto a little area on surface(N. K. M. A. Alrikabi,2014).
First, photovoltaic power was used for small mediums sized tasks, later on since 1980 solar based plant used for commercial area and used commonly. In addition to the fact that they become cheap as comapre to get power from the grid.
Today, use of PV power is increased, solar based power is additionally progressively utilized in matrix associated circumstances as an approach to encourage low-carbon vitality into the framework. International Energy Agency predict that in 2050, we will able to get 25% of energy by solar cell (renewable energy,2014).
.
2.2.2 Solar cell
SC is make of semiconductor. Semiconductor used in solar cell are silicon, gallium arsenide and cadmium telluride[8]. These semiconductor converts sunlightenergy into electricity. When sunlight fell on the solar cells,itmakes a positive and negative junction due to free electron and holes. If we connect the positive and negative junctions of solar cell with to DC electrical equipment, then current is flowing to the device/circuit. Solar cellsgive DC power to DC electrical equipment((N. K. M. A. Alrikabi,2014).
Sunlight energy is called photons. These photons come in form of package which is called quantum. The energy of a quantum is depending upon the wavelength of sun light or electromagnetic waves.he electric flow streams just if the vitality of every quantum is more prominent than WL - WV (limits of valence and conductive groups).
The relation among the incident photon and frequency is following[10]:
2.2.3 Solar Cell Characteristic
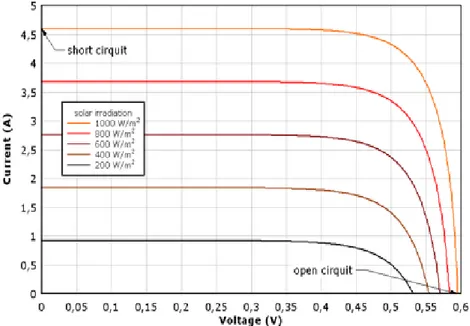
Figure 2.1: V-I Characteristic at different irradiation of Solar cell Source: Green,M.A,1981
Figure 2.2: Power characteristicSolar cell at different irradiation value
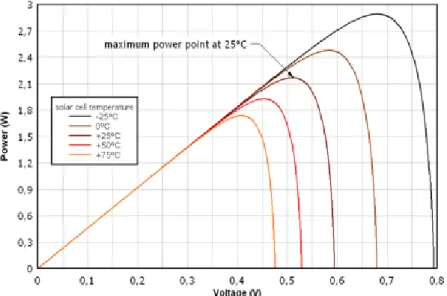
Figure 2.3: V-I characteristic of Solar cell with different T
Source: Green,M.A,1981
Figure 2.4: Power characteristic Solar cell with different temperature Source: Green,M.A,1981
2.3 Crystalline Silicon PV module
Two class of crystalline silicon (C-Si) are used to create PV module, which are single crystalline silicon and multicrystalline silicon. The polycrystalline silicon PV module has less change proficiency than single crystalline silicon PV
module. CS PV module have 12% transformation
2.4 Amorphous Silicon PV Module
Amorphous silicon (a-Si) PV module get more light than crystalline silicon PV module. So, it tends to be made slenderer. It suits for any applications that high effectiveness isn't required, and ease is significant. Amorphous silicon module has efficiency appr. 6%( A. M. Bagher, M. Mahmoud, A. Vahid, and M. Mohsen,2018).
2.5 Hybrid Silicon PV Module
A joining of single crystalline silicon encompassed by flimsy layers of formless silicon gives astounding affectability to bring down light levels or roundabout light. The Hybrid silicon PV module has most significant level of change productivity about 17%.
Each solar cellconnected to eachother to form a module called solar module or PV module. These modules are connected to each other to form an array called PV array array to connect series and parallel (J. F. Kreider and F. Kreith, 1981).
.
Output current increase if PV array connected parallel. Output voltage increase if PV array connected series
2.6 Mathematical Modeling of PV
Figure 2.5: Circuit of PC
Source: J. F. Kreider and F. Kreith,1981
The diagram shown the identical circuit of PV cell. In which lph current source show the current of photo cell. Rs and Rsh are taken as series and intrinsic shunt resistance of cell. Regularly the value of Rshtake large and Rs is keep small, so that they may be ignored to make simpler foranalysis. Practically, PV cells are
assembled in bigger units called PV modules and these modules associated in arrangement or parallel to make PV array which utilized to produce power in PV age frameworks. The equal circuit for PV cluster appeared in Fig. 14
Figure 2.6: Photovoltaic array Source: J. F. Kreider and F. Kreith,1981
The equation for characteristic of voltage and current for solar cell are given below.
[ ( )] ( ) Here,
show the photo-current (A) show the short current (A)
show the short current of cell
T show the operating temperature (K) irradiation of solar in (W/m^2)
The equation use for reverse saturation current is.
[
* ( )+ ] q =1.6021765 × 10⁻¹⁹ c
voltage of OC (V)
Ns denotescells connected in series n denotes identification of the diode
k denotes Boltzmann’s constant, = 1.3807 x 10 -23
(J. · K -1 )
which is (saturation current ) differs with temperature of the cell.The equation below show the relation between and cell temperature.
[ ] [ ( )] Tr= 298.15 K => (nominal temperature)
Eg0= 1.1 eV =>(band gap energy of the semiconductor) Hence,
The outputof PV module is :
[ ( ) ] With, (5) ( ) Now,
denotesPV modules connected in parallel Ω is for series resistance
shows shunt resistance (Ω)
thermal voltage of diode which is (V).
2.7 Boltzmann's Constant:
It is a theory which talks about the ratio b/w gas constant & Avogadro constant is called Boltzmann’s Constantwhich is a Austrian physicist named Ludwig Boltzmann (1844-1906).
It shows the relation of absolute temperature and K.Ewhich is contained by every particle in ideal gas.
k or k B symbols are used to show Boltzmann’s constant
And ithave a value of almost 1.3807 x 10 -23(J · K -1 ). Overall, absolute temperature has a direct relation withthe energy of a gas molecule that means As temperature increasesit increases the kinetic energy of molecules.
Figure 2.7: Modelling of PV 2.8 Wind
A type of sunbased vitality is called Wind. Which is created du e to uneven temprature increas of climate caused by sun, inconsistencies of the world's surface, and turn of the earth. World's territory, waterways, and vegetative spreads are the factors involving in Wind stream designs alteration.Today wind turbines are used to generate power from these breeze stream.
2.8.1 Wind power
It is defined in a simple way that “A power which is generated by Wind”. it is the process in which wind power is used to generate mechanical power &electricity. In this process kinetic energy converted in to mechanical energy by the help of Wind turbines. The power generated by these wind turbines can be used in many ways like for grinding grain or pumping water or a generator can convert this mechanical power into electricity power that can be given to homes, businesses, schools, and industrial.
2.8.2 Wind turbine
Wind turbines are fans same like propellers of air ships having panels with cutting edges turning inand moving the air to produce energy this turbine connected with generator that provide electric flow. In other words, a wind turbine is something contrary to fan. The only difference is that fans use power to convert into wind but turbines use wind to make power Wind rotates the edges of propellers fixed on pole connected with a generator which generates power.
2.8.3 Types of wind turbine
There are two types of WT’s whichare mostly use now a days.
one is the horizontal-axis, i.e. traditional farm windmills used for pumping water, and other is thevertical-axis, i.e. the eggbeater-style Darrieus model, named after its French creator. Most enormous current wind turbines are flat hub turbines.
Following are the factors involving controlling the power of wind turbine,
Speed of Turbine
Cutting edge of rotor
Pitched angle of rotor
Pitch point of cutting edge
Measurements of turbine
Turbine’s region
HAWT & VAWT (rotor’s geometry)
Speed of wind
A connection b/w yield control &different factors establish in numerical model of turbine. Scientificaly, model of WT based on the comprehension conduct of WT its district of activity, furthermore it demonstrating empowers control of turbine's execution.
2.8.4 Turbine model’s mathematical formula
Mathematicaly it is E=W=F,E is the kinetic energy,where W is work done in which object of mass m and velocity v is displacing the object from rest to a distance under a forces (F).
As we know,
( ) (according to Newton second law of motion)
Here value of F is K.E. Then equation become
( ) According to kinematic of solid motion
v2= u2 + 2as
According to above equation, the acceleration of an object is a = v2−u2/2s.
Assume that the initial velocityis zero, after puttingin above equation then get acceleration.
a = v2/2s.
now put the value of a in equation (2)
( ) This K.E equation based on that we take object’s mass as constant.
But if we take wind as a fluid due to moisture in air then density and velocity can change. So, the mass of object is not constant. In this paper we will expect that the thickness of air doesn't change significantly indeed, even if variation in elevation & temperature accours in eq.3it utilize the law of kinetic energy. Subsequently in eq.3 K.E of(m) mass in joules moving with speed (v), wind can be determined.
Then the rate of change in K.E is based on power in the wind.
(
Here dm/dt is equal to ρAvw, where A is the area by which wind is flowing and ρ show density of air. By putting these values, the equation become
( )
Actual power Pw (w) produce with rotor blades.The difference b/w upstream and downstream power.Pw (w) is equal to the difference b/w the upstream and the downstream WP.
( ) ( ) Where,
Vu represent velocity of upstream wind, when wind is entering of the rotor blades.
Vd represent velocity of downstream wind, when wind is withdrawal of the rotor blades.
Both upstream and downstream velocity take in m/s.These velocities increase the TSR. According to the mass flow rate, we can write.
( ) ( ) vwrepresent/denote the average velocity of the velocities of wind, when it enter and withdrawal of rotor blades of turbine. With this expression, equation (6)will become, ( ) ( ) [ ( ) {( ( ) ( ) ( ) )} [ ( ) ( ) Here ( ( ) ( ) ( ) )( )
The Cp is the ratio of upstream wind power. Cpcalled the Betz limit. The value of power coefficient is not a static. It changes with TSR of the wind turbine. Suppose the λ is the ratio vd to vuof the turbine. Then we can write it’s as.
( )
( ) λ is the TSR of the wind turbine. The unit of the BTS is m/s.
( )
( )
where R, ω are radius and angular speed of turbine, whose unit is r/s.. Put the equation (10) in equation (9),then we get
Cp = (1 + λ)(1 − λ2) 2(13)
Now we take Differentiate Cp w.r.t λ and suppose the differentiate is equal to zero to find the value of λ, which makes Cp a maximum
dCpdλ = (1+λ).(−2λ)+(1−λ2).1 2 = 0
After taking differentiate and putting equation is equal to zero we get the value of λ are below.
λ = −1 or λ = 1/ 3
The Cp is maximum at λ = 1/ 3. At λ = 1/ 3, Cp = 16/27.
Hence the Betz limit says that wind turbine cannot convert more than 16/ 27 (59.3%) of the K.E of the wind into M.E, i.e. Cp(max) = 0.59. Wind turbines can’t operate at this maximum limit though. The real world is well below the Betz limit with values of 0.35 to 0.45.
If the rotor of a WTmoves too slowlythan most of the wind passedb/w area of the blades. Then WT produced less power. But,if the rotor moves too fast, the rotating blades behave as a solid wall obstructing the wind flow again overcome the power extraction.So the turbines designed such that it operate at their optimal wind TSR(λ) in order to harvestmore power as possible from the wind
stream. Theoretically if the value of λ is higher,then it’s better for terms of efficient operation of the generator. But high λ have become causes of dissolution of leading edges of the blades due to influence of dust present in the air. This would require use of special erosion resistant coating material that may increase the cost of energy. The vibration and noise generation also increase with increase in λ and reduced rotor efficiency due to drag and tip losses and excessive rotor speeds can lead to turbine failure. Other factors that impede complete energy conversion in a complete turbine system are things such as gearbox, bearings, number and shape of blades.Only 10 to 30% power of the wind transformed into usable electricity(A. W. Manyonge, R. M. Ochieng, F. N. Onyango, and J. M. Shichikha,,2012).
According to equation which shown below. Air density ρ is input quantity at the rotor system. ρ is a function of temperature andair pressure. When air pressure increases, ρ also increases. When air temperature will decrease, ρ willincreases.
( ) Here, R is the gas constant. Both T and pressure decline with expanding height. Consequently, site area is significant as height has significant impact on control created because of air thickness variety.
If we take Patm = 14.7psi, T = 60F and ρ = 1.225kg/m3. Pressure and temperature both are vary with elevation. This affects of the air density bring the following relation
( ) ( ) where Hm is site elevation in meters. Air density corrections can be important at high elevation
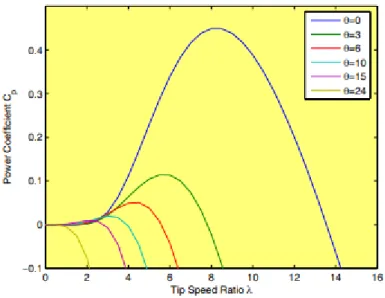
The Cp is the most important parameter in power regulation. For example, models Cp as a function of the tip speed ratio and the blade pitch angle θ in degrees as.
( ) ( ) ( )( )
Where the values of the coefficients C1 to C6 and x depends on the turbine type.
( ) where θ is the pitch angle of the blade.
Figure 2.8: Simulated power coefficient
Source: A. W. Manyonge, R. M. Ochieng, F. N. Onyango and J. M. Shichikha,2012
Figure 2.9: Simulated Power Constant (with variation of constant C4) Source: A. W. Manyonge, R. M. Ochieng, F. N. Onyango and J. M. Shichikha,2012
2.8.5 Wind MPPT
MPPT algorithms play an important role in any RS. WES needs the mathematically formula to harvest much energy as possible. Because according
to Betz theory you can get only 59.3% of total 100%.Wind changed into the mechanical energy. Hence wind mills are operated at its maximum power point. ButSE harvest less energy due to affected of some factors like changing of solar radiation, installed small surface area, shading effect and other weather conditions etc(leonics,2019).
Mostly MPPT have three type which are.
Tip Speed ratio control (TSR)
Power Signal feedback (PSF)
Hill climb search (HCS) based.
TSR control strategy manages the WT rotor speed to keep up an ideal TSR and requires estimation of both the WS and turbine speed. The ideal TSR for a given breeze speed is acquired from the turbine generator attributes and fluctuates from framework to framework.
Besides, in this plan the machine is constantly working at its ideal TSR, which is a quality of the given WT. This ideal worth is put away as the reference TSR in the control PC. The BS is consistently estimated and contrasted and the sharp edge tip speed.In TSR control, the turbine shaft speed is straightforwardly controlled to keep up the ideal TSR processed utilizing estimated wind and turbine shaft speeds. [4] Although this technique is basic and natural, it depends exceptionally on the exactness of the WS estimation, as the information is profoundly irregular so at each progression of progress in speed will fundamentally shift the TSR and as it brings about changing the Cp (control coefficient) ( B. Pakkiraiah and G. D. Sukumar,2016). The general streamlined productivity relies on the power coefficient (Cp) and it is a component of cutting-edge pitch edge (β) and tip speed proportion (λ). Normally the edge pitch point (β) taken as zero for little and medium breeze speeds. TSR control legitimately manages the turbine speed to keep the TSR at an ideal incentive by estimating wind speed and turbine speed.
2.9 Pitch Angel Control
The pitch control technique is an essential methodology for controlling the rotational speed of wind turbine. The ordinary cutting-edge pitch edge control techniques are create in this part. The pitch edge reference b,is constrained by the information esteems, which might be as per the following.
The immediate proportion of the WS makes this control system straight forward. Anyway, this is certifiably not an appropriate method, since it is hard to gauge the WS correctly. Truth be told, when the rotor speed surpasses the most extreme rotor speed of turbine Ωtn, the pitch edge is expanded to decrease the turbine torque Ct.
2.10 Battery Storage system
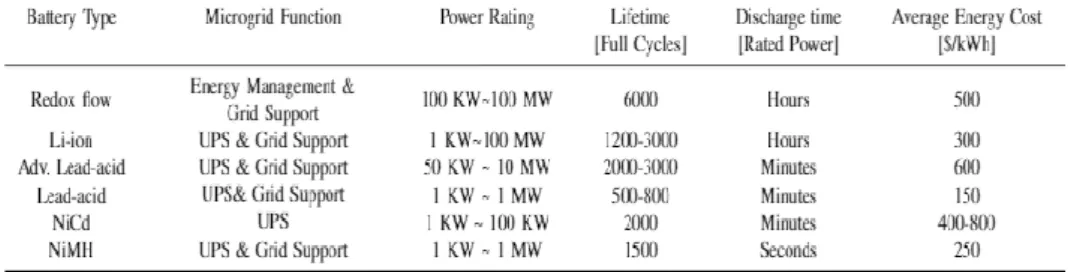
Batteries are a significant piece of any micro grid framework, since they can improve framework unwavering quality, execution and generator effectiveness. The battery throughput can altogether limit fuel utilization. This segment presents the most widely recognized battery types for the remote micro grid which are(D. Semënov, G. Mirzaeva, C. D. Townsend, and G. C. Goodwin,2017):
NiCad batteries
NiMH batteries
Li-ion batteries
In this novel we used only Ni-MH battery. 2.10.1 Ni-mh batteries:
A NiMH is rechargeable battery like NiCd batteries. The cathode of the NiMH cells are made of (NiOOH) and anode is formed by a hydrogen absorbing alloy. The capacity of NiMH is three time greater as compare to same size of the NiCd and give 80 Wh/Kg energy. NiMH are mostly use in electronic, smart grid and hybrid vehicles due technology that used in battery and low cost( IEEE Smart Grid,2018).
Figure 2.10: Comparison of different ESS Source: D.Semënov & G.Mirzaev, August 2017 2.10.2 Energy storage system (ess)
At some random time during the day, the control framework decides the necessary power from the ESS so as to keep up the power underneath the predetermined estimation of the Maximum power permitted from the lattice. In spite of the fact that the power rating and limit of the displayed ESS are individually indicated in kW and kWh with respect to a Battery Energy Storage System (BESS).Energy stockpiling, in any case, gives something beyond a strong wellspring of intensity. It additionally serves other significant capacities, including smoothing discontinuous PV control stream, giving var support, hardening the voltage for the rest of the network, and giving pinnacle shaving. Vitality stockpiling can likewise help expand to what extent sun based is creating power during the day by moving PV yield to be increasingly incidental with tops. At long last, it can help with islanding and dark beginning, paying little heed to whether the sun powered asset is dynamic(E. S. Technology, E. Energy, and H. Abdi,2019).
2.11 Battery Controller
Essentially controller control charging and discharging of battery. The power generated by RES is not enough to gives power to load, so in this scenario battery give the power to load.
But when RES generated more power than require load then controller PIC give extra power to battery and battery go to charging state.
2.11.1 State of charge (SOC):
The (SOC) of a battery signifies the limit that is right now accessible as a component of the evaluated limit. The estimation of the SOC fluctuates somewhere in the range of 0% and 100%. If the value of SOC is 100%, then battery is fully charged. if the value of SOC of 0% demonstrates that the battery is totally released. In functional applications, the SOC isn't permitted to go past half and consequently the battery is revived when the SOC arrives at half. Also, as a Battery begins maturing, the most extreme SOC begins diminishing. This implies for a matured cell, a 100% SOC would be equal to a 75% –80% SOC of another battery.
3. PROPOSED METHODOLOGY
In this novel we have four DES(distributed energy sources) which supply the power to grid. Each Subsystem connected with the battery for powerstoring and connected in parallel to each other. Output of each subsystem is converted into AC by inverter. Output supplied to the grid. Our aim in this thesis is to obtain three phase powerto the load connected with grid, that varies with different load conditions, Each Subsystem has direct connected load, the sp are power the shared with the grid and also given to battery to maintain SOC (state of charge) of the battery so that in case of absence of any resource the demand could be feed properly with the help of Battery storage.
Networked Microgrid have four subsystem whose detail are as given below, Subsystem 1 (PV Module & Wind turbine)
Subsystem 2 (PV) Subsystem 3(PV) Subsystem 4(PV)
System 2, 3 and four are quite similar to each other there is only a difference in the load. So we will discuss system 1 and system 2.
3.1 Subsystem 1 (PV Module& Wind turbine)
Figure 3.1: Networked Microgrid
3.1.1 Subsystem 1(pv & wind turbine) methodology:in this subsystem we have two pvmodules&a wind turbine system. the layout of first subsystem is like asshown below,
3.1.2 Operation of PV System
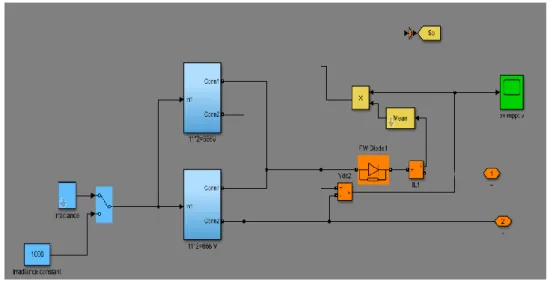
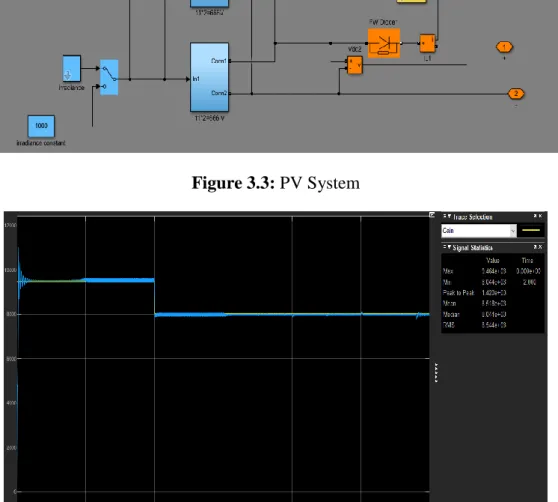
We have used two solar modules each produces 666 volts and they are connected to each other in parallel, here two values of solar irradiance (Constant 1000 & Variable) connected with solar array by a manual switch. A system is deployed to track the MPPT of the output of solar modules, a free-wheeling diode is used to prevent the system from the reverse currents in the system.
Figure 3.3: PV System
Above pictures gives the stats of the generated power by solar modules, initially there is instability in the system which is in transients condition, later this become stable in steady state operation. After 2 unit index on the x -axis, there is a little reduction in power dues to the variability of the solar irradiance, and hence there is a little less power obtained by the system, we can see the stats on the gain table, the mean value of the power is about 8.5kw and the peak value is around 10kw in steady state operation.
3.1.3 Operation of wind energy System
The wind energy system shown below is drawn with the help of Simulink firstly a mechanical turbine is fed by three mechanical inputs which are pitch angle, base torque and wind speed, these elements rotates the blades of the turbine whose shaft is coupled with permanent magnate synchronous generator and hence the rotation leads the alternator which provides three phase electrical energy, and then this energy converted into DC with the help of rectifier syst em and then its filtered with a T filter to remove the AC ripples and then shared with the common coupling bus of the system. Most of the energy of the system provided by wind energy resource.
Figure 3.6: Power Generated by wind turbine system
Above shown graph gives us the representation of the power obtained by the wind energy resource, this power is measured at the output of the permanent magnet synchronous machine which is AC, (later its converted to DC). As we can see the power is zero initially later on as the WT starts to rotate and the energy generated from index 1 from the x-axis and reached to the optimal value according to the input parameter, but we can see that the generated power is being fluctuated all the time because of the irregular speed and torque conditions applied at the input of the turbine blades. At the time index 3 on the x-axis, there is almost a drop of 50 percent in the power that shows that the air input is way too decreased.
3.1.4 Operation of battery System
The battery system also known as storage subsystem is the backup system which is deployed to share the power to the grid in case if there is any resource is absent or there is extra load connected to the grid system, this system is consi st of A battery bank, here we have used the 200 volts 6.5 Ampere hours Ni -MH battery, IGBT’s for switching purposes, the battery power, state of charge and voltage monitor system, the battery system controlled by PID controller system (which will be discussed later), if the battery state of charge is below than the permissible limit the backup diesel engine will be switched on so that the load will get the abrupt supply from the system, and also battery will be recharged if
there is excess power available on the system. There is an inductor L3 used in series with IGBT and battery for protection purposes.
Figure 3.7: Charging and discharging of Battery System
Figure 3.8: SOC and Voltage of Battery Subsystem 1
The above graph is giving the information about the voltage and SOC. If we observe in transient mode of voltage monitor system, there is a damping fluctuation and after some time we can observe a stable voltage of battery during the charging, as the voltage of battery are increased the state of charge is also increased, at time index 2 there is a little decrease in the voltage but battery is still being charged so there is a downward tilt but again the SOC will continue to improve.
3.1.5 Operation of PID controller:
This is basic control system for switching process of battery to operate at different time according to the load and other resources.
Here, two parameters of battery are taken into consideration that are voltage and battery soc,
Initial Soc of battery 85% and response time 30 second that means w henever soc reach to 80%,it indicates that battery is fully charged.
This part is for voltage regulation of the battery this part will decide when voltage to increase andwhen to drop, whenever it senses load power is not compensated by other resources then it provides pulse to the switches s1 and s2, in this input to the PID is the comparison value of vdc and reference value. PID works to achieve desired value. It provides switching pulses through s1 and s2 which in input to the MOSFET.
Battery management using soc control system here input is soc of the current situation, in next step it is compared with some value of soc, that whenever the soc reached its minimum it provides pulses to s1 and s2 for recharging of battery.
Figure 3.9: Power Control by PID Controller 3.1.6 Operation of PWM Inverter:
As the circuit shown below, three phase inverter is used to convert the DC power of first subsystem is converted to 3-phase AC with a standard frequency of 50-Hz, we need to remember that the output power of solar s ystem is DC and
the output of Wind system is AC, so we converted the Wind generated power to DC and then both are converted to 3-phase AC. This system is made of IGBT’s, and then this power is filtered with the help of LC filter so the DC components can be removed from the power so that the power quality of the system can be maintained.
Figure 3.10: Operation of PWM Inverter 3.2 Subsystem 2 PV Module
Subsystem 2 is just consists of PV modules, it has local load, battery storage system and the PID controlling mechanism, it has less power sharing capability as compared with subsystem 1.
3.2.1 Operation of PV System
Figure 3.12: Operation of PV Module
We have used two solar modules each produces 666 volts and they are connected to each other in parallel, here two values of solar irradiance (Constant 1000 & Variable) connected with solar array by a manual switch. A system is deployed to track the MPPT of the output of solar modules, a free-wheeling diode is used to prevent the system from the reverse currents in the system.
Figure 3.13: Irradiation of Solar Panels
Above pictures gives the stats of the generated power by solar modules, initially there is instability in the system which is in transients condition, later this become stable in steady state operation. After 2 unit index on the x -axis, there is
a little reduction in power dues to the variability of the solar irradiance, and hence there is a little less power obtained by the system.
3.2.2 Operation of battery System
Figure 3.14: Operation of battery System
The battery system also known as storage subsystem is the backup system which is deployed to share the power to the grid in case if there is any resource is absent or there is extra load connected to the grid system, this system is consist of a battery , here we have used the 200 volts 6.5 Ampere hours Ni -MH battery, IGBT’s for switching purposes, the battery power, state of charge and voltage monitor system, the battery system is controlled by PID controller syst em (which will be discussed later), if the battery state of charge is below than the permissible limit the backup diesel engine will be switched on so that the load will get the abrupt supply from the system, and also battery will be recharged if there is excess power available on the system. There is an inductor L3 used in series with IGBT and battery for protection purposes.
The above graph is giving the information about the voltage and state of charge of the battery system. If we observe in transient mode of voltage monitor system, there is a damping fluctuation and after some time we can observe a stable voltage of battery during the charging, as the voltage of battery are increased the state of charge is also increased exponentially, at time index 2 there is a SOC line is stable.
3.2.3 Operation of PID controller:
This is basic control system for switching process of battery to operate at different time according to the load and other resources.
Here, two parameters of battery are taken into consideration th at are voltage and battery soc,
Initial Soc of battery 40% and response time 30 seconds.
This part is for voltage regulation of the battery this part will decide when voltage to increase andwhen to drop, whenever it senses load power is not compensated by other resources then it provides pulse to the switches s1 and s2, in this input to the PID is the comparison value of vdc and reference value. PID works to achieve desired value. It provides switching pulses through s1 and s2 which in input to the MOSFET.
Battery management using soc control system here input is soc of the current situation, in next step it is compared with some value of soc, that whenever the soc reached its minimum it provides pulses to s1 and s2 for recharging of battery.
4. EXPERİMENTS & RESULTS:
4.1 Subsystem1
Figure 4.1: PV module DC output power behavior
Figure 4.3: Battery voltage and SOC behavior of subsystem 1
4.2 Subsystem2
Figure 4.5: PV module DC output power behavior
Figure 4.7: Behavior graph of power of Subsystem 2 at grid side 4.3 Subsystem 3
Figure 4.8: PV module DC output power behavior of subsystem 3
Figure 4.10: Behavior graph of power of Subsystem 3 at grid side 4.4 Subsystem 4
4.4.1 Battery voltage and SOC behavior of subsystem 4
Figure 4.12: Behavior graph of power of Subsystem 4 at grid side 4.5 GRID Side Parameters
Figure 4.14: 3-phase AC Voltage depiction on grid sideVoltage
Figure 4.15: 3-phase AC Power depiction on grid side
Figure 4.17: Power of Subsystem 1
Figure 4.18: Power of subsystem 2
Figure 4.19: Power of subsystem 3
5. CONCLUSION
A system containing 4 subsystems each has local generation, storage, and the load. The shortage of generation is coped smoothly by storage subsystems. Extra energy is stored in the storage subsystem and is readily available to supply any other subsystem in the system if the other subsystem is lagging in power meeting criteria to its local load. As well as the subsystems are also ready to share the supply to the grid if needed.
Storage Subsystem is designed in such a way so that the operational life of the batteries can be enhanced by maintaining the SOC within the permissible limits of efficient use of batteries.
5.1 Suggestions
For the efficient and systematic result of Voltage and frequencies For the efficient For the efficient and systematic result of Voltage and frequencies (without Harmonics) try to establish small level of microgrid system by using different practical results that represent vital role of the including inverter that also produced capable PID Controller.
REFERENCES
Applications, P. Asmus, A. Cornelius, and C. Wheelock, “Microgrids Islanded Power Grids and Distributed Generation for,” 2009.
S. Gorjian, “An Introduction to the Renewable Energy Resources,” 2018. C. Science, “ENERGY MANAGEMENT AND MULTI-LAYER CONTROL
FOR NETWORKED MICROGRIDS By,” 2015.
“PID for Dummies - Control Solutions.” [Online]. Available: https://www.csimn.com/CSI_pages/PIDforDummies.html. [Accessed: 25-Nov-2019].
“How Does a PID Controller Work? - Structure & Tuning Methods.” [Online]. Available: https://www.elprocus.com/the-working-of-a-pid-controller/. [Accessed: 21-Nov-2019].
R. Sen, C. Pati, S. Dutta, and R. Sen, “Comparison Between Three Tuning Methods of PID Control for High Precision Positioning Stage,”
Mapan - J. Metrol. Soc. India, vol. 30, no. 1, pp. 65–70, 2014.
H. O. Bansal, R. Sharma, and P. R. Shreeraman, “PID Controller Tuning Techniques: A Review,” J. Control Eng. Technol., vol. 2, no. November 2012, pp. 168–176, 2012.
“What are the different types of renewable energy?” [Online]. Available: https://phys.org/news/2015-06-renewable-energy.html. [Accessed: 21-Nov-2019].
N. K. M. A. Alrikabi, “Renewable Energy Types,” J. Clean Energy Technol., vol. 2, no. 1, pp. 61–64, 2014.
R. Bright, “Selecting cable strain reliefs,” Electron. Prod. (Garden City, New
York), vol. 50, no. 3, 2008.
“Solar Cells.” [Online]. Available:
http://www.pvresources.com/en/solarcells/solarcells.php. [Accessed: 25-Nov-2019].
A. M. Bagher, M. Mahmoud, A. Vahid, and M. Mohsen, “Types of Solar Cells and Application Types of Solar Cells and Application,” no. April 2018, 2015.
J. F. Kreider and F. Kreith, “Solar Energy Handbook,” J. Sol. Energy Eng., vol. 103, no. 4, pp. 362–363, 1981.
A. W. Manyonge, R. M. Ochieng, F. N. Onyango, and J. M. Shichikha , “Mathematical modelling of wind turbine in a wind energy conversion system: Power coefficient analysis,” Appl. Math. Sci., vol. 6, no. 89– 92, pp. 4527–4536, 2012.
“Basics of Maximum Power Point Tracking (MPPT) Solar Charge
Controller.” [Online]. Available:
http://www.leonics.com/support/article2_14j/articles2_14j_en.php. [Accessed: 25-Nov-2019].
B. Pakkiraiah and G. D. Sukumar, “Research Survey on Various MPPT Performance Issues to Improve the Solar PV System Efficiency,” J.
D. Semënov, G. Mirzaeva, C. D. Townsend, and G. C. Goodwin, “A battery storage control scheme for AC microgrids,” 2017 20th Int. Conf.
Electr. Mach. Syst. ICEMS 2017, no. August, 2017.
IEEE Smart Grid, “Battery Storage Systems,” no. February, pp. 1–64, 2018. E. S. Technology, E. Energy, and H. Abdi, “Learn more about Energy Storage
System Energy Storage Systems Introduction to electrical energy sys - tems THE APPLICATION OF WAYSIDE EN- ERGY STORAGE SYSTEMS TO ELEC-,” 2019.
RESUME
Name Surname: Bilal Hassan
Place/Date of Birth: Faisalabad ,Pakistan, 23-03-1988 E-mail: [email protected]
Education:
2009-2014, BSC The University of Faisalabad, Electrical Engineering
2016-2020 MSC İstanbul Aydın University-Doctorate, Electrical and Electronics Engineering.
Work Experience:
2019-2020 Maintenance Engineer at Nobel Xray İstanbul,Turkey Languages:
Urdu: Native Language
English: Advanced
Turkish: Intermediate
Skills:
Communication, Teamwork, Problem Solving