VALUATON OF TIME PREFERENCES ACROSS REGIONS IN TURKEY
ZEHRA CİVAN AYZİT 109620003
ISTANBUL BILGI UNIVERSITY INSTITUTE OF SOCIAL SCIENCES
FINANCIAL ECONOMICS
ASSISTANT PROFESSOR ENGIN VOLKAN UMUT KESKİN
III FOREWORD
This study is a master’s thesis prepared for and presented to Istanbul Bilgi University, Institute of Social Sciences, and MSc in Financial Economics. I would like to express my deep appreciation and thanks to my advisor Assistant Professor Engin Volkan and Umut Keskin for their altruistic attitudes and support and for encouraging me to conduct a study related to the city that I live in.
January 2014 Zehra Civan Ayzit
IV TABLE OF CONTENTS FOREWORD ... II TABLE OF CONTENTS ... IV USED FIGURES ... V USED TABLES ... V ABSTRACT ... VI ÖZET ... VII INTRODUCTION ... 1 1. LITERATURE REVIEW ... 4 2. METHODOLOGY ... 6 2.1. THE SURVEY ... 6 2.2. DISCOUNT FACTOR ... 7 2.2.1. Hyperbolic Factor ... 7 2.2.2. Hyperbolic Discounting ... 8 2.2.3. Constant Discounting ... 9 3. DATA ... 10 3.1. DIYARBAKIR ... 10 3.2. SURVEY DATA ... 12 4. RESULTS ... 13 5. CONCLUSION ... 23 APPENDIX ... 24 REFERENCES ... 31
V USED FIGURES
Figure 1-Survey answers of 1st and 2nd questions. ... 13
Figure 2- Survey answers of 3rd and 4th questions. ... 13
Figure 3-Constant Discounting Values for One-month ... 14
Figure 4-Constant Discounting Values for Four-month ... 15
Figure 5-Hyperbolic Discounting For OneMonth ... 16
Figure 6-Hyperbolic Discounting for 4 Months ... 16
Figure 7-Decreasing Impatience for One-Month ... 17
Figure 8- Decreasing Impatience for Four-Month ... 18
Figure 9-Deviations from Constant Discounting ... 20
USED TABLES Table 1-Hyperbolic factor for one-month and four-month ... 19
Table 2-Testing for Hyperbolic Factor for one-month ... 21
VI ABSTRACT
This study investigates two popular assumptions: hyperbolic discounting and constant discounting used to analyze time preferences or intertemporal choice. Diyarbakir’s social, historical and cultural structure is briefly introduced and the data collected from entrepreneurs in Diyarbakir are processed. All the calculations were applied in accordance with the formulas and assumptions written in Rohde's (2010) article. Entrepreneurs prefer smaller discount rate for long term that is compatible with the conventional discounting we assume for the financial markets. The results showed that constant discounting has a widespread use in macroeconomics; however there are significant deviations from constant discounting. It is shown that impatience decreased in the long term, which is consistent with hyperbolic discounting.
VII ÖZET
Bu çalışma zaman tercihlerini açıklamada kullanılan iki popüler varsayım olan hiberbolik iskontolama ve sabit iskontolama yöntemlerine göre azalan sabırsızlık ve iskontolama değerlerini göstermektedir. Kısaca Diyarbakır’ın sosyal, tarihi ve kültürel yapısı tanıtılmış ve ardından Diyarbakırda yaşayan girişimcilerden elde edilmiş olan veriler incelenmiştir. Tüm hesaplamalar Rohde (2010) ‘nin makalesinde tanıtılan formülasyon ve varsayımlara göre uygulanmıştır. Girişimcilerin sabit iskontolama varsayımına göre uzun vadede daha düşük iskonto oranını tercih ettikleri görülmüştür ki bu durum finansal pazar koşulları ile tutarlıdır. Bu çalışma gösteriyorki sabit iskontolama makro ekonomide yaygın olarak kabul görmüş olmasına rağmen sabit iskontolamadan belirgin sapmalar söz konusudur. Hiperbolik yaklaşım ile tutarlı olarak hiperbolik faktörün uzun vadede azaldığı görülmektedir, diğer bir değişle uzun vadede sabırsızlık azalmıştır.
1 INTRODUCTION
Intertemporal choice is what we do when we make trade-offs between costs and benefits occurring at different points in time. (Lowenstein, Read, & Baumister, 2003, s. 2) Intertemporal choice or time preferences are important subjects not only for economists, they are also significant for psychologists. There are several studies analyzing time preferences and intertemporal choices. This thesis is an experimental study that attempts to explain the investment behaviors of entrepreneurs living in Diyarbakir under the assumptions of hyperbolic and constant discounting.
At first, the theoretical perspective was examined and articles, books, web sites, and lecture notes have been investigated to achieve this goal. There are numerous hypotheses about how people make intertemporal choices. Koopmans (1960) made a study on the implications of a continuous and stationary ordering of infinite program. His stationarity axiom has achieved widespread use in macroeconomic theory. Thus, there are a lot of empirical studies showing the deviations from constant discounted utility. Thaler (1981) created a questionnaire and found that when the stakes became larger subjects’ actions were closer to the normative model. His subjects had a non-exponential discount rate that was not equal to the market interest rate and the subjects’ interest rate affected by size, sign of reward and length of time. Prelec and Loewenstein (1992) observed that people are relatively insensitive to changes in timing for consumption objects and their model shows that the function is sharply convex for small outcomes. Laibson (1996) observed that preferences may change in time and discount function is hyperbolic. Rubinstein (2003) conducted three experiments and the results were incompatible with constant discounted utility and hyperbolic discounted utility. Prelec (2004) used the second derivative of the logarithm of discount function to measure decreasing impatience and showed the violations of hyperbolic discounting. Rohde (2010) introduced the hyperbolic factor, a quantitative measure of decreasing impatience and time-inconsistency, which can easily be obtained from an indifference pair. (Rohde, 2010, s. 135) Attema at al. (2010) introduced time trade of sequences that provides a new general tool for analyzing intertemporal choice.
The second step was examining the theoretical framework practically by fieldwork. Data were collected from the forty entrepreneurs in Diyarbakir using a questionnaire applied from December 18, 2013 to January 18, 2014. Each survey was carried out by Z. Civan Ayzit at the
2 workplace of participants between 01:00 PM and 06:00 PM. Furthermore, all surveys were conducted under similar environmental conditions. The questionnaire consisted of four parts. First part was used to find the amount that makes the subject indifferent to 200 Turkish Liras in one-month that being the midpoint of not preferred to strictly preferred. The second part was similar to the first part; however, this time the two choices were: in one month and 200 Turkish Liras in four months. In the third and forth parts of the questionnaire the subjects were asked to reveal their choices between the in a certain period of time ∈ 0, months and 200 Turkish Liras in T months, where T = 10 and 16, respectively.
The ages of the subjects ranged between 23 and 60. 18 percent of the subjects were female and 82 percent were male. Only 9 percent of the subjects were managers while 91 percent were owners. Of the thirty four surveys used, six were discarded due to lack of answers. This is the first study that has been conducted among entrepreneurs in Turkey and Diyarbakir. Diyarbakir is the twelfth largest city in Turkish Republic with a population of 1,592,167 in the 2012 census. Population is primarily young. 56.66 percent of the population is below 25. People aged 25-65 constitute 39.18 percent of the population and only 4.15 percent are above 65. (Turkish Statistical Institute, 2012, p. XII). Economy of Diyarbakir depends mainly on agriculture, animal husbandry, minor industries, tourism and trade. Furthermore, industry is mainly based on agriculture. (Deniz, 2010, p. 2)
This study is an experimental application of Rohde’s (2010) theoretical article. Hyperbolic factor and hyperbolic discounting are calculated for each subject by using the formulation of Rohde (2010) and utility assumed linear similar to Rohde’s (2010) study. Constant discounting was also calculated for each subject by using formulation.
The results of hyperbolic discounting factor, Constant Discounting and decreasing impatience are obtained from the formulas of Rohde’s (2010) theoretical article
This thesis introduces the behaviors of entrepreneurs in Diyarbakir. The time points obtained from the questionnaire illustrate that there are distinctive violations from constant discounting despite its widespread use in macro economic theory. Long term constant discounting is smaller than short term constant discounting, which is compatible with the conventional discounting we assume for the financial markets. Hyperbolic factor is smaller in the long term than short term which means that entrepreneurs’ impatience decreases in the long term consistent with the hyperbolic assumption.
3 The first section is the literature review. In this part previous studies have been briefly mentioned and important parts and key differences between these studies have been explained. The second section is methodology. This section consists of two branches. Details about the survey are first described then all formulations and assumptions are explained. Third section is divided into two parts. First part of the third section presents details regarding demographic, historical and social framework of Diyarbakir. In the second part of the third section, data are introduced and theorems are explained in detail. Results are shown in the fourth section. Hyperbolic and constant discounting for one-month and four-month has been explained with histograms. The differences between hyperbolic discounting and constant discounting for one-month and four-month are described in the table. Decreasing impatience for one-month and four-month have also been revealed with the histograms. The fifth section is the conclusion. The survey questions are presented in the appendix.
4 1. LITERATURE REVIEW
In the context of dynamic decision making, large parts of economic theory assume a representing function with constant discounting. There are numerous hypotheses about how people make intertemporal choices. Koopmans (1960) investigated Böhm-Bawek’s (1930) idea of a preference for advancing the timing of future satisfactions from a slightly different point of view. Koopmans started the study by making a sharp definition of impatience, which later became a study on implications of a continuous and stationary ordering of infinite program. One of the important axioms in Koopmans’s paper is the axiom about stationarity. In the article he states that: “We now go a step further and require that preference ordering be
the same as the ordering of corresponding programs obtained by advancing the timing of each future consumption vector by one period (and, of course, forgetting about the common first-period vector originally stipulated). This expresses the idea that the passage of time does not have an effect on preference.” (Koopmans, 1960, s. 293). Koopmans’ axioms play an
important role in identifying intertemporal preferences. Despite its widespread acceptance in economic theory, constant discounted utility (CDU) has been refuted repeatedly in laboratory and field experiments.
Thaler (1981) prepared a questionnaire comprising four questions; one of them about loss of revenue and three of them about revenue gains. The subjects were students at the University of Oregon who answered an advertisement in the newspaper. Although “The standard theory would predict that the discount rate in each cell for each table would be equal for any given person, and differences among people would only reflect differences in borrowing and lending rates.” (Thaller, 1981, s. 205). The result was startling; the discount rates for gains and losses were very different. An interesting result obtained from Thaler’s experiments is that when the stakes became larger, subjects’ actions were closer to the normative model. In his experiment, Thaler observed that the discount rates vary systematically among the cells and differences among individuals are much greater than the variation in interest rates could possibly explain. His subjects have a discount rate that is non-exponential and their discount rate is not equal to the market interest rate, and their preferences are affected by size, sign of reward and length of time.
Laibson (1996) focused on the relationship between hyperbolic discount functions and undersaving. He generalized the discount function and considered a broad class of discount functions. “Such discount functions imply a monotonically falling discount rate. This discount
5
structure sets up a conflict between today’s preferences and the preferences which will be held in the future, implying that preferences are dynamically inconsistent. For example, from today’s perspective, the discount rate between two far-off periods, t and t+ 1, is a long-term low discount rate.” (Laibson, 1996, s. 3). According to Laibson, preferences may change over
time, that is why preferences are inconsistent, and this makes discount function hyperbolic. Rubinstein (2003) claims that there are also violations of hyperbolic discount function. According to Rubinstein, hyperbolic discount function captures the psychological tendencies towards dynamic inconsistency. However, he provides an alternative explanation to such inconsistencies, which work just as well. He conducted three experiments on time preferences. The results of his three experiments are inconsistent with both the constant discount utility and hyperbolic discount utility. He says that there are also empirical findings that support hyperbolic function - like Thaler (1981), Loewenstein and Prelec (1992), Laibson (1997), etc. - however, we cannot ignore the experimental findings which are incompatible with the hyperbolic function. He concludes that “Doing "economics and psychology" requires
much more than citing experimental results and marginally modifying our models.”
(Rubinstein, 2003, s. 1215).
Prelec (2004), shows violations of hyperbolic discounting. If there is an insignificant time interval of the distance time - for example making a choice between waiting ten weeks or eleven weeks for one more movie ticket - stationarity fails to hold. He verifies Ainsle’s prediction that “people seem to be less impatient when stakes are enlarged”. Prelec used second derivative of the logarithm of the discount function to measure decreasing impatience, and according to him decreasing impatience is the major factor that causes dynamic inconsistency.
Rohde (2010) provides a simple method to quantitatively measure the deviations from stationarity. “The advantage of this method is that the utility function doesn’t have to be
measured. Measuring discount factor and utility simultaneously was a major difficulty in earlier studies”. (Rohde, 2010, s. 126). Rohde introduced the hyperbolic factor and showed
that decreasing impatience can easily be obtained from an indifference pair and the hyperbolic factor is an appropriate model to measure decreasing impatience. He concludes that “In
addition to being a simple measure, the hyperbolic factor is useful in characterizing all popular discount models. Generalized hyperbolic discounting holds if and only if the hyperbolic factor is constant and positive. Quasi-hyperbolic discounting holds if and only if
6
the hyperbolic factor is equal to zero for all future points in time except the present. If, in addition, the hyperbolic factor is equal to zero today, then constant discounting holds”. (Rohde, 2010, s. 135).
Attema et al. (2010) says that there are also a lot of deviations from constant and hyperbolic discounting. Attema et al. (2010) thinks that Prelec’s measure is very difficult to observe or analyze. He says that even if we do succeed, the measurements of the discount function logarithms and derivatives still need to be taken to determine Prelec’s measure. Attema et al. (2010) made an experiment and they found violations of some popular hyperbolic discount functions. He introduced time trade of sequences (TTO) to measure discount and utility functions at the same time without an assumption on their functional forms.
2. METHODOLOGY
2.1.THE SURVEY
This is a survey study (Appendix 1) about time preferences and decreasing impatience. Data were collected from entrepreneurs who live in Diyarbakir. The sample consisted of 40 people whose ages were between 23 and 60. These 40 people worked as one of the following: medical doctors, pharmacists, dentists, managers, engineers, and financial consultants. The survey consisted of four parts. For each part, we provide some examples to show how the survey was conducted.
In the first part of the survey we asked the subjects to reveal their preferences over two choices: an amount of currency M ∈ (0.200) offered in one day and 200 Turkish Liras offered
in one month. We started our questioning with the lowest possible M. If the subject preferred the latter to the former, the amount M was increased incrementally. This questioning continued until the subject decided to prefer a certain M∈ (0.200) in one day over 200 Turkish
Liras. This part was used to find the amount that made the subject indifferent to 200 Turkish Liras in one month, that being the midpoint of not preferred to strictly preferred. The second part was similar to the first. However, this time the two choices were: in one month and 200 Turkish Liras in four months. The third and fourth parts were different from the first two as they were assessing the indifference in time rather than a currency amount. There the subjects were asked to reveal their choices between the in a certain period of time ∈
7 A survey was conducted in 10 to 15 minutes and all forty surveys were completed in about 30 days. Surveys were carried out by Z. Civan Ayzit at the workplace of entrepreneurs sometime between 1 and 6 pm. All surveys were conducted in similar environmental conditions. On the last page of the survey, the subjects were asked about their age, gender, annual income, and job. Some of the subjects, mostly firm owners, were reluctant to provide information about their annual income. However, managers were more informative.
We discarded six out of forty surveys due to the failure of subjects to answer the questions.
2.2.DISCOUNT FACTOR 2.2.1. Hyperbolic Factor
According to Rohde (2010) the indifference pair can be constructed with the following steps:
Take any χ 0 and any s, t, τ with s<t, and τ>0; Find µ such that (s,µ) ~(t, χ);
Find σ such that (s + σ ,µ) ~(t + τ, χ). (Rohde, 2010, s. 130) Thus, the hyperbolic factor for every χ 0, s < t and τ > 0 is
(H) , , , = ℎ , 2010, . 130
Rohde states that:
The hyperbolic factor can be obtained from only two indifferences. Suppose a decision maker is indifferent between receiving $105 in t weeks and receiving $100 today. Suppose he is also indifferent between receiving $105 in t + τ weeks and receiving $100 in σ weeks. Thus, if the receipt of $100 is delayed by σ weeks, the receipt of $105 must be delayed by τ weeks in order to maintain indifference.(Rohde, 2010, s. 127)
The calculation can be demonstrated with an example from our survey. Suppose that the subject is indifferent between receiving 200 Turkish Liras in 30 days and receiving 135 Turkish Liras today. Suppose that the same subject is also indifferent between receiving 200 Turkish Liras in 30 days plus 270 days, and receiving 135 Turkish Liras in 187.5 days. Given the parameters s=1, µ= 135, τ= 270, σ=187.5, t=30, χ=200,
the hyperbolic discount factor becomes
8 The hyperbolic discount factor H then, is a good measure of how much individuals deviate from constant discounting and how decreasingly impatient they are.
Rohde (2010) states that;
H gives the hyperbolic factors. In general, H need not always be regular, i.e. H is infinite if tσ = sτ, and negative in spite of strongly decreasing impatience if tσ<sτ. Yet, as we will see later, for the most popular discounted utility models in the literature, regularity holds, i.e. for every indifference pair as in Eq. 1 we have tσ>sτ .(Rohde, 2010, s. 130)
It is eligible for every indifference pair tσ>sτ for our experiment consequently regularity holds. According to theorem 3 in Rohde’s (2010) study;
Theorem 3: Let regularity hold. Preferences exhibit decreasing impatience if and only if H ≥ 0. Preferences exhibit increasing impatience if and only if H
≤ 0.(Rohde, 2010, s. 131)
Hyperbolic factor is also a measure of decreasing impatience according to Rohde (2010).
2.2.2. Hyperbolic Discounting
For each subject, the discount factor is calculated according to the hyperbolic factor formulation presented in Rohde (2010).
“The advantage of hyperbolic function is that we do not need measurements of or assumptions about utilities of outcomes to determine the degree of time inconsistency. That is, a measure of decreasing impatience is introduced, the hyperbolic factor, which can easily be calculated from data without knowledge of utility.” (Rohde, 2010, s. 126).
We assumed utility is linear as in previous literature: Chabris et al. (2006), Rohde (2010), Attema et al. (2010). Discount factor defined by Rohde (2010)
Preferences can be represented by a function V : T × X → R if V(t, χ) ≥ V(s,µ)
⇐⇒
(t, χ) (s,µ). Discounted utility holds if there exists a discount function ϕ and a utility function u such that can be represented by9
where ϕ is continuous and strictly decreasing, ϕ(0)=1, ϕ(t)>0 for every t, and u is continuous, u(0)=0, and there is an outcome χ
∈
X with u(χ) =0.(Rohde, 2010, s. 132)Given the above example from our survey, if 135 = β1*200 then the discount factor for
one-month is 0.675.
Similarly, the discount factor for four-month, i.e. β4, can be calculated using the equality β1*µ2 = β4*u(χ4), implying β4 = 0.42187
2.2.3. Constant Discounting
To compare these results with constant discounting we also calculated constant discounting i.e. βCD introduced in Rohde (2010).
Constant discounting has been a traditional assumption in economics. Preferences satisfy constant discounting if there is a constant discount factor δ such that ϕ(t) = δt for every t. Constant discounting is equivalent to the hyperbolic factor always being zero (Rohde, 2010, s. 133).
And given our example above the constant discounting can be calculated as
βCD= 0.62510*30-187,5 βCD = 6.26144E-20
In the results section comparisons of decreasing impatience, hyperbolic discounting and constant discounting are provided.
10 3. DATA
In this section, the city under study and the structure of the data will be presented.
3.1. DIYARBAKIR
Diyarbakir (Amed in Kurdish; ܐ [pronounced as Amid] in Syriac; Տիգրանակերտ
[pronounced as Dikranagert] in Armenian; Άµιδα [pronounced as Amida] in Greek; ر د
[pronounced as Diyâr-i Bekr] in Ottoman Turkish) is a city located in South-Eastern Turkey. Diyarbakir is surrounded by Şanlıurfa, Gaziantep, Adıyaman, Malatya, Elazığ, Bingöl, Muş, and Batman.
Diyarbakir is located between Asia Minor and Mesopotamia, near the river Tigris (Dicle in Turkish). The city was founded by Hurries in the 30th century BC. It gained more importance during Assyrian invasions and when Meds and Persians captured the city. (Diyarbekir, 2013, p. web). In the 4th century BC, the city was occupied by Alexander the Great. In the 1st century BC, the Armenian King Dikran re-founded the city and named it Dikranagerd. It was the capital city of the Armenian Kingdom. King Dikran forced Jews, Arabs and Greeks to migrate to the city in order to create a rich capital city. (Bournoutian, 2006, pp. 39-41) After the Armenians, the city became part of the Roman Empire and after collapse of the Roman Empire, Diyarbakir was inherited by the Byzantine Empire. Diyarbakir was captured by Arabs in the 7th century. (Eliçalışkan, 2011, p. web). The city was ruled by Arabs for a long time until it was captured by Seljuk Turks in 1085. (Ministary of Culture and Tourism, 2013, p. web). Diyarbakir was occupied as part of the Ottoman Empire by Selim I in 1515. After the Ottoman occupation, other cities and districts around Diyarbakir were occupied and the new cities and districts around Diyarbakir were joined and the State (eyalet in Turkish) of Diyar-i
Bekr was founded (Yılmazçelik, 2000). The city was governed by a Beylerbeyi1 and was the de-facto capital city of the region. (Eliçalışkan, 2011, p. web)
Diyarbakir is a historical city alive with buildings, mosques, churches, towers, gates, castles, mansions, madrasas, bridges, baths, houses etc.; however, the symbol of the city is its walls. The Walls of Diyarbakir are the second largest in the World after the Great Wall of China. (Anadolu Agency, 2014, p. web).
11 Diyarbakir also has unique characteristics in its ethnic and religious structure. Before 1915, more than half the population was non-Muslim. After World War I and the foundation of the Turkish Republic, Christians abandoned the city and Muslims became the majority with migrations from villages around Diyarbakir. Today, Kurds constitute the majority of the population. Furthermore, there are considerable numbers of Zazas and Turks. Additionally, Syrians, Armenians, Assyrians, Chaldeans and Kurdish-Jews also live in Diyarbakir (Andrews, 1992) but as they are extremely small in number their population can be ignored. The economy of Diyarbakir depends mainly on agriculture, animal husbandry, minor industries, tourism and trade. Furthermore, industry is mainly based on agriculture. (Deniz, 2010, p. 2)
Today, Diyarbakir is the twelfth largest city in the Turkish Republic and it is governed by a Metropolitan Municipality. Diyarbakir Metropolitan Municipality consists of the towns of
Sur2, Bağlar, Yenişehir and Kayapınar. Diyarbakir’s population was 1,592,167 in 2012. It has an annual population growth rate of 1.34 percent. 804,952 people are male and 787,215 are female. 1,155,228 people live in the city and 436,909 in the rural areas. In other words, 72.56 percent of the people in Diyarbakir live in the urban areas whereas 27.44 percent of them live in the rural areas. (Turkish Statistical Institute, 2012, p. XII).
According to statistics provided by the Turkish Statistical Institute, the labor force participation rate is 26.9 percent. The unemployment rate is 7.3 percent and the employment rate is 25 percent with confidence interval of 95 percent. (Turkish Statistical Institute, 2013, p. web).
There is a predominantly young population in Diyarbakir. According to the Turkish Statistical Institute, in 2012 56.66 percent of the population was below 25. People aged 25-65 constituted 39.18 percent of the population and only 4.15 percent were above 65. (Turkish Statistical Institute, 2012, p. XII).
In Diyarbakir, gross value added was $3,724 in 2008; however, the overall gross value added in Turkey was $9,384 in 2008. In 2012, the consumer price index was 5.43 percent while it was 6.16 percent in Turkey. In 2010, the percentage of people working in the service industry was very low, compared to Turkey in general. It was 1.65 percent whereas it was 30.63 percent for Turkey. (Turkish Statistical Institute, 2012, p. 5). In 2012, the volume of imports
12 was $69,000,000 and the volume of exports $198,000,000. However, 69 percent of imports and 76 percent of exports in Turkey are made by companies in Istanbul, Bursa, Kocaeli, İzmir and Ankara. (Turkish Statistical Institute, 2012, pp. 17-18).
The rate of emigration was 1,049 percent in 2012. It was the sixteenth largest city in Turkey for population loss. (Turkish Statistical Institute, 2012, p. 15).
In Diyarbakir, in 2012 67.8 percent of economic activities were based on manufacturing. The proportion of manufactured goods in export was 94.3 percent. After manufacture, the second and the third economic activities were based on agriculture and mining. However, in 2012 most start ups were in the trade sector. (Turkish Statistical Institute, 2012, pp. 105-108). 51.3 percent of employees were in the service sector. (Turkish Statistical Institutute, s. 26).
The socio-cultural – in other words partially feudal - structure of Diyarbakir has an effect on economic perspectives and people’s attitudes towards economical issues are totally different. For instance, as we mentioned above, volunteers participating in the survey were offered payment but the majority of them refused the money, since they thought that to receive money simply for participating in a survey was unethical. For this reason, we were forced to convince each volunteer that payment was part of the study.
3.2.SURVEY DATA
Data were collected from entrepreneurs, especially people who are involved in commercial activities. 18 percent of the subjects were female and 82 percent were male. The percentage of females being significantly less than males is because there are mostly males in the social and commercial life of the city. 38 percent of the subjects were aged 20-29, 44 percent were 30-39, 9 percent were 40-49 and 9 percent of the subjects were between the ages of 50-60. 12 percent of the subjects were in the 0-20,000 income bracket, 21 percent were in the 20,001-40,000 income bracket, 21 percent were in the 40,001-60,000 income bracket, 12 percent were in the 60,001-80,000 income bracket, 12 percent were in the 80,001-100,000 income bracket and 12 percent of the subjects earned above 100.001 TL annually. Additionally, 47 percent of the subjects were from the health sector, 44 percent were from the commercial sector and 9 percent of the subjects were managers.
We conjecture that economic uncertainty in Diyarbakir might have increased drastically after December 17, 2013, which influenced time preferences of the entrepreneurs in decreasing their impatience.
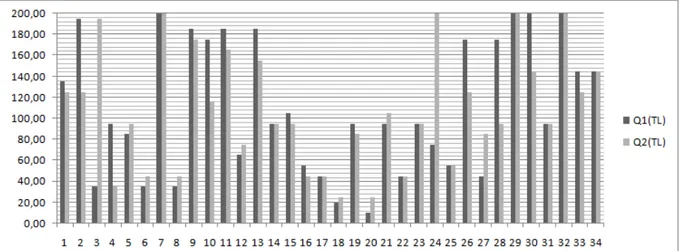
13 The following chart shows the individuals’ answers to the first two questions. Our aim is to illustrate the indifference points of our subjects.
Figure 1 presents the results for the first two questions and Figure 2 presents the results for the second two questions.
Figure 1-Survey answers of 1st and 2nd questions.
Figure 2- Survey answers of 3rd and 4th questions. 4. RESULTS
All results obtained from the formulation that is explained in the methodology section are shown on the histogram tables.
14 Figure 3-Constant Discounting Values for One-month
Constant discounting for 26 of 34 subjects is between 0 and 0.1, in other words 76 percent of the subjects’ discount factors are close to zero. On the other hand, 26 percent of the subjects’ discount factors are significantly different from zero.
The median value and mean value of constant discounting for one-month are significantly different from each other. Skewness3 value is 1.708, which means that this is a left skewed distribution. Moreover the kurtosis4 value is 4.264 which, being greater than three means that this is a leptokurtic distribution.
3Skewness measures the symmetry of the distribution (whether or not the mean is at the center of the
distribution). The skewness value of a normal distribution is 0. A negative value indicates a skew to the left (left tail is longer that the right tail) and a positive value indicates a skew to the right (right tail is longer than the left one)
4Measures the peakedness (or flatness) of a distribution. A normal distribution has a value of 3. A kurtosis >3
indicates a sharp peak with heavy tails closer to the mean (leptokurtic ). A kurtosis < 3 indicates the opposite a flat top (platykurtic).
0 4 8 12 16 20 24 28 0.0 0.1 0.2 0.3 0.4 0.5 0.6 0.7 0.8 0.9 1.0 1.1 Series: CD1 Sample 1 34 Observations 34 Mean 0.172722 Median 4.09e-24 Maximum 1.000000 Minimum 3.2e-188 Std. Dev. 0.346283 Skewness 1.708721 Kurtosis 4.264360 Jarque-Bera 18.80981 Probability 0.000082
15 Figure 4-Constant Discounting Values for Four-month
Constant discounting factors for four-month for 97 percent of the subjects are between 0 and 0.1, in other words 97 percent of the subjects’ discounting is extremely close to zero.
As can be seen from the histogram of the constant discounting for four-month, the mean and median values are significantly different from each other. Skewness value is 2.903, that means this is a left skewed distribution. Moreover, the kurtosis value is significantly more than three thus we can conclude that this is a leptokurtic distribution.
As can be seen from tables 1 and 2, the discounting calculated according to constant assumption is close to zero. When the statistical values of constant discounting for one-month and four-month are compared we observe that the mean of long term constant discounting is smaller than the mean of short term constant discounting, implying that the spread between long and the short term interest rates is positive. This is compatible with the conventional discounting we assume for the financial markets.
0 4 8 12 16 20 24 28 32 0.0 0.1 0.2 0.3 0.4 0.5 0.6 0.7 0.8 0.9 1.0 1.1 Series: CD4 Sample 1 34 Observations 34 Mean 0.088573 Median 7.00e-69 Maximum 1.000000 Minimum 0.000000 Std. Dev. 0.287799 Skewness 2.903320 Kurtosis 9.429606 Jarque-Bera 106.3306 Probability 0.000000
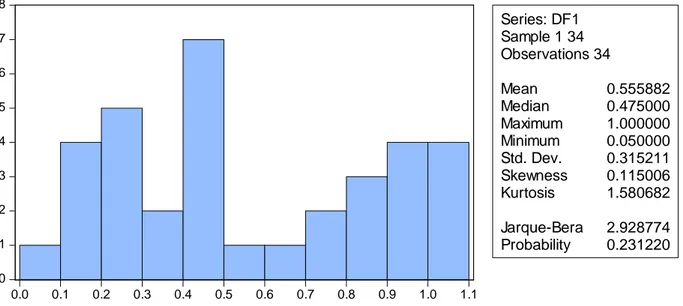
16 Figure 5-Hyperbolic Discounting For OneMonth
The hyperbolic discounting for each subject ranges between 0 and 1.1 and 21 percent of the subjects’ discounting values ranges between 0.4 and 0.5. The mean value of the one-month hyperbolic discounting is 0.555 for the subjects. Mean value of one-month hyperbolic discounting and median value of the hyperbolic discount for one-month are close to each other. Skewness value is 0.11 and kurtosis value is 1.58. According to these values, hyperbolic discounting for one-month may be assumed to have a normal distribution.
Figure 6-Hyperbolic Discounting for 4 Months
29 percent of the subjects’ discounting is between 0 and 0.1, and 41 percent of the subjects prefer higher discounting than 0.4 which is greater than mean. The mean value of the hyperbolic discounting for four-month is 0.360349. The mean and median values are not
0 1 2 3 4 5 6 7 8 0.0 0.1 0.2 0.3 0.4 0.5 0.6 0.7 0.8 0.9 1.0 1.1 Series: DF1 Sample 1 34 Observations 34 Mean 0.555882 Median 0.475000 Maximum 1.000000 Minimum 0.050000 Std. Dev. 0.315211 Skewness 0.115006 Kurtosis 1.580682 Jarque-Bera 2.928774 Probability 0.231220 0 2 4 6 8 10 12 0.0 0.1 0.2 0.3 0.4 0.5 0.6 0.7 0.8 0.9 1.0 1.1 Series: DF2 Sample 1 34 Observations 34 Mean 0.360349 Median 0.237500 Maximum 1.000000 Minimum 0.006250 Std. Dev. 0.311162 Skewness 0.740595 Kurtosis 2.370451 Jarque-Bera 3.669532 Probability 0.159651
17 significantly different from each other. Kurtosis is consistent with the kurtosis of the standard normal distribution; however, the skewness value shows that it is a left skewed distribution. When we compare each table, mean value of hyperbolic discounting for one-month is greater than hyperbolic discounting for four-month. According to these values it is safe to say that subjects tend to choose smaller discounting in the long term, which is an anticipated result for hyperbolic discounting.
It can be observed that there are some subjects that have a discounting value between 1 and 1.1 for each term of constant and hyperbolic discounting. These three subjects are the same subjects.
Tables below are introduced hyperbolic factors for one-month and four-month.
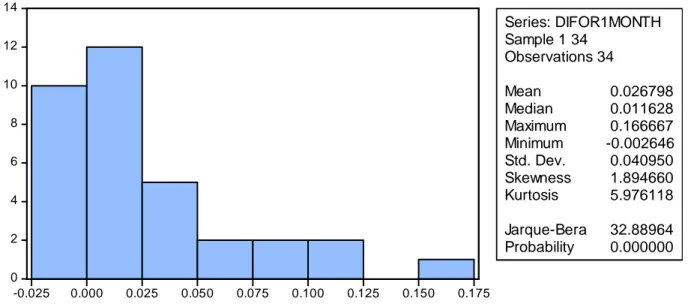
Figure 7-Decreasing Impatience for One-Month The decreasing impatience ranges between -0.002646 and 0.16667.
The mean and median of decreasing impatience for one-month are close to each other. Mean and median values of the distribution are not significantly different from each other. Skewness is greater than 0 and the Kurtosis is greater than 3. This means that the distribution is left skewed and leptokurtic.
Consider again two equivalent timed outcomes (s,µ)
∼
(t, χ) with s < t. Assume that (s + σ,µ)∼
(t + τ, χ). Decreasing (increasing) impatience implies that τ −σ > 0 (τ −σ < 0). An obvious measure of decreasing impatience is, therefore, τ –σ.(Rohde, 2010, s. 129) 0 2 4 6 8 10 12 14 -0.025 0.000 0.025 0.050 0.075 0.100 0.125 0.150 0.175 Series: DIFOR1MONTH Sample 1 34 Observations 34 Mean 0.026798 Median 0.011628 Maximum 0.166667 Minimum -0.002646 Std. Dev. 0.040950 Skewness 1.894660 Kurtosis 5.976118 Jarque-Bera 32.88964 Probability 0.000000
18
Consider an indifference pair with corresponding s, t, σ, τ. We saw before that τ − σ can be viewed as a measure of decreasing impatience. From impatience we know that s − t < τ −σ < τ. For increasing impatience we have τ −σ < 0, and therefore also tσ>sτ.(Rohde, 2010, s. 130)
Thus, according to Rohde, for 29 percent of the subjects we can talk about the presence of increasing impatience.
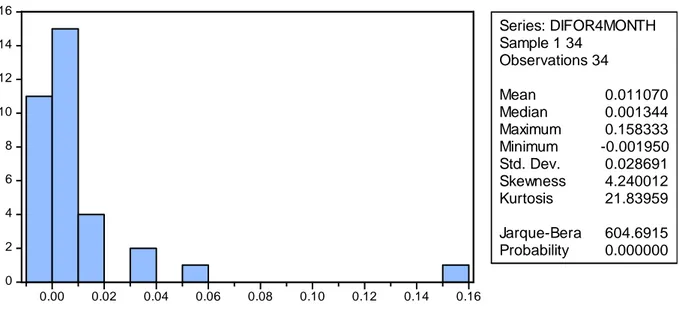
The figure below shows decreasing impatience for four-month:
Figure 8- Decreasing Impatience for Four-Month
Decreasing impatience for four-month ranges between -0.001950 and 0.158. There is not a significant difference between mean and median values of the distribution. When we check the skewness value it is left skewed. There is an extremely high kurtosis value implying that the distribution is much steeper than a standard normal distribution. Hyperbolic factor of 76 percent of the subjects is very close to zero thus it is hard to say that for four-month subjects are decreasingly or increasingly impatient.
Let us to compare the hyperbolic factor for one-month (H1) and four-month (H4).
0 2 4 6 8 10 12 14 16 0.00 0.02 0.04 0.06 0.08 0.10 0.12 0.14 0.16 Series: DIFOR4MONTH Sample 1 34 Observations 34 Mean 0.011070 Median 0.001344 Maximum 0.158333 Minimum -0.001950 Std. Dev. 0.028691 Skewness 4.240012 Kurtosis 21.83959 Jarque-Bera 604.6915 Probability 0.000000
19 Table 1-Hyperbolic factor for one-month and four-month
H1 H4 Mean 0.026798 0.011070 Median 0.011628 0.001344 Maximum 0.166667 0.158333 Minimum -0.002646 -0.001950 Std. Dev. 0.040950 0.028691 Skewness 1.894660 4.240012 Kurtosis 5.976118 21.83959 Jarque-Bera 32.88964 604.6915 Probability 0.000000 0.000000 Sum Sq. Dev. 0.055339 0.027164 Observations 34 34
Mean value of the hyperbolic factor decreased in a longer term. Maximum value has not decreased significantly and minimum value has not increased significantly. The hyperbolic factor for long term is more left skewed and significantly steeper than the short term hyperbolic factor. Although we can conjecture an increased impatience for 29 percent of the subjects observing one-month hyperbolic factor, we cannot state anything for four-month hyperbolic factor for the reason that decreasing impatience values are considerably close to zero.
20 Figure 9-Deviations from Constant Discounting
H1 displays decreasing impatience of one-month and H4 displays decreasing impatience of four-month. Constant discounting assumed that hyperbolic factor is equal to zero. Koopmans stated that:
We now go a step further and require that the preference ordering be the same as the ordering of corresponding programs obtained by advancing the timing of each future consumption vector by one period (and, of course, forgetting about the common first-period vector originally stipulated). This expresses the idea that the passage of time does not have an effect on preferences. (Koopmans, 1960, s. 293,294)
However the violations from constant discounting can be observed from the graph above and as it can be seen below we tested each hyperbolic factor whether mean values are equal to zero or not
21 Hypothesis Testing for Hyperbolic Factor for one-month
Date: 02/24/14 Time: 12:14 Sample: 1 34
Included observations: 34
Test of Hypothesis: Mean = 0.000000
Sample Mean = 0.026798 Sample Std. Dev. = 0.040950
Method Value Probability
t-statistic 3.815.770 0.0006
Table 2-Testing for Hyperbolic Factor for one-month H0 = µ1 = 0.0000
H1 = µ1 ≠ 0.0000
Since this is a two tails test we should compare 0.00 and 0.05. Since 0.00 < 0.05 we reject null hypothesis. That means mean value of hyperbolic factor for one-month is not equal to zero.
Hypothesis Testing for Hyperbolic Factor for four-month Date: 02/24/14 Time: 12:14
Sample: 1 34
Included observations: 34
Test of Hypothesis: Mean = 0.000000
Sample Mean = 0.011070 Sample Std. Dev. = 0.028691
Method Value Probability
t-statistic 2.249.832 0.0312
Table 3-Testing for Hyperbolic Factor for four-month H0 = µ4 = 0.0000
H1 = µ4 ≠ 0.0000
Since this is a two tails test we should compare 0.03 and 0.05. Since 0.03 < 0.05 we reject null hypothesis. That means mean of hyperbolic factor for four-month is not equal to zero.
22 According to mean tests above we can say that hyperbolic factor - in other words decreasing impatience - is significantly different from zero. As can be observed from figure 9 decreasing impatience values range between -0.0026 to 0.167.
23 5. CONCLUSION
In this study the hyperbolic factor, hyperbolic discounting and constant discounting for different terms are presented according to time points that were obtained from the survey. Subjects of the survey were entrepreneurs who live in Diyarbakir.
Hyperbolic factor, hyperbolic discounting and constant discounting were calculated through the theoretical article of Rohde (2010). Comparing hyperbolic discounting for different terms shows that subjects have smaller discounting for long term than short term which is compatible with the conventional discounting we assume for the financial markets. Subjects’ behavior shows more patience in the long term than the short term which is compatible with the hyperbolic discounting. The outcomes of the experiment illustrate that there are distinctive violations from constant discounting despite its widespread use in macro economic theory.
24 APPENDIX
TERCİH BELİRLEME ANKET KİTAPÇIĞI
AÇIKLAMA:
Bu bir akademik çalışmanın parçasıdır. Kişisel bilgileriniz alınmayacak ve dolayısıyla da kimse ile paylaşılmayacaktır. Elde edilen veriler kişisel bilgi içermeden sadece akademik çalışma için kullanılacaktır. İstediğiniz takdirde akademik çalışma sonuçları şahsınıza iletilecektir.
Aşağıda size sorulan sorular yalnızca zaman tercihlerinizi ölçmek için sorulacak ve başka hiçbir amaç için kullanılmayacaktır. Soruların doğru veya yanlış olarak değerlendirilmeyeceğini bilerek sadece bireysel tercihlerinizi göz önünde bulundurmanız, araştırma sonuçlarımızın sağlıklı olması açısından, bizim için önemlidir.
Ankete katılım karşılığında size 10 TL takdim edilecektir. Bunun yanında anket yapılan kırkbir (40) kişi arasından beş (5) kişi rastgele seçilecek ve cevapları doğrultusunda kendisine ödeme yapılacaktır. Ödemeler cevabınız doğrultusunda tespit edilmiş vadede elden verilecektir.
25 TERCİH SORULARI:
Lütfen aşağıdaki zaman ve para miktarı ikililerinden hangisini tercih ettiğinizi belirtiniz. Tercih ettiğiniz ikilinin yanındaki kutuyu işaretleyin.
Aşağıdaki her bir satırda verilmiş ikili seçeneklerin hangisini tercih ediyorsanız önündeki kutuyu işaretleyin.
ÖRNEK:
a ay, b TL X c ay, d TL X e ay, f TL c ay, d TL
ÖRNEĞİN AÇIKLAMASI:
Şeklinde işaretlenmişse bu birey ilk ikili seçenekte “c” ay sonra “d” TL almayı “a” ay sonra
“b” TL almaya tercih ederken, ikinci ikili seçenekte “e” ay sonra “f” TL almayı “c” ay sonra “d” TL almaya tercih etmiştir.
26 SORU 1: 1 gün, 20 TL 1 ay, 200 TL 1 gün, 30 TL 1 ay, 200 TL 1 gün, 40 TL 1 ay, 200 TL 1 gün, 50 TL 1 ay, 200 TL 1 gün, 60 TL 1 ay, 200 TL 1 gün, 70 TL 1 ay, 200 TL 1 gün, 80 TL 1 ay, 200 TL 1 gün, 90 TL 1 ay, 200 TL 1 gün, 100 TL 1 ay, 200 TL 1 gün, 110 TL 1 ay, 200 TL 1 gün, 120 TL 1 ay, 200 TL 1 gün, 130 TL 1 ay, 200 TL 1 gün, 140 TL 1 ay, 200 TL 1 gün, 150 TL 1 ay, 200 TL 1 gün, 160 TL 1 ay, 200 TL 1 gün, 170 TL 1 ay, 200 TL 1 gün, 180 TL 1 ay, 200 TL 1 gün, 190 TL 1 ay, 200 TL
27 SORU 2: 1 ay, 20 TL 4 ay, 200 TL 1 ay, 30 TL 4 ay, 200 TL 1 ay, 40 TL 4 ay, 200 TL 1 ay, 50 TL 4 ay, 200 TL 1 ay, 60 TL 4 ay, 200 TL 1 ay, 70 TL 4 ay, 200 TL 1 ay, 80 TL 4 ay, 200 TL 1 ay, 90 TL 4 ay, 200 TL 1 ay, 100 TL 4 ay, 200 TL 1 ay, 110 TL 4 ay, 200 TL 1 ay, 120 TL 4 ay, 200 TL 1 ay, 130 TL 4 ay, 200 TL 1 ay, 140 TL 4 ay, 200 TL 1 ay, 150 TL 4 ay, 200 TL 1 ay, 160 TL 4 ay, 200 TL 1 ay, 170 TL 4 ay, 200 TL 1 ay, 180 TL 4 ay, 200 TL 1 ay, 190 TL 4 ay, 200 TL
28 Soru 2’ye verdiğiniz cevaba göre aşağıdaki zaman ve para miktarı ikilileri arasında
tekrar tercih yapmanız istenecektir. Lütfen bir önceki soruda olduğu gibi verilen ikililerden hangisini tercih ettiğinizi belirtiniz. Tercih ettiğiniz ikilinin yanındaki kutuyu
işaretleyin. SORU 3: 2 ay, ___ TL 10 ay, 200 TL 2.5 ay, ___ TL 10 ay, 200 TL 3 ay, ___ TL 10 ay, 200 TL 3.5 ay, ___ TL 10 ay, 200 TL 4 ay, ___ TL 10 ay, 200 TL 4.5 ay, ___ TL 10 ay, 200 TL 5 ay, ___ TL 10 ay, 200 TL 5.5 ay, ___ TL 10 ay, 200 TL 6 ay, ___ TL 10 ay, 200 TL 6.5 ay, ___ TL 10 ay, 200 TL 7 ay, ___ TL 10 ay, 200 TL 7.5 ay, ___ TL 10 ay, 200 TL 8 ay, ___ TL 10 ay, 200 TL 8.5 ay, ___ TL 10 ay, 200 TL 9 ay, ___ TL 10 ay, 200 TL 9.5 ay, ___ TL 10 ay, 200 TL
29 SORU 4: 2 ay, ___ TL 16 ay, 200 TL 2.5 ay, ___ TL 16 ay, 200 TL 3 ay, ___ TL 16 ay, 200 TL 3.5 ay, ___ TL 16 ay, 200 TL 4 ay, ___ TL 16 ay, 200 TL 4.5 ay, ___ TL 16 ay, 200 TL 5 ay, ___ TL 16 ay, 200 TL 5.5 ay, ___ TL 16 ay, 200 TL 6 ay, ___ TL 16 ay, 200 TL 6.5 ay, ___ TL 16 ay, 200 TL 7 ay, ___ TL 16 ay, 200 TL 7.5 ay, ___ TL 16 ay, 200 TL 8 ay, ___ TL 16 ay, 200 TL 8.5 ay, ___ TL 16 ay, 200 TL 9 ay, ___ TL 16 ay, 200 TL 9.5 ay, ___ TL 16 ay, 200 TL 10 ay, ___ TL 16 ay, 200 TL 10.5 ay, ___ TL 16 ay, 200 TL 11 ay, ___ TL 16 ay, 200 TL 11.5 ay, ___ TL 16 ay, 200 TL 12 ay, ___ TL 16 ay, 200 TL 12.5 ay, ___ TL 16 ay, 200 TL 13 ay, ___ TL 16 ay, 200 TL 13.5 ay, ___ TL 16 ay, 200 TL 14 ay, ___ TL 16 ay, 200 TL 14.5 ay, ___ TL 16 ay, 200 TL 15 ay, ___ TL 16 ay, 200 TL 15.5 ay, ___ TL 16 ay, 200 TL
30
İSTATİKSEL BİLGİ SORULARI:
İsminiz veya kimliğiniz ile ilgili hiçbir bilgiyi dahil etmeden lütfen aşağıda bulunan,
istatistiksel analiz amaçlı şu soruları cevaplayın: Cinsiyetiniz :
Yaşınız :
Mesleğiniz :
Yıllık net gelir aralığı (Aşağıdaki seçeneklerden size uygun olanı seçin)
0 - 20.000 TL 60.001 - 80.000 TL
20.001 - 40.000 TL 80.001 - 100.000 TL
40.001 – 60.000 TL 100.000 üstü
Anketimiz burada sona ermiştir. Lütfen anket kitapçığını zarfa koyup kapattıktan sonra anketör araştırmacımıza teslim edin.
31 REFERENCES
Anadolu Agency. (2014 йил 12-January). Anadolu Agency. From World's 2nd largest city walls in Diyarbakir, candidate for UNESCO: http://www.aa.com.tr/en/rss/273500--worlds-second-largest-city-walls-in-diyarbakir-candidate-for-unesco
Andrews, P. A. (1992). Türkiye'de Etnik Gruplar. İstanbul: Ant. Bournoutian, G. A. (2006). Ermeni Tarihi. Istanbul: Aras Yayınları.
Chabris, C., Liapson, D., Moris, C., Schuldt, J., & Taubinsky, D. (2008). Individual Laboratory - Measured Discount Rates Predict Field Behaviour. Journal of Rİsk and
Uncertainity , 37, 237-269.
Deniz, H. (2010). Diyarbakır İli Sanayi Raporu. Diyarbakir: Karacadağ Kalkınma Ajansı. Diyarbekir. (2013). İLK ÇAĞLARDAN OSMANLI DEVLETİNİN SONUNA KADAR
DİYARBAKIRIN KISA TARİHİ. From Diyarbekir:
http://www.diyarbekir.com/diyarbekir/Tarihce/tarih.asp
Diyarbekir. (2013). İlk Çağlardan Osmanlı Devletinin Sonuna Kadar Diyarbakırın Kısa
Tarihi. Retrieved 2013 йил 21-12 from Diyarbekir:
http://www.diyarbekir.com/diyarbekir/Tarihce/tarih.asp
Eliçalışkan, M. (2011). Diyarbakır. From Cografya.gen.tr:
http://www.cografya.gen.tr/tr/diyarbakir/tarihce.html
Koopmans, T. C. (1960). STATIONARY ORDINAL UTILITY AND IMPATIENCE.
Econometrica Vol. 28, No. 2 , 287-309.
Laibson, D. I. (1996 йил June). HYPERBOLIC DISCOUNT
FUNCTIONS,UNDERSAVING, AND SAVINGS POLICY. NBER WORKING PAPER
SERIES .
Loewenstein, G., Read, D., & Baumister, R. (2003). ECONOMIC AND PSYCOLOGICAL
PERSPECTIVES N INTERTEMPORAL CHOICE. NewYork: Russel Sage Foundation.
Lowenstein, G., Read, D., & Baumister, R. (2003). ECONOMIC AND PSYCOLOGICAL
PERSPECTIVES N INTERTEMPORAL CHOICE. NewYork: Russel Sage Foundation.
Ministary of Culture and Tourism. (2013). Diyarbakır, Genel Bilgiler . From Ministary of Culture and Tourism: http://diyarbakir.turizm.gov.tr/TR,56880/genel-bilgiler.html
32 Rohde, K. I. (2010). The hyperbolic factor: A measure of time inconsistency. J Risk
Uncertain 41 , 125–140.
Rubinstein, A. (2003). Economics and Psychology"? The Case of Hyperbolic Discounting.
International Economic Review, Vol. 44, No. 4 , 1207-1216.
Thaler, R. (1981). Some Emprical Evidence of Dynamic Inconsistency. Economic Leters 8 , 201-207.
Thaller, R. (1981). Some Emprical Evidence of Dynamic Inconsistency. Economic Leters 8 , 201-207.
Torres. (2013). Descriptive statistics. Retrieved 12 07, 2013, from Data & Statistical Services: http://www.princeton.edu/~otorres/Stata/DataPrep101Distribution.pdf
Turkish Statistical Institute. (2012). Address Based Population Registration System Results. Retrieved from Turkish Statistical Institute: www.tuik.gov.tr/IcerikGetir.do?istab_id=139 Turkish Statistical Institute. (2013). Turkish Statistical Institutute. From Main Labour Force Indicators by Province, 2012: http://tuik.gov.tr/PreIstatistikTablo.do?istab_id=2087
Turkish Statistical Institutute. (tarih yok). Seçilmiş Göstergelerle Diyarbakır 2012. http://www.tuik.gov.tr/ilGostergeleri/iller/DIYARBAKIR.pdf adresinden alınmıştır
Yılmazçelik, İ. (2000). Osmanlı Hakimiyeti Süresince Diyarbakır Eyaleti Valileri. Fırat