9
ASSESSING IMPACT OF GOVERNMENT POLICIES ON THE
COMPETITIVENESS OF TURKISH CORN PRODUCTION
1Ege University, Faculty of Agriculture, Department of Agricultural Economics, 35100 Bornova, İzmir, Turkey, Email:
Mehmet Necat Ören
Cukurova University, Faculty of Agriculture, Department of Agricultural Economics, Turkey
Betül Gürer
Ömer Halisdemir University, Faculty of Agricultural Sciences and Technologies, Turkey
Canan Abay
Ege University, Faculty of Agriculture, Department of Agricultural Economics, Turkey
Berna Türkekul
berna.turkekul@ege.edu.tr
Burhan. Özalp
Cukurova University Faculty of Agriculture, Department of Agricultural Economics, Turkey
Abstract
With this study, it is aimed to determine the competitiveness of corn production in terms of profitability and to measure the effects of agricultural policies in Turkey on regional basis. Aegean, Mediterranean and Southeastern Anatolia Regions are selected as a field of research area because the agricultural enterprises in these regions have experienced due to intensive corn production. Firstly, agricultural policies applied for corn production in Turkey is examined. Policy transfers, resource utilization, costs, private and social profits resulting from these applications are also presented with Policy Analysis Matrix (PAM). This method is widely used in the world in the analysis of the impact of policies on production economics and it is a very effective method. PAM is mainly based on benefit-cost analysis. PAM also may be used to generate scenarios for comparison of alternative policies. Besides the secondary data analysis of the effects of policy, the data obtained through face to face interviews with 256 producers selected through stratified sampling method in Aegean, Mediterranean and Southeastern Anatolia Regions. The results show that corn production in Turkey has a comparatively disadvantage stemming mainly from input costs and output prices higher than in the world. The corn productivity is high but high prices of inputs negatively affect Turkish corn producers. Under the existing policy circumstances, the producers earn profit. Farmers would start earning much higher revenues if the tax on fuel will be lowered which in turn decrease production costs. As a result sector’s competitiveness and comparative advantage is also significantly improved. Keywords: Agricultural Policies, Policy Analysis Matrix, Competitiveness, Social Profits, Corn. Introduction
The agricultural sector remains one of the most essential economic sectors in Turkish economy due to its contribution to employment, income, trade and nutrition. In response to this importance, agriculture was supported by prices and government purchases until 2000s. Agricultural restructuring in the 2000s, within the framework of regulations by internal organizations, eliminated price supports, government purchases. With gradual elimination of government support for traditional crops (sugar beet, wheat and tobacco), the production of these crops declined in the 2000s. Mutually, corn
1
10 cultivation expanded in this period as an alternative to traditional crops. As results of these developments corn production nearly doubled and reached to 6.4 millions tons. Despite that, domestic production is sometimes insufficient to meet the high and increasing domestic demand for corn. Although prices of corn are higher than the average world prices in Turkey, corn growers in Turkey are still not earning enough to recover the total costs of production. Despite the government support, corn production efficiency stayed low. High input costs leave Turkish farmers with low profits and corn production not sustainable without price supports and input subsidies.
There is a lack of research on assessment of the impact of policy instruments on corn production and profitability in Turkey. However there are some studies devoted to a specific crop policy evaluation in terms of distortion effects, production efficiency and welfare gains. Kızılaslan (2004) addresses issues related to the erratic wheat support policy and its impact on the growth and competitiveness of the agricultural sector. Results also indicates that several reforms of the agricultural policy need to take place in order to bring Turkish agriculture closer to that of EU, and therefore make it more competitive once it enters the EU’s free agricultural market. Taşdan (2005) emphasized that corn prices were higher than world prices due to high input prices, low yields and custom taxes. He also noted that increasing marketing efficiency is the main driver of solving current marketing problems because agricultural policy changes (Sugar Law, premium payment, alternative product project and end of support purchases) effects domestic corn market. Aktaş and Yurdakul (2005) used Translog Cost Function to analyze regional input demand and a supply model to analyze short run effects of Bt corn seed use in Çukurova region. Results indicate that input demands were inelastic with respect to prices. However, machinery rent costs, pesticide and fertilizer were found more elastic than the other inputs. Alemdar et all (2014) estimated production costs of wheat, first and second crop corn, cotton and sunflower, which are economically important field crops in Çukurova region. Results showed that farmers still not earning enough to recover the total costs of production. They suggested that lowering input costs in order to decrease the burden of farmers together with improvements in productivity could yield fruitful results for the agricultural sector in the future.
Given this background, in this study policy effects as well as competitiveness and comparative advantage of the production sector is analyzed using the analytical Policy Analysis Matrix (PAM) framework. Revenues and costs at private and social prices are evaluated in order to determine the divergence or distortion effects of the current Turkish agricultural support policy. For this purpose, domestic and trade policy for corn is analyzed using PAM. PAM is an analytical framework for agricultural policy assessment initially developed by Monke and Pearson in 1989 (Monke and Pearson, 1989). Approach is based on the cost-benefit analysis, and is mostly used for empirical analysis of agricultural price policy, assessment of policy effects on farmers income, technological advancement etc. It was used by numerous researchers to determine the effects of agricultural policy on the sector competitiveness, its economic efficiency, level of distortions, comparative advantage etc. PAM has been used to measure specific and social profitability, social efficiency and policy transfers for various agricultural systems under various technological and institutional scenarios (Nelson and Panggabean, 1991), (Yao, 1997a), (Winter-Nelson, 1997), (Kydd et al., 1997), (Fang and Benghin, 2000), (Pearson et al., 2003), (Najafi, 2005), (Padilla Bernal et al., 2012), (Adeoye and Oni, 2014). In addition, many studies have been conducted PAM to measure competitiveness of various products (Kirsten et al., 1998, Quddus and Mustafa, 2011, Yao, 1997b, Hai and Heidhues, 2004, Winter-Nelson and Aggrey-Fynn, 2008, Basavaraj et al., 2008, Touré et al., 2013, Reig-Martínez et al., 2013). In relation to agricultural policy in Turkey, several studies (Akbay, 2003; Bahadır 2006, Güney, 2012; Macic, 2015) were made on PAM analysis. The paper is organized as follows. Section 2 presents the analytical frameworks, the study area and the data. Section 3 presents the results. Section 4 provides conclusions and draws policy implications.
Methodology
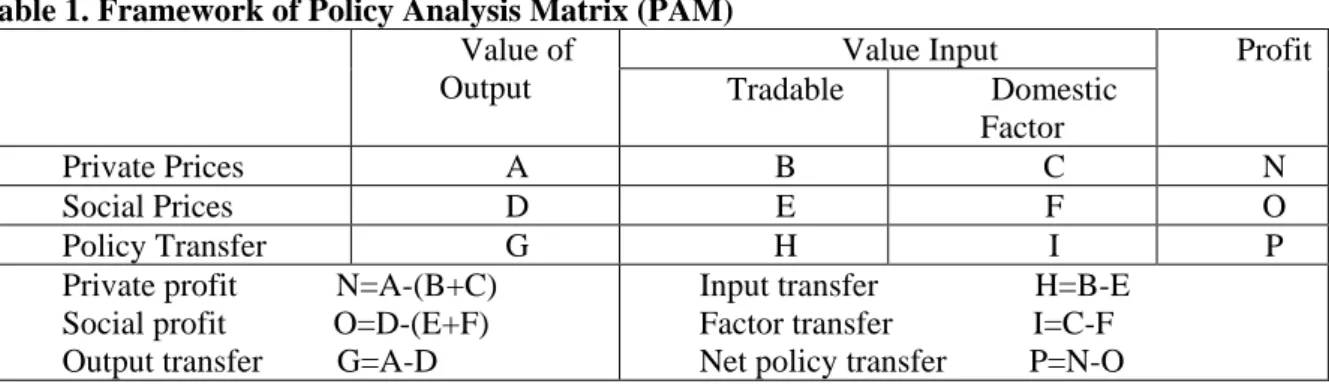
PAM is an analytical framework developed by Monke and Pearson (1989) for policy assessment based on the cost-benefit analysis. This method offers both microeconomic level of analysis of the on-farm activities, as well as the macro-level of policy transfers and efficiency analysis, and therefore provides a useful insight in the trade-offs that need to be faced by the policy makers. Matrix consists
11 of three rows and four columns and includes data on production, costs, revenues and profits rated at private and social prices (Table 1).
Table 1. Framework of Policy Analysis Matrix (PAM) Value of
Output
Value Input Profit
Tradable Domestic Factor
Private Prices A B C N
Social Prices D E F O
Policy Transfer G H I P
Private profit N=A-(B+C) Social profit O=D-(E+F) Output transfer G=A-D
Input transfer H=B-E Factor transfer I=C-F Net policy transfer P=N-O
Matrix is a product of two accounting identities:
1. Profitability is measured horizontally as the difference between revenues and costs.
2. Effects of divergences (distorting policies and market failures) as the difference between observed parameters and parameters that would exist if the divergences were removed.
By filling in the elements of the PAM for an agricultural system, an analyst can measure both the extent of transfers occasioned by the set of policies acting on the system and the inherent economic efficiency of the system (Monke and Pearson, 1989).
Revenue in the PAM model denotes sales income per unit agricultural product. Cost represents production and intermediate input costs of production activities per unit agricultural production, including tradable inputs and domestic factors. Tradable inputs are material production costs that can be imported or exported, while the domestic factors represent resources that cannot be internationally traded but can only be supplied in domestic markets (e.g., land). The private price is the price directly observed in the market and is sensitive to the distortive impacts of agricultural policies. The social price is the prevailing price without government intervention and reflects the effective allocation of resources by the market. Private profit is D = A – B – C, as shown in Table 1. If D > 0, then producers earn profits and the product is competitive in the market. Social profit is H = E – F – G. If H > 0, the production activity exhibits comparative advantage in the international market. Generally, the social revenue and social tradable inputs are represented by international prices, including the cost, insurance, and freight (CIF) import prices and the free on board (FOB) export prices. The social domestic factors can only be estimated by observing input prices in rural factor markets, computed according to an opportunity cost.
The divergence of revenues is I = A – E. If I > 0, the government is subsidizing the sector’s productivity; therefore, social resources are measured as flows into this sector. If I < 0, the government is imposing a tax on the sector and resources are therefore flowing out of the sector. The divergence of tradable inputs is input transfer and is measured as J = B – F. If divergence is positive, it means that the government is subsidizing this production activity, making production factor domestic market prices lower than international prices. The divergence of domestic factors is K = C – G. This divergence explains the demand/supply balance of resources in domestic markets, and also the impact of government price policies on domestic markets. Thus, it measures the influence of market failure and government intervention in the sector. The divergence of profit is a net transfer and is measured as L = D – H. Indicators are also used to analyze agricultural products’ comparative advantages and degree of protection.
Data and Modeling Assumptions
In this study, a PAM is compiled for corn at national level for the year 2014. The primary data were collected from a comprehensive survey through face to face interviews with 256 producers selected through stratified sampling method in the 3 regions (Mediterranean Region, Southeast Anatolia and Aegean Region which provide 69% of corn production) and 4 provinces with high
12 productions. This survey was carried out by the authors from March to June in 2015. The selected four provinces have 69.4% share in corn production in Turkey.
Once the inputs are disaggregated into tradable and non-tradable components, PAMs are constructed for corn. The most difficult tasks for constructing a PAM are estimating social prices for output and inputs, and decomposing inputs into their tradable and non-tradable components (Yao, 1997a). For computing social prices for various commodities including both outputs and inputs, world prices are used as the reference prices in the study. The OECD calculates “reference (social) prices” and it is available from 1988 by major products. For this reason, corn reference price was taken from OECD database. CIF/FOB prices are obtained from TURKSTAT for calculating input shadow prices for fertilizers, pesticides and seed. These prices are converted to domestic currencies using reel exchange rates. For imported commodities, social prices at the farm gate are calculated by adding transportation and storage costs to the respective CIF prices in domestic currency to compare with farm gate prices. Similarly, for exported commodities, social prices at the farm gate are calculated by subtracting transportation and storage costs from the respective world reference price, converted to domestic currency.
In Turkey, agricultural labor, machinery, land, irrigation cost and interest on operating capital are generally considered as non-traded intermediate inputs and domestic resources because these components do not usually enter into the international market. The costs of these inputs were collected from field survey. For social valuation of these costs and prices of non-tradable inputs, the specific methods were used. Following Kazal et all (2013), social valuation of land is calculated as the average rental value of per unit of land. Machinery cost was calculated on the basis of opportunity cost of the use of machinery per hectare for the cropping period. Reel interest rate was used for calculating of social value of working capital. Market value for irrigation is considered for shadow pricing because no substantial market imperfection exists in this market.
The shadow wage rate (SWR) can be estimated for each category of labor by multiplying the market wage by the appropriate conversion factor (Gittinger, 1982). The estimated set of conversion factors (CF) can be used either in a world price system or in a domestic price system (Emam, Salih, 2011). CF is defined as the ratio of shadow price (SPi) to a domestic market price (MPi) (Jayanthakumaran, 2003).
𝑪𝑪𝑪𝑪𝑪𝑪 =𝑴𝑴𝑺𝑺𝑪𝑪𝑺𝑺𝑺𝑺𝑪𝑪 (1)
Warr (1989), Chen (1993) and Jansen (1986) have also used estimated conversion factor based on domestic price system for constructing social budget of labour in Indonesia (0.72) , South Korea (0.91), Malaysia (0.83), the Philippines (0.64), Sri Lanka (0.79) and Sudan (0.60). For constructing social budget of labor in this study, conversation factor was calculated as 0.82.
Overview of Corn Production and Trade
Corn is the most important cereal crop in the world after wheat and rice. Corn has multiple uses. In most developing countries corn is grown as a food crop (grain corn); in other countries (USA, Brazil) it is an important animal feed or is a basic compound for ethanol production.
The global world production of corn exceeds 1 billion tons in 2016. The USA is by far the biggest producer (over 380 million tons in 2016; 37,2% of the world production), occupying double the area of any other crop planted in the country. It should however be noted that a major part of this is used for fodder and production. In the world ranking the USA is followed by China (219 million tons), Brazil (86 million tons), the EU (60 million tons) and Argentina (36 million tons) (USDA, 2017). The corresponding area planted has over the past 40 years increased by more than 40%. Both the global production and the area harvested show a steady increase since the 1960s.
13 Source, USDA, 2017.
Figure 1. Leading Corn Producer Countries (2016)
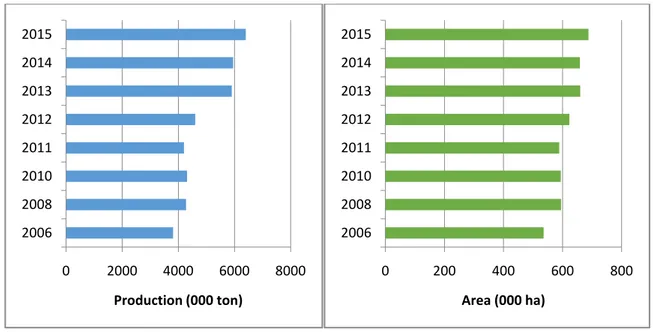
Corn currently ranks third among cereals, after wheat and barley, in terms of area and production in Turkey. It is seen that the values of planting area and production have increased during 2006-2015 period.While corn cultivation area increased by 28% reaching 688 thousand hectares, production increased by 67.9% to 6.4 million tons during the same period (BUGEM, 2017).
Source: BUGEM, 2017
Figure 2. Corn Production and Area in Turkey Corn Policy in Turkey
Like in all developed and developing countries, agricultural production is supported in Turkey in order to increase production quality and productivity, ensure diversity in agricultural production, protect producers and consumers, ensure food safety and sustainable development, or support agricultural production markets. Various policy instruments are used to achieve these objectives, albeit varying according to the countries.
The Turkish corn policy started with the appointment of the TMO in 1941 to purchase support. The "National Research and Education Project", which was started to be implemented in 1974, is one of the important works in this area. Another important project is the "Second Product Research and Publication Project" which started to work in the late 1970s and started to be implemented in 1982.
0 50.000 100.000 150.000 200.000 250.000 300.000 350.000 400.000 450.000 Ethiopia Nigeria Indonesia Canada India Ukraine EU Rest USA 0 2000 4000 6000 8000 2006 2008 2010 2011 2012 2013 2014 2015 Production (000 ton) 0 200 400 600 800 2006 2008 2010 2011 2012 2013 2014 2015 Area (000 ha)
14 During the 1986-2001 period, government purchases were the most important policy tool affecting cereal crop markets, corn was affected by this policy like other products, and the market showed improvement over these purchases. From the beginning of the 2000's onwards, Turkey's corn policy has undergone significant changes. Projects and regulations such as ending support purchases, the Sugar Law, the Alternative Product Project and the foreign trade measures that were effectively used in each period were influential in this period. A deficiency payment, which started in 2005 and will be given according to corn production, is the most important policy application in this period.
Results and Discussion
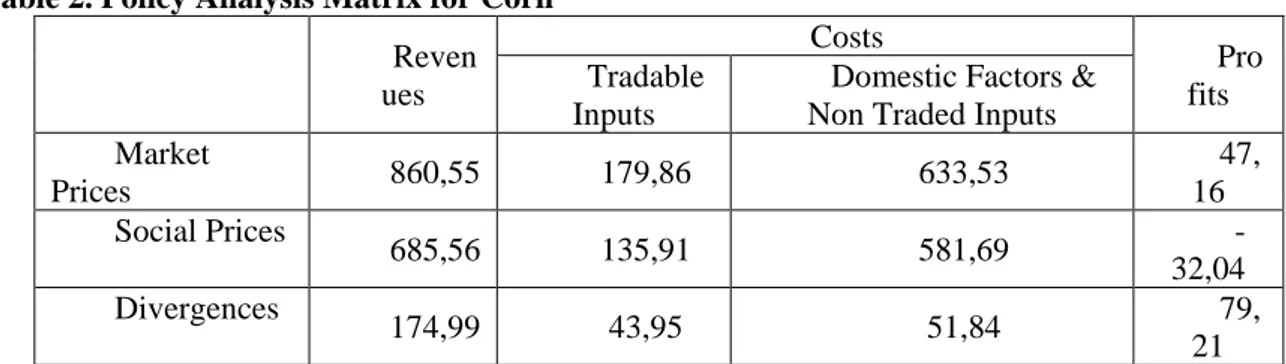
The Turkish corn farms’ budgets in private and social prices are computed. The Policy Analysis Matrix (PAM) is computed and presented in Table 2. In general, private prices of corn at the farm-gate are not close to the social prices. Output transfers clearly indicate the distorting domestic policy; revenues at social prices are lower than the revenues at private prices indicating the strong domestic price supports through deficiency payments, input subsidies. For tradable inputs, producers paid a private price that is higher than the social price of inputs during the study period. Positive values of divergences for tradable inputs indicate the amount by which specific input was taxed, or by what extent did the levy or import tariff increased the average domestic price for these inputs. The domestic factor transfer (difference between private and social price of non-tradable inputs) is positive showing that opportunity costs of non-tradable inputs are lower than their market prices. Finally the net profit/net policy transfer (difference between private and social profit) is positive which means that under the existing policy circumstances, the producers earn profit.
Table 2. Policy Analysis Matrix for Corn Reven ues Costs Pro fits Tradable Inputs
Domestic Factors & Non Traded Inputs Market Prices 860,55 179,86 633,53 47, 16 Social Prices 685,56 135,91 581,69 -32,04 Divergences 174,99 43,95 51,84 79, 21
The DRC and protection coefficients are derived from the PAM table and are presented in Table 3. Again, when the NPCO> 1 means that corn producers receive an implicit subsidy since its market output price is greater than its social price. Corn producers in Turkey receive an implicit subsidy on their output price. The coefficient NPCI> 1 means that producers receive a tax on their tradable inputs. Turkish corn producers are paying higher prices for fertilizers and pesticides which are the mainly imported. If the coefficient EPC> 1, producers receive a net subsidy on their production. The results from Table 3 show that Turkish corn producers were mostly receiving subsidy of %24 on their production. Briefly, analysis of NPCO, NPCI and EPC showed that corn producers are not competitive (NPCO > 1 and EPC > 1). The inputs also were not subsidized by government policy (NPCI > 1). The PCR values were found to be less than one (but close to one) indicating that the commodity system is competitive at producer level. Low PCR (0.95) implies that corn is profitable for producers. An industry has a comparative advantage (disadvantage) when its DRC is smaller (greater) than one. The DRC value for corn was found to be greater than one (1.26), indicating that Turkey has comparative disadvantage in producing corn for import substitution.
Table 3. Competitiveness Indicators for Corn
Coefficients Value
PCR (Private Cost Ratio) 0,95
DRC (Domestic Resource Cost Ratio) 1,06
15
NPI (Nominal Protection Coefficient of Input) 1,32
EPC (Effective Protection Coefficient) 1,24
Conclusions and Policy Implications
Studies on policy evaluation with respect to specific crops have gained the importance in the world, in order to justify high public spending on the agricultural sector. However, studies evaluating current agricultural policy for corn and other cereals as major crop products in Turkey, especially after the latest reform in 2000 and reintroduction of input subsidies and price supports are few in number. Therefore this study aims was to assess competitiveness of corn production, financial profitability at the farm level in Turkey. Results revealed that corn production is not competitive, but profitable for producers with current deficiency payments, input subsidies.
Comparative disadvantage of corn production in Turkey stems mainly from input costs and output prices higher than in the world. Although corn productivity is high, high prices of inputs negatively affect Turkish corn producers. Turkish corn producers are paying higher prices for fertilizers and pesticides which are the mainly imported. Especially lowering the tax on fuel would decrease production costs, yield positive results, and farmers would start earning much higher revenues. As a result sector’s competitiveness and comparative advantage is also significantly improved.
Also, measures should be implemented to improve land available for corn production at the farm level and tenurial policies aimed at improving land rental market in order to allow landless and marginal farmers to acquire land, will significantly improve corn supply. Effective implementat ion of these policy measures will help corn production and competitiveness to increase.
Acknowledgment
This study is based on data obtained under No. 114O649 project supported by TUBITAK.
References
Adeoye, I.B., Oni, O.A., 2014. “Competitiveness and Effects of Policies on Plantain Production Systems in Southwestern Nigeria”, Agris on-line Papers in Economics and Informatics, VI(4), 3-13.
Akbay A.Ö., (2003), Evaluation of Social and Economic Profitability of Sugar Production in Turkey, Adana Provincial Planning and Coordination Directorate, Publication No. 104, ISBN 975-407-130-6, Ankara
Aktas, E., Yurdakul, O. 2005. Destekleme ve Teknoloji Politikalarının Çukurova Bölgesinde Mısır Tarımı Üzerine Etkisi. Çukurova Üniversitesi Ziraat Fakültesi Dergisi, Cilt 20(2), pp. 19-28. Alemdar T., Seçer A., Demirdoğen A. Öztornacı B. and Aykanat S., (2014), Çukurova Bölgesinde
Başlica Tarla Ürünlerinin Üretim Maliyetleri ve Pazarlama Yapilari, Tarımsal Ekonomi Ve Politika Geliştirme Enstitüsü Yayın No: 230.
Bahadır, B., 2006. Çukurova Bölgesinde ve Ulusal Bazda Pamuk Üretiminin Rekabet Edebilirliği: Politika Analiz Matrisi (PAM) Yaklaşımı. Adana: Basılmamış Yüksek Lisans Tezi, Çukurova Üniversitesi.
Basavaraj, G., Parthasarathy Rao, P., Achoth, L., Reddy, C.R., 2013. “Assessing Competitiveness of Sweet Sorghum for Ethanol Production: A Policy Analysis Matrix Approach”, Agricultural Economics Research Review, 26(1), 31-40.
BUGEM, 2017, İstatistikler http://www.tarim.gov.tr/BUGEM/TTSM.
Chen, J. (1993), “Social cost-benefit analysis of china’s Shenzhen special economic zone”, Development Policy Review 11(3):261-271.
Emam, A.A and Salih, M.H. (2011), “Measuring of competitiveness of Sudanese sheep export”, American Journal of Experimental Agriculture 1(3): 69-78, 2011
Fang, C., Beghin, J., 2000. Food Self-Sufficiency, Comparative Advantage, and Agricultural Trade:A Policy Analysis Matrix for Chinese Agriculture. Ames: Center for Agricultural and Rural Development Working Paper 99-WP 223.
16 Gittinger, J.P. (1982), “Economics analysis of agricultural projects”. EDI, World Bank, Washington,
D. C.
Hai, N.M., Heidhues, F., 2004. Comparative advantage of Vietnam’s rice sector under different liberalisation scenarios– A Policy Analysis Matrix (PAM) study, Discussion Paper No. 01/2004, University of Hohenheim.
Jansen, D. (1986), “The Economic and Financial Analysis of Sudan’s Major Crops 1984-1987”, World Bank Office, Khartoum, Sudan.
Jayanthakumaran, K. (2003), “Benefit- cost appraisals of export processing zones: a survey of the literature”. Development Policy Review 21(1), s:51-65. Blackwell Publishing, Oxford.
Kazal, M.M.H., Rahman, S., Alam, M.J and Hossain, S.T., (2013). “Financial and Economic Profitability of Selected Agricultural Crops in Bangladesh”, National Food Policy Capacity Strengthening Programme (NFPCSP).
Kirsten, J. F., Ohene-Anyang, E., van Rooyen, J., 1998. "An Analysis of The Comparative Advantageand Policy Incentives of Commercial Wheat Production in South Africa", Agrekon: Agricultural Economics Research, Policy and Practice in Southern Africa, 37(4), 528-540.
Kızılaslan H., (2004), Dünya’da ve Türkiye’de Buğday Üretimi ve Uygulanan Politikaların Karşılaştırılması, GOÜ. Ziraat Fakültesi Dergisi, 2004, 21 (2), 23-38.
Kydd, J., Pearce, R., Stockbridge, M., 1997. "The Economic Analysis of Commodity Systems: Extending the Policy Analysis Matrix to Account for Environmental Effects and Transaction Costs", Agricultural Systems, 55(2), 323-345.
Macic, S., 2015. Agrıcultural Polıcy In Turkey: Evaluatıon Of Wheat Support Polıcy Effıcıency Usıng Polıcy Analysıs Matrıx, MSc Thesis.
Monke, E. A., Pearson, S. R., 1989. The Policy Analysis Matrix for Agricultural Development. Ithaca: Cornell University.
Najafi, B., 2005. Effects of Government Policies on Wheat Production in Iran: The Application of Policy Matrix Analysis. Cairo: Economic Research Forum.
Nelson, G. C., Panggabean, M., 1991. "The Costs of Indonesian Sugar Policy: A Policy Analysis Matrix Approach", American Journal of Agricultural Economics, 73(3), 703-712.
Padilla Bernal, L. E., Lara-Herrera, A., Reyes-Rivas, E., Perez-Veyna, O., 2012. "Competitiveness, Efficiency and Environmental Impact of Protected Agriculture in Zacatecas, Mexico", International Food and Agribusiness Management Review, 15(4), 49-64.
Pearson, S., Gotsch, C., Bahri, S., 2003. Applications of the Policy Analysis Matrix in Indonesian Agriculture. Ithaca: Cornell University.
Quddus, M. A., Mustafa, U., 2011. "Comparative Advantage of Major Crops Production in Punjab: An Application of Policy Analysis Matrix", The Lahore Journal of Economics, 16(1), 63-94. Taşdan, K. 2005. Türkiye Mısır Piyasası, Ç.Ü. Fen Bilimleri Enstitüsü Tarım Ekonomis Anabilim
Dalı, Doktora Tezi, Adana.
Touré, A., Groenewald, J., Seck, P. A., Diagne, A., 2013. Analysing policy-induced effects on irrigated rice performance. Hammamet, 4th International Conference of the African Association of Agricultural Economists.
USDA, 2017. Grain World Markets and Trade, www.fas.usda.gov/report.asp.
Warr, P. (1989), “Export processing zone:the economics of enclave manufacturing” World Bank Research Observer 4(1):65-87.
Winter-Nelson, A., 1997. "Rural taxation in Ethiopia, 1981-1989: a policy analysis matrix assessment for net producers and net consumers", Food Policy, 22(5), 419-431.
Winter-Nelson, A., Aggrey-Fynn, E. 2008. Identifying Opportunities in Ghana’s Agriculture: Results from a Policy Analysis Matrix, Ghana Strategy Support Program (GSSP), GSSP Background Paper 12.
Yao, S., 1997a. "Comparative Advantages and Crop Diversification: A Policy Analysis Matrix for Thai Agriculture", Journal of Agricultural Economics, 48(2), 211-222.
Yao, S., 1997b. "Rice production in Thailand seen through a policy analysis matrix", Food Policy, 22(6), 547-560.