© 2020. This is an open access article distributed under the Creative Commons Attribution-NonCommercial-NoDerivatives 4.0 License. (http://creativecommons.org/licenses/by-nc-nd/4.0/)
Developing of buffer-precipitation method for lead
metaborate (Pb(BO
2)
2·H
2O) nanostructures
BERNABULBUL, SEDABEYAZ∗
Department of Chemistry, Faculty of Science & Literature, Balıkesir University, Balıkesir, Turkey
Amorphous lead metaborate (Pb(BO2)2·H2O) nanostructures were synthesized by a simpl and cost-effective synthesis
method which is based on precipitation of lead ions using boric acid/sodium hydroxide buffer (pH 9.2) in the presence of polyethylene glycol (PEG). Scanning electron microscopy images showed that the average particle size is 30±9 nm and the particle shape is mostly spherical. The chemical formulation of Pb(BO2)2·H2O was confirmed by infrared spectroscopy,
in-ductively coupled plasma and thermal gravimetric analysis (TGA). The percentage of PEG molecules on the particle surface equal to 2.5 % was determined by TGA. Optical reflectance measurement was performed by UV-Vis spectroscopy. Based on the Kubelka-Munk function, it was calculated that the Pb(BO2)2·H2O nanostructures have a direct band gap of 4.6 eV.
Keywords: lead metaborate; nanomaterials; chemical synthesis
1.
Introduction
Metal borates have attracted considerable atten-tion in the past decades because they show a great variety of physical properties ranging from non-linear optical (NLO) [1], ferroelectric [2] to semi-conducting behaviors [3]. These properties pro-vide diverse applications in opto-electronic tech-nologies such as laser frequency conversion [4], optical parameter oscillation [5] and signal com-munication [6]. Lead borates are of special inter-est in the search for borate materials, since these compounds have pronounced radiation shielding properties [7–9].
The Pb2+ ion shows stereochemically active lone pair electrons, which has a strong tendency to form lead oxo/hydroxo clusters [10, 11]. Dif-ferent cluster motifs, such as Pb2O2, Pb3(OH)4,
Pb4(OH)4, Pb4O and Pb6O2, are introduced into
borate backbones to construct a fascinating lead borate framework [12, 13]. Thus, it is possible to see in the literature that a wide variety of lead borate structures, such as PbB4O7 [14],
Pb6B10O21 [15], Pb2[B5O9](OH)·H2O [16]
and Pb5B3O8(OH)3·H2O [17] are formed
∗E-mail: [email protected]
in various experimental conditions (temperature, pressure, pH, etc.). Among lead borate structures, the most commercial one is Pb(BO2)2·H2O.
More-over, it is used as a starting material for the prepa-ration of many lead borate compounds, such as Pb6B6O14(OH)2(H2O) [13], Pb6B4O11(OH)2[12],
Pb6B12O21(OH)6 [18]. Therefore, its synthesis
methods are often patented. For example, the solution of lead acetate and borax was mixed at 65 °C. The resulting lead borate gel precipitate was filtrated and dried at 120 °C for 24 hours (US3126351) [19]. Pb(BO2)2·H2O was also
syn-thesized at an electrochemical cell using a lead anode and a sodium tetraborate catholyte solu-tion (US2104549) [20]. Another patent is about preparation of nanosize lead metaborate under microwave irradiation. Borax and lead nitrate with mole ratio 1:1 were precipitated in the presence of sodium succinate for 1.5 h to 2 h and processed by 500 W microwave illumination for 4 min to 6 min (CN1562840A) [21].
In this study, we have synthesized Pb(BO2)2·H2O nanostructures by a simpler
method than the techniques known in the literature. In this method, lead ions were precipitated with a borate buffer solution (pH: 9.2) in presence of polyethylene glycol
(PEG) at ambient conditions. The results have displayed that buffer-precipitation method is attractive for the production of lead metaborate nanostructures.
2.
Experimental
2.1. Materials and synthesis method
All the chemicals were used without pu-rification. Lead nitrate (Pb(NO3)2) (>99.5 %),
sodium hydroxide (NaOH) (>97.0 %), boric acid (H3BO3) (>99.9 %) and polyethylene glycol 6000
(5000 g·mol−1 to 7000 g·mol−1) were purchased from Merck Company.
10 mmol Pb(NO3)2 and 15 mmol PEG were
solved in the 200 mL of distilled water (PEG-metal solution). 60 mmol H3BO3 and 30 mmol NaOH
were also solved in to 60 mL of distilled water to prepare the buffer solution (pH: 9.2):
4H3BO3+ 2NaOH → Na2B4O7+ 7H2O (1)
PEG-metal solution was put into a reaction vessel and then the mixing rate was adjusted to 2000 rpm. The buffer solution suddenly was added into the re-action vessel, thus, the rere-action started as follows:
Na2B4O7+ Pb(NO3)2+ 4H2O
→ Pb(BO2)2· H2O↓ + 2NaNO3+ 2H3BO3 (2)
After 30 min, a milky solution was formed at room temperature. The solution was centrifuged at 8000 rpm for 10 min and a white precipitate was obtained under the test tube. The precipitate was washed by distilled water using the centrifuge four times to remove impurities completely and then dried at 70 °C for one day.
2.2. Characterization
The crystallinity and phase studies were carried out using PANalytical Empyrean X-ray diffraction (XRD) Analyzer with CuKα radiation (1.54059 Å) at 40 mA and 45 kV. The FT-IR (Fourier transform infrared spectroscopy) spectra were recorded using PerkinElmer 65 model FT-IR Spectrometer in the range of 4000 cm−1 to 600 cm−1. Thermal gravi-metric analysis was done from 25 °C to 800 °C
at a heating rate of 10 °C/min under nitrogen flow of 40 mL/min by Mettler Toledo TGA/DTA. UV-Vis diffuse reflectance measurement was per-formed by T80 UV-Vis Spectrometer (PG Instru-ments). A field emission scanning electron mi-croscope (Model: FEI Quanta 650 Field Emis-sion SEM) was used to study the morphology of nanoparticles. All transmission electron mi-croscope (TEM) images were taken on a Hi-tachi HT7700 TEM instrument equipped with the EXALENS HR-TEM lens, STEM and EDAX modules operated at 120 kV. Thermo X series 2 model ICP-MS (Inductively Coupled Plasma-Mass Spectrometer) was used for chemical analysis of the product.
3.
Results and discussion
Lead metaborate structure is significantly af-fected by the pH of the medium [22]. Thus, a con-stant pH value before and after synthesis is critical for obtaining a pure product. Despite of the lack of detailed studies, it is known that lead metaborate precipitates at pH 9.2 or above [20]. So the pH of buffer solution was adjusted as 9.2, and it was en-sured that the pH value was the same throughout the synthesis period using suitable ion concentra-tion at the beginning.
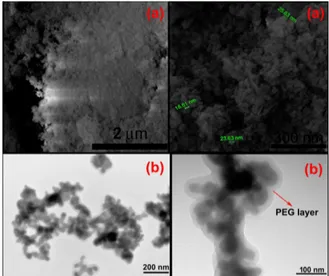
The XRD analysis was used to confirm the amorphous or crystalline state of the materials. The X-ray diffraction pattern of the product was recorded in the range of 15° to 90°. The results showed that the XRD pattern of the product ex-hibited broad diffusion at lower scattering angles indicating the presence of long range structural disorder which is characteristic of amorphous na-ture as shown in Fig. 1. Besides, the product has two typical amorphous halo, like the other bo-rate glasses shown in the literature [23, 24]. ICP-MS was used to determine the atomic ratio of Pb:B in the product. It was found to be about 1.9, which is close to the theoretical ratio of 2. The minor error can be due to the indirect analyzing method. SEM experiments were conducted to in-vestigate the morphology of the product (Fig.2a). A large number of structures with spherical shapes are observed; whose average particle size is
30±9 nm. In Fig.2b, TEM image also shows that the product consists mainly of spherical particles. In addition, the PEG layer with a thickness of about 10 nm around some particles can be seen in the TEM images.
Fig. 1. XRD pattern of Pb(BO2)2·H2O.
Fig. 2. SEM (a) and TEM (b) images of Pb(BO2)2·H2O.
Fig. 3. FT-IR spectrum of Pb(BO2)2·H2O.
The FT-IR spectrum of the product (Fig.3) ex-hibits the following absorption bands and they were
assigned referring to the literature [25, 26]. The band at 3301 cm−1 is the stretching vibration of the O–H group. The band at 2921 cm−1is assigned to the H–C–H bending mode, which shows PEG molecules on surfaces of lead metaborate nano-structures. The bands at 1387 cm−1, 1333 cm−1 and 913 cm−1 are the asymmetric and symmet-ric stretching of [BO3], respectively. The band at
685 cm−1 is assigned to out-of-plane bending of [BO3]. These assignments are consistent with the
structure of Pb(BO2)2·H2O, in which the
poly-borate anion contains only [BO3] functional group.
Fig. 4. DTG/TG analysis graphics of Pb(BO2)2·H2O.
The DTG/TG curve of the Pb(BO2)2·H2O
prod-uct (Fig.4) indicates three mass losses. First mass loss of 6.17 % appears from 303 K to 493 K, which corresponds to the loss of one water molecule and agrees with the calculated value of 5.80 %. Sec-ond mass loss is 2.56 % from 493 K to 693 K, which displays PEG decomposition [27]. Third mass loss in the DTG curve is at 785 K due to the decomposition and the collapse of the whole framework [12,13].
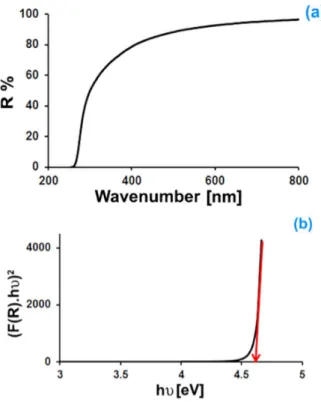
Fig. 5a shows optical reflectance for Pb(BO2)2·H2O sample. Many techniques have
been developed to calculate band gap energy from diffuse reflectance measurements [28]. A basic method is to graph the reflectance against wavelength, where the onset of linear diffuse reflectance increase is considered the band gap energy. However, it is important to determine the transition type to accurately identify the band gap [28, 29]. We used Mc Lean analysis [30] for the absorption edge to identify the transition type and calculate the optical band gap:
Fig. 5. Optical reflectance spectrum (a); and plot (F(R)·hν)2vs. hν (b).
where k represents a constant depending on the transition probability, Eg is the optical band gap
and α is the absorption coefficient: F(R) = α
s =
(1 − R)2
2R (4)
where F(R) is the Kubelka-Munk function, R is the reflectance and s is the scattering factor. Since F(R) is proportional to α (equation 4), n can be estab-lished by plotting (F(R)hν)nagainst hν. The value of n specifies the transition type: n = 2 for direct al-lowed transitions, n = 2/3 for direct forbidden tran-sitions, n = 1/2 for indirect allowed trantran-sitions, and n = 1/3 for indirect forbidden transitions. The best linear fit near the absorption edge was determined as n = 2 for the sample, i.e., direct allowed transi-tions. Thus, we can transform equation3as:
F(R) · hν = k (hν − Eg)1/2 (5)
Thus, the band gap determined from a plot of (F(R)hν)2 versus hν is found to be approximately 4.6 eV (Fig.5b). The band gap is bigger than that
of the bulk material Pb(BO2)2·H2O (4.12 eV),
be-cause the smaller particles exhibit larger band gap, which is a well-known size effect [31].
4.
Conclusions
In summary, a hydrated lead metaborate was fabricated via a facile precipitation method us-ing a buffer solution. The results (XRD, ICP, TG) demonstrate the product is Pb(BO2)2·H2O.
It mostly consists from mainly spherical particles of 30±9 nm. Thermal analysis and TEM images showed that the surfaces of the particles are mod-ified by PEG molecules. We believe that the cur-rent work further enriches the synthesis methods of metal borates and provides useful and signifi-cant insights into the understanding of lead borate structures.
References
[1] CHENC., SASAKIT., LIR., WUY., LINZ., MORIY., HUZ., WANGJ., AKA G., YOSHIMURAM., Nonlin-ear optical borate crystals: Principals and applications, Wiley-VCH, 2012.
[2] JANSSEN Y., MIDDLEMISS D.S., BO S.-H., GREY
C.P., KHALIFAH P.G., J. Am. Chem. Soc., 134 (30) (2012), 12516.
[3] GAO W., JING Y., YANG J., ZHOU Z., YANG D., SUNJ., LINJ., CONGR., YANGT., Inorg. Chem., 53 (5) (2014), 2364.
[4] KESZLERD.A., Curr. Opin. Solid State Mater. Sci, 1 (2) (1996), 204.
[5] PISARSKA J., J. Phys. Cond. Matter, 21 (28) (2009), 285101.
[6] SONTAKKEA.D., BISWASK., TARAFDERA., SENR., ANNAPURNA K., Opt. Mater. Express, 1 (3) (2011), 344.
[7] SINGHN., SINGHK. J., SINGHK., SINGHH., Nucl. Instrum. Meth. B, 225 (3) (2004), 305.
[8] WU Y., ZHANG Q.-P., ZHOU D., ZHOU Y.-L., ZHENGJ., J. Alloy. Compd., 727 (2017), 1027. [9] ZHANG Q. P., SUN N., ZHENG J., WANG S.W.,
WUY., LUOD.L., ZHOUY.L., Adv. Eng. Mater., 19 (3) (2017), 1600650.
[10] DAVIDOVICH R.L., STAVILA V., MARININ D.V., VOITE.I., WHITMIREK.H., Coord. Chem. Rev., 253 (9 – 10) (2009), 1316.
[11] LID.-S., WUY.-P., ZHANGP., DUM., ZHAOJ., LI
C.-P., WANGY.-Y., Cryst. Growth Des., 10 (5) (2010), 2037.
[12] TIAN H.-R., WANG W.-H., GAO Y.-E., DENG T.-T., WANG J.-Y., FENG Y.-L., CHENG
[13] TIAN H.-R., WANG W.-H., ZHANG X.-P., FENG
Y.-L., CHENGJ.-W., Dalton T., 42 (4) (2013), 894. [14] CORKERD., GLAZER A., Acta Crystallogr. B, 52 (2)
(1996), 260.
[15] KROGH-MOEJ., WOLD-HANSENP., Acta Crystallogr. B, 29 (10) (1973), 2242.
[16] BELOKONEVAE., DIMITROVAO., KORCHEMKINAT., STEFANOVICH S.Y., Crystallogr. Rep., 43 (5) (1998), 810.
[17] RASTSVETAEVA R., ARAKCHEEVA A., PUSHCHAROVSKY D.Y., VINOGRADOVA S., DIM
-ITROVAO., STEFANOVICHS.Y., Z. Krist-Cryst. Mater., 213 (1998), 240.
[18] SCHOENEGGER S., ORTNER T.S., WURST K., HEY
-MANN G., HUPPERTZ H., Z. Naturforsch. B, 71 (8) (2016), 925.
[19] LAURENCE R., BLAIR G., KARLIE L.J.S.N., Hy-drated lead borate products, US3126351A, 1964. [20] STOCKDALES.W., WEAVERE.F., PAULT.S.,
Manu-facture of lead borate, US2104549A, 1938.
[21] XIAOTIAN P., Microwave coprecipitation method for preparing nano glaze of lead metaborate, CN1562840A, 2004.
[22] SONGJ.-L., HUC.-L., XUX., KONGF., MAOJ.-G., Inorg. Chem., 52 (15) (2013), 8979.
[23] ABDULLAH M., HUSSINW. M. H.W., KASSIMA., YAHYAN., Konaka, 56 (2015), 380.
[24] SHAJAND., MURUGASENP., SAGADEVANS., Dig. J. Nanomater. Biostruct., 11 (1) (2016), 177.
[25] OTHMANH., ELKHOLYH., HAGERI., J. Mol. Struc., 1106 (2016), 286.
[26] WANGP.-P., HUANGH.-S., LIP., LIUZ.-H., Therm. Acta, 512 (1) (2011), 124.
[27] HANS., KIMC., KWOND., Polym. Degrad. Stab., 47 (2) (1995), 2003.
[28] LÓPEZR., GÓMEZ R., J. Sol-Gel Sci. Techn., 61 (1) (2012), 1.
[29] SCHEVCIWO., WHITE W.B.T., Mater. Res. Bull., 18 (9) (1983), 1059.
[30] MC LEANT., Prog. Semiconduct., 5 (1960), 53. [31] RODUNERE., Chem. Soc. Rev., 35 (7) (2006), 583.
Received 2018-11-14 Accepted 2019-04-23