Fine-Tuning the Dispersion and the Mobility of BaO Domains on NO
xStorage Materials via
TiO
2Anchoring Sites
†Stanislava M. Andonova,‡Go¨ksu S. S¸entu¨rk,‡ and Emrah Ozensoy*,‡,§
Chemistry Department, Bilkent UniVersity, 06800 Bilkent, Ankara, Turkey, and Institute of Material Science and Nanotechnology, 06800, Bilkent, Ankara, Turkey
ReceiVed: March 22, 2010; ReVised Manuscript ReceiVed: July 12, 2010
In an attempt to control the surface dispersion and the mobility of BaO domains on NOxstorage materials, TiO2/TiOx anchoring sites were introduced on/inside the conventional γ-Al2O3 support matrix. BaO/TiO2/ Al2O3ternary oxide materials were synthesized via two different sol-gel preparation techniques, with varying surface compositions and morphologies. The synthesized NOxstorage materials were studied via XRD, Raman spectroscopy, BET surface area analysis, TPD, XPS, SEM, EDX-mapping, and in situ FTIR spectroscopy of adsorbed NO2. NOxuptake properties of the BaO/TiO2/Al2O3materials were found to be strongly influenced by the morphology and the surface structure of the TiO2/TiOxdomains. An improved Ba surface dispersion was observed for the BaO/TiO2/Al2O3materials synthesized via the coprecipitation of alkoxide precursors, which was found to originate mostly from the increased fraction of accessible TiO2/TiOxsites on the surface. These TiO2/TiOx sites function as strong anchoring sites for surface BaO domains and can be tailored to enhance surface dispersion of BaO. TPD experiments suggested the presence of at least two different types of NOxspecies adsorbed on the TiO2/TiOxsites, with distinctively different thermal stabilities. The relative stability of the NOxspecies adsorbed on the BaO/TiO2/Al2O3system was found to increase in the following order: NO+/N2O3on alumina , nitrates on alumina < surface nitrates on BaO < bridged/bidentate nitrates on large/isolated TiO2clusters < bulk nitrates on BaO on alumina surface and bridged/bidentate nitrates on TiO2 crystallites homogenously distributed on the surface < bulk nitrates on the BaO sites located on the TiO2domains.
1. Introduction
The negative influence of the NOx, particulate matter (i.e.,
soot), and SOxemissions from automotive and stationary sources
remains an important environmental problem, especially in view of the increasingly stringent emission limits worldwide. Achieve-ment of these high environAchieve-mental standards restricting the NOx
emissions1in particular from diesel-equipped vehicles requires
both a further reduction of NOx by more efficient catalytic
emission after-treatment technologies and engine technologies with an improved fuel economy.
NOxstorage reduction (NSR) technology is one of the promising
alternatives for the catalytic NOxremoval from lean - burn gasoline
engines.2-4The typical catalysts most commonly used for NSR
applications involve combinations of noble metals (Pt, Pd, Rh) for oxidation and reduction purposes and barium oxide as the primary NOxstorage component, supported on a high surface
area support material, such as γ-Al2O3. The NSR catalytic
concept5-8is based on the storage of NO
xon the BaO or K2O
component for a relatively long “lean” period that is abundant in oxygen, followed by a short “rich” period where NOx is
released and successively reduced to N2on the noble metal sites,
in a gas phase environment that is enriched in unburned hydrocarbons, H2and CO.
The main drawback of the typical NSR catalysts is the high affinity of these catalysts toward sulfate formation (originating from the presence of sulfur containing compounds in the exhaust
feed), which leads to significant catalytic deactivation.9-12Thus,
efforts toward improving the catalytic tolerance against sulfur poisoning and designing highly active and stable novel NSR catalysts are extremely crucial.13-15
One of the areas that have been a major target in numerous studies16-19in the past decade is the development of an optimal
support material that will improve the catalytic stability by assisting the formation of sulfur resistant species in the catalytic system. In several studies14,15,20-26it was pointed out that titania
addition to the conventional alumina support reduces the stability of the sulfates and the use of titania-containing mixed oxides as support materials provides a potential avenue for sulfur tolerance improvement. It was found out that the sulfates formed on TiO2are unstable, primarily due to the inherent acidity of
this specific oxide surface.21 Furthermore, active sites on the
TiO2surface can also be relatively readily regenerated under
reaction conditions.21
In our recent studies27,28we have focused our attention on
the structural and morphological changes occurring on the ternary oxide NOx storage systems in the form of BaO/TiO2/ γ-Al2O327and FeOx/TiO2/γ-Al2O3.28Our findings suggested that
on the BaO/TiO2/γ-Al2O3system, Ti domains provide strong
anchoring sites for the Ba-containing units and significantly alter the surface morphology, composition and the stoichiometry of the Ba-containing units as well as the surface mobility of the BaO clusters.
As a continuation of this particular former study,27 the aim
of the current work was directed toward finding an optimum surface chemistry for the ternary BaO/TiO2/Al2O3mixed oxide
system. Along these lines, the binary oxide TiO2/Al2O3support †Part of the “D. Wayne Goodman Festschrift”.
* Corresponding author. E-mail: [email protected].
‡Bilkent University.
§Institute of Material Science and Nanotechnology.
10.1021/jp102555c 2010 American Chemical Society Published on Web 07/29/2010
material was prepared by using various Ti and Al precursors via two different sol-gel precipitation techniques.
Thus, the composition-dependent and the temperature-de-pendent structural changes, as well as the NOxstorage
capabili-ties of different TiO2/Al2O3 support materials and the
corre-sponding ternary oxide NOxstorage systems (BaO/TiO2/A2O3)
were analyzed in detail by means of X-ray diffraction (XRD), Raman spectroscopy, temperature programmed desorption (TPD), BET surface area measurements, X-ray photoelectron spectros-copy (XPS), scanning electron microsspectros-copy (SEM), energy dispersive X-ray mapping (EDX-mapping), and Fourier trans-form infrared (FTIR) spectroscopy of adsorbed NO2.
2. Experimental Section
2.1. Sample Preparation. 2.1.1. Synthesis of TiO2/Al2O3 Support Material. Two different synthetic routes were used for the preparation of the binary oxide TiO2/Al2O3support material
(referred as P1 and P2 in the text). The mole fraction of TiO2
was kept constant and equal to ∼0.3 in both preparation protocols.
In the first synthetic protocol (P1),27,29the mixed oxide was
prepared by using a procedure that was also described in detail in one of our recent studies.27Briefly, γ-Al
2O3(Puralox, 200
m2/g, SASOL GmbH, Germany) and TiCl
4(∼0.1 M in 20%
hydrochloric acid, Fluka) were used as starting materials. Titanium(IV) chloride solution was added dropwise to precooled deionized water under continuous stirring. The temperature during the addition of the precursor was kept below 333 K by placing the solution beaker in an ice bath. After complete dilution, γ-Al2O3 powder was slowly added to the aqueous
solution under constant stirring at room temperature. Next, the slurry was continuously stirred and 30 vol % NH3was slowly
added to the solution to maintain a condition where pH g 9.0. Gel formation started to be observed after the pH adjustment. The obtained white gel was aged for 24 h under ambient conditions and then filtered, washed with distilled water, and dried at 423 K for 2 h.
In the second synthetic protocol (P2), the binary TiO2/Al2O3
oxide support material was synthesized by a novel sol-gel method that has been designed by our research group. In this synthetic protocol (P2), titanium and aluminum alkoxides were used as TiO2 and Al2O3 precursors and propan-2-ol and
acetylacetone as solvents. First, 24.63 g of aluminum sec-butoxide (97%, Sigma Aldrich) was dissolved in 115 mL of propan-2-ol (99.5 +%, Sigma Aldrich) and 3.1 mL of acety-lacetone (99.3%, Fluka) under vigorous stirring at room temperature for 30 min. After the complete dilution of the Al2O3
precursor solution, 7.65 g of titanium(IV) isopropoxide (97%, Sigma Aldrich) was added dropwise to the solution under constant stirring at room temperature. The mixture was continu-ously stirred for 30 min and then the coprecipitation of the corresponding hydroxides was achieved by gradual addition of 5 mL of 0.5 M HNO3. The resulting precipitate (white gel) was
aged for 10 days under ambient conditions, and then the product was ground into a fine powder form. Finally, the binary oxide TiO2/Al2O3support material was obtained by heating the dry
gel at 873 K for 2 h in air.
Thermal evolution of the obtained TiO2/Al2O3support
materi-als prepared by P1 and P2 (referred as Ti/Al(P1) and Ti/Al(P2) in the text) were further investigated and compared after various calcination steps (with durations of 2 h/step) in air at various temperatures (423-1273 K).
2.1.2. Synthesis of BaO/TiO2/Al2O3NOxStorage Materials. A series of BaO/TiO2/Al2O3samples with different Ba loadings
(8 and 20 wt % BaO) were synthesized by conventional incipient
wetness impregnation of the dried Ti/Al gels prepared via protocols labeled as P1 and P2. The support materials were impregnated with aqueous solutions of barium nitrate (ACS Reagent, g99%, Riedel-de Ha¨en, Germany). Then, the synthe-sized samples were dried at 353 K and calcined in Ar atmo-sphere for 2 h at various temperatures, ranging from 423 to 1273 K. Hence, after each temperature treatment, representative samples from the treated batches were collected for ex situ analysis. For the FTIR and TPD studies, samples synthesized via impregnation were directly annealed at 873 K for 2 h in Ar(g) before their introduction to the catalytic reactor for the NO2(g) adsorption experiments.
For an accurate comparison of the current results, pure
γ-Al2O3, pure TiO2 (Anatase Nano-Powder, 99.9%, 40 nm,
Inframat Advanced Materials), and BaO/γ-Al2O3samples27,28
with different BaO (8 and 20 wt % BaO) loadings were also used as reference materials. Compositions of the NOxstorage
materials and their acronyms used in the current text are presented in Table 1.
2.2. Experimental Methods. BET specific surface area
measurements were performed using a Micromeritics Tristar 3000 surface area and pore size analyzer by low-temperature isothermal adsorption-desorption of N2. Before the surface area
measurements, the samples were outgassed at 623 K for 2 h in vacuum.
XRD patterns were recorded using a Rigaku diffractometer, equipped with a Miniflex goniometer and an X-ray source with Cu KR radiation, at λ ) 1.5418 A, 30 kV, and 15 mA. The powder samples were scanned in the 10-80°, 2θ range with a scan rate of 0.01° s-1. Diffraction patterns were assigned using Joint Committee on Powder Diffraction Standards (JCPDS) cards supplied by the International Centre for Diffraction Database (ICDD).
Raman spectra were recorded on a HORIBA Jobin Yvon LabRam HR 800 instrument, equipped with a confocal Raman BX41 microscope, spectrograph with an 800 mm focal length and a CCD detector. The Raman spectrometer was equipped with a Nd:YAG laser (λ ) 532.1 nm). During the Raman experiments, the laser power was tuned to 20 mW. Before the Raman measurements, the powder samples were mechanically dispersed onto a single-crystal Si holder. The spectrometer was regularly calibrated by adjusting the zero-order position of the grating and comparing the measured Si Raman band frequency with the typical reference value of 520.7 cm-1. All Raman spectra were acquired within 100-4000 cm-1with an acquisi-tion time of 213 s and a spectral resoluacquisi-tion of 4 cm-1.
FTIR spectroscopic measurements were carried out in trans-mission mode in a batch-type catalytic reactor coupled to an FTIR spectrometer (Bruker Tensor 27) and a quadruple mass spectrometer (QMS) (Stanford Research Systems, RGA 200) for TPD and residual gas analysis (RGA). FTIR spectra were recorded using a Hg-Cd-Te (MCT) detector, where each spectrum was acquired by averaging 128 scans with a spectral resolution of 4 cm-1. The samples were mounted into the IR cell28consisting of a five-way stainless steel chamber equipped
with optically polished BaF2 windows. This IR cell was
TABLE 1: Compositions of the Synthesized and Investigated Ternary Oxide NOxStorage Materials
wt % BaO wt % TiO2 wt % Al2O3
8Ba/Ti/Al (P1) 8 23 69
8Ba/Ti/Al (P2) 8 27 65
20Ba/Ti/Al (P1) 20 20 60
connected to a gas manifold (including a dual-stage rotary vane pump and two turbomolecular pumps) so that the pressure in the cell could be varied within 1000 to 10-6Torr. About 20 mg of finely ground powder sample was pressed onto a high transmittance, lithographically etched fine-tungsten grid that was mounted on a copper sample holder assembly, attached to a ceramic vacuum feedthrough. A K-type thermocouple was spot-welded to the surface of a thin tantalum plate attached on the W-grid to monitor the sample temperature. The sample tem-perature was controlled within 298-1100 K via a computer controlled DC resistive heating system using the voltage feedback from the thermocouple. After the sample was mounted in the IR cell, it was gradually heated to 373 K in vacuum and kept at that temperature for at least 12 h before the experiments to ensure the removal of water from the surface. In an attempt to minimize the effect of background water (i.e., readsorption of water on the sample from the reactor walls and the gas manifold), the system was frequently baked. Prior to each NOx
adsorption experiment, the walls of the vacuum system were passivated by flushing 2 Torr of NO2(g) for an extended period
of time (20 min) followed by evacuation at the same temper-ature. Next, to obtain a surface that is free of adsorbed NOx
and other adsorbates, the sample was annealed in vacuum by increasing the temperature to 1023 K in a linear fashion at a constant rate of 12 K min-1. After this annealing protocol, sample was cooled to 323 K. Before acquisition of each spectral series, a background spectrum of the clean, adsorbate free sample was obtained in vacuum at 323 K (with a residual reactor pressure∼1 × 10⁻⁵Torr).
NO2(g) (prepared by reacting NO(g), Air Products, purity
>99.9% and O2(g) Ersoy Gas, purity >99.9%) used in the
adsorption experiments was further purified via several freeze-thaw pump cycles before the experiments. NO2(g)
adsorption experiments were performed via two subsequent NOx
uptake protocols. In the first protocol, precisely controlled doses of 0.6 Torr of NO2(g) (measured by a 1000 Torr MKS Baratron
absolute pressure transducer) were introduced in a stepwise fashion onto the NOx-free sample surface at 323 K. After the
sample spectrum of each dose was acquired at 323 K, the system was evacuated to∼1 × 10⁻³Torr before the next dosage. This protocol allowed us to follow the FTIR spectral changes during the gradual NO2(g) adsorption on the samples at 323 K. In the
second NOxuptake protocol, subsequent to the gradual
(step-wise) NO2doses, the sample was exposed to 8 Torr of NO2(g)
for 20 min at 323 K to ensure the complete saturation of the sample surface with NOxand the FTIR spectra were acquired
after having evacuated the reactor to∼1 × 10⁻³Torr at 323 K. TPD experiments were performed by using a QMS that is directly connected to the vacuum chamber through a pneumatic gate valve. Before the TPD experiments, the sample powder (mass ) ca. 20 mg) pressed onto a tungsten grid was mounted in the IR/TPD cell and pretreated using the identical procedure described above. After cooling to 323 K, the sample was
exposed to 8 Torr of NO2for 20 min until the equilibrium was
reached. Next, the system was outgassed to∼1 × 10⁻⁶Torr to remove weakly physisorbed molecules. Subsequently, TPD experiments were carried out. Evolved NOxspecies during the
desorption process were monitored by recording the QMS signals with mass to charge ratios (m/z) equal to 18, 28, 30, 32, 44, and 46 in pressure vs time mode. A linear temperature ramp within 323-1023 K was used during the TPD experiments where the ramp rate was 12 K/min. To ensure the reproducibility of the results, TPD experiments were performed multiple times for each sample.
XPS data were acquired using a Thermo Scientific K-Alpha-monochromated, high performance XPS spectrometer with an Al KR X-ray source. Analyzed samples were investigated as is, i.e., without performing any ion sputtering or etching procedures before the analysis. A flood type electron gun was also utilized during the measurements for charge neutralization purposes.
3. Results and Discussion
3.1. Thermal Stability and Structure of the Binary Ti/Al Oxide Support Materials. 3.1.1. BET Specific Surface Area
Measurements. Thermal evolution and the thermal stability of the Ti/Al(P1/2) support materials as well as the ternary Ba/Ti/Al(P1/P2) mixed oxides prepared via two different sol-gel preparation techniques were studied as a function of the thermal treatment temperatures (423-1273 K). The specific surface areas of the samples measured after thermal treatment steps at various annealing temperatures (623-1273 K) are presented in Table 2.
From the results summarized in Table 2, it is evident that the Ti/Al(P2) samples synthesized by the sol-gel coprecipitation technique have significantly higher specific surface area values for the temperature interval within 623-873 K than that of the Ti/Al(P1) material. The porous structure of the Ti/Al(P2) system is relatively unstable at elevated temperatures (T> 1073 K). It can be seen that the initial higher specific surface area of the Ti/Al(P2) material at 623 K significantly diminishes after the annealing treatment at 1273 K, indicating a profound loss of its structural integrity. On the other hand, although the Ti/Al(P1) system presents relatively lower surface area values within 623 and 1073 K, it partially preserves its porous structure even after the thermal treatment at 1273 K.
The BET results for the ternary mixed oxide 8(20)Ba/Ti/ Al(P1/P2) systems showed that the corresponding specific surface areas of the Ti/Al(P1/P2) support materials were strongly affected by the inclusion of a NOxstorage component. As will
be further discussed in sections 3.1.2, 3.1.3, and 3.4, the 8(20)Ba/ Ti/Al(P1/P2) samples are characterized by typically lower surface area values with respect to the corresponding support materials due to phase segregation, sintering of the segregated crystallites, and blocking of the high surface area support sites with BaO domains possessing a lower surface area. This trend TABLE 2: BET Specific Surface Area Measurement Results for the Investigated Materials
samplea
T/K Ti/Al(P1) Ti/Al(P2) 8Ba/Ti/Al(P1) 8Ba/Ti/Al(P2) 20Ba/Ti/Al(P1) 20Ba/Ti/Al(P2)
623 237.2b 424.2b 199.8 258.8 104.8 201.9 873 167.0b 393.2b 149.5 184.8 79.4 173.1 1073 131.9b 131.2b 111.2 146.2 58.6 95.2 1273 74.8b 9.2b 65.1 18.1 20.7 80.9 a
Surface area values are given in m2/g. b
These samples were calcined in air at the given temperatures for a duration of 2 h before the surface area measurements while all other samples were annealed in Ar(g) flow for 2 h at the given temperatures before the measurements.
also holds for the 8(20)Ba/Ti/Al(P1) samples where increasing Ba loadings leads to smaller surface area values at all temper-atures. However, a reversal of this trend is clearly observed particularly for the 8(20)Ba/Ti/Al(P2) samples at 1273 K, where higher Ba loadings lead to significantly higher surface area values as compared to the Ti/Al(P2) support material. Thus, it is apparent that Ba-containing domains typically tend to preserve the porous structure of the Ba/Ti/Al materials at elevated temperatures.
3.1.2. XRD Experiments. Figure 1 presents the XRD data for the binary Ti/Al(P2) oxide system. The results given in Figure 1 can be analyzed in detail in the light of the structural changes of the support material Ti/Al(P1) that were discussed in one of our recent reports.27
It can readily be seen in Figure 1 that the uncalcined Ti/ Al(P2) sample as well as the samples calcined within 423-1073 K contain very broad and poorly defined diffraction features that can probably be attributed to γ-Al2O3(JCPDS 29-0063,
marked with triangles). Thus, it is apparent that the sol-gel coprecipitation technique results in the formation of a composite Ti/Al(P2) support material structure with almost no discernible crystalline phases at T e 1073 K. In contrast, such a situation is not valid for the Ti/Al(P1) sample, where the presence of strong reflections due to the formation of crystalline TiO2
(anatase) phase (JCPDS 21-1272) was observed at 873 K.27This
suggests that within 423-1073 K, the Ti/Al(P2) support material exhibits a structure that predominantly consists of amorphous TiOx/AlOxmixed oxide domains and/or extremely small TiO2
and Al2O3crystallites. This suggestion is also consistent with
the higher specific surface areas of the Ti/Al(P2) samples within 623-873 K than that of the Ti/Al(P1) material.
A further increase in the annealing temperature to 1273 K leads to the appearance of a set of strong diffraction features corresponding to rutile (JCPDS 04-0551) and corundum (R-Al2O3, JCPDS 10-0173) phases. As described in detail
else-where,27,30Al
2O3and TiO2components in the binary Ti/Al oxide
system can form a solid solution. Furthermore, in such a solid solution, anatase to rutile transformation is also accompanied by a phase transition in which γ-Al2O3 is transformed into
R-Al2O3 (corundum). It should be noted that the γ-Al2O3 to
R-alumina phase transformation at 1273 K occurs to a greater extent for the Ti/Al(P2) system than that of the Ti/Al(P1) sample, which is in good agreement with the lower surface area of the Ti/Al(P2) sample at 1273 K.
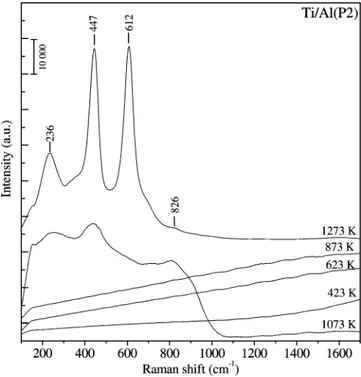
3.1.3. Raman Spectroscopy Experiments. Figure 2 shows the Raman spectra corresponding to the calcined Ti/Al(P2) samples prepared via P2. In accord with the XRD data presented above, unlike the Ti/Al(P1) system,27the Raman spectra of the
uncalcined and calcined Ti/Al(P2) samples within 423-873 K reveal features with low Raman scattering cross sections that are common for materials with poor crystallinity and/or small crystallite sizes.31-33
After the thermal treatment of the Ti/Al(P2) sample at 1073 K, a group of broad and convoluted Raman features become visible at 236, 447, and 826 cm-1. These bands can be attributed to a poorly-crystallized rutile phase.33In Figure 2, rutile bands
are observed to grow in a significant manner when the annealing temperature is increased to 1273 K and unlike the Ti/Al(P1) system27no obvious indication of an anatase phase is visible
for the Ti/Al(P2) system. In addition, no Raman bands attributed to the presence of corundum are observed, probably due to the very strong fluorescence background and the strong intensities of the rutile features with positions that overlap with those of the R-Al2O3.
Thus, Raman data presented in Figure 2 indicate the presence of a homogenously mixed oxide solution for the Ti/Al(P2) system within 473-873 K, which is in very good agreement with the current FTIR and TPD results (sections 3.2 and 3.3) together with the current SEM/EDX (Supporting Information Figure 1) and the XPS data (Supporting Information Figure 2).
3.2. NOxAdsorption on Ti/Al Support Materials via FTIR
Spectroscopy. Further insight regarding the influence of the
structural composition and surface morphology of the synthe-sized support materials on their NOxstorage ability was obtained
by focusing on the nature of the NOxspecies formed during
the adsorption of NO2(g) on the Ti/Al(P1/P2) surfaces. Along
these lines, the evolution of the stored NOxspecies as a function
Figure 1. XRD profiles of the uncalcined Ti/Al(P2) sample and the
Ti/Al(P2) samples after calcination at the given temperatures (423-1273 K).
Figure 2. Temperature-dependent ex-situ Raman spectra of the Ti/
Al(P2) samples after calcination at the given temperatures (423-1273 K).
of the surface NOxcoverage at 323 K was monitored by FTIR
spectroscopy.
The series of IR spectra corresponding to increasing coverages of NOxon the Ti/Al(P1) and Ti/Al(P2) samples are shown in
Figure 3a,b, respectively. To analyze the NOxadsorption data
associated with the Ti/Al(P1/P2) samples in detail, similar adsorption experiments were also performed on two reference surfaces namely, γ-Al2O3and anatase (Figure 3c,d).
3.2.1. Stepwise NO2(g) Adsorption on Ti/Al(P1). The analy-sis of the FTIR data corresponding to the Ti/Al(P1) support material (Figure 3a) presents notable similarities to the reference FTIR data given in Figure 3c, corresponding to the NO2
adsorption on a clean γ-Al2O3surface at 323 K (Figure 3c).
During the very early stages of the NO2(g) uptake of the Ti/
Al(P1) material (the bottommost spectrum given in Figure 3a), FTIR data are exclusively dominated by a strong band at 1230 cm-1, which shifts to 1256 cm-1 at higher coverages. Con-comitant with the increase in the intensity of this band, a further increase in the NOxsurface coverage leads to the appearance
of several additional bands at 1294, 1582, and 1628 cm-1and shoulders at ca. 1320, 1464, and 1560 cm-1. All of these features
progressively grow and reach their highest intensities after complete saturation of the surface with excess of NO2(g) (the
red spectrum of the fully saturated sample surface is denoted with “S” in Figure 3). In addition, there exist other relatively minor features such as the weak band located∼1985 cm-1.
Considering the significant resemblances between the data given in Figure 3a,c, the FTIR data presented in Figure 3a can be interpreted in the light of the numerous former studies in the literature.28,34-37The most prominent band after the first few
initial NO2doses in Figure 3a at 1230 cm-1and the shoulder at
about 1320 cm-1are attributed to the nitrites on the alumina surface. Concomitant with the formation of nitrites, further NO2
doses lead to the oxidation of the surface nitrite species to nitrates. This is in line with the continuous growth and the frequency shift of the nitrite-related feature as well as the appearance of vibrational features that can be assigned to three different types of nitrate species adsorbed on the exposed
γ-Al2O3support surface in the form of bridged (1256 cm-1),
bidentate (1294 cm-1), and monodentate nitrates (1464 and 1560 cm-1). Moreover, the weak band located at ∼1985 cm-1 is associated with the weakly adsorbed N2O3 on the alumina Figure 3. FTIR spectra corresponding to the stepwise NO2adsorption at 323 K on (a) Ti/Al(P1), (b) Ti/Al(P2), (c) γ-Al2O3, and (d) TiO2(anatase)
surfaces. The spectrum corresponding to the NO2-saturated surfaces are marked “S”. x
surface (formed by the reaction of NO2and NO) or possibly
associated with the adsorbed NO+.38
Despite the observed similarities between parts a and c of Figure 3, FTIR data corresponding to the Ti/Al(P1) sample clearly indicate important differences with respect to that of
γ-Al2O3. It is readily visible in Figure 3a that the Ti/Al(P1)
sample presents two additional strong features located at 1582 and 1628 cm-1. These additional features can be seen even after the very first NO2 pulses and dominate the spectra after the
complete saturation of the Ti/Al(P1) surface with NO2(g).
Absence of these additional features in Figure 3c and the suppression of the 1605, 1620, 1256, and 1294 cm-1 bands (assigned to bidentate and bridged nitrates on the γ-Al2O3sites)
in Figure 3a clearly indicate a relative inhibition of the NOx
uptake of the γ-Al2O3sites on the Ti/Al(P1) surface and the
presence of new adsorption sites associated with the TiO2
domains.
Furthermore, it is apparent that these additional features at 1582 and 1628 cm-1are very similar to those detected in the IR spectra of adsorbed NO2on pure anatase (Figure 3d) and
can be readily assigned to various types of nitrates on the TiO2
domains existing on the surface of the Ti/Al(P1) sample. On the basis of the numerous former studies in the literature,39-42
these bands can be attributed to bidentate (1582 cm-1) and bridged (1628 cm-1) nitrates located on the Ti4+sites of the
Ti/Al(P1) surface. It should be noted that the argument regarding the presence of different nitrate species adsorbed on the Ti/ Al(P1) sample with different adsorption sites and adsorption geometries, is in very good agreement with our previous studies on the structure and the surface acidity of the Ti/Al(P1) system.27
In these studies, it was shown via in situ FTIR spectroscopy of chemisorbed pyridine that at least three different types of Al3+
Lewis acid sites and additional medium-strength Ti4+Lewis acid
sites are present on the Ti/Al(P1) sample, exhibiting distinctively dissimilar acid strengths.
Current FTIR data indicate that the presence of TiO2(anatase)
crystallites on the surface of the alumina particles in the Ti/ Al(P1) system significantly influences the nature of the adsorbed NOx species by providing additional Ti4+ NOx storage sites.
However, the suppression of the IR features associated with the nitrates adsorbed on the exposed γ-Al2O3sites of the Ti/
Al(P1) surface (together with the BET, XRD, and Raman results discussed above) suggests the existence of large TiO2crystallites
that partially block some of the accessible Al3+surface sites.
In other words, the surface morphology of the TiO2(anatase)
domains relatively hinders the NOxadsorption ability of the Ti/
Al(P1) system with respect to that of the pure γ-Al2O3. These
arguments are also consistent with the TPD data which will be discussed in detail in section 3.3.
3.2.2. Stepwise NO2(g) Adsorption on Ti/Al(P2). The re-semblance of the IR spectral characteristics of the Ti/Al(P2) sample (Figure 3b) to that of the reference anatase (TiO2)
material (Figure 3d) suggests that Ti4+storage sites distributed
on the Ti/Al(P2) support material surface have a very significant contribution to the resultant FTIR spectra after the NO2
adsorption (Figure 3b).
It can be seen in Figure 3b that the initial doses of NO2(g)
lead to the appearance of a weak band at 1221 cm-1 with a shoulder at ∼1185 cm-1 (these features are highlighted with red in Figure 3b). However, after successive NO2doses, the
shoulder at∼1185 cm-1starts to attenuate. This is accompanied by an increase in the intensity of the feature at 1221 cm-1. Furthermore, a set of new bands at 1237, 1582, and 1638 cm-1 and shoulders at ∼1286 and 1560 cm-1also become visible.
Intensities of all of these features monotonically increase with increasing NO2doses and reach their saturation values after an
8 Torr NO2exposure for 20 min at 323 K (the red spectrum
marked with “S” in Figure 3b).
On the basis of various former studies, focusing on the NOx
adsorption on pure TiO2(anatase),39-42vibrational features for
the Ti/Al(P2) sample (Figure 3b) can be assigned as follows: the most prominent band observed during the initial doses at 1221 cm-1 (which is also visible as a shoulder in the “S” spectrum) and the band at 1582 cm-1 are attributed to the bidentate nitrates that are bound to TiO2particles. The feature
visible in the spectra as a weakly expressed shoulder at about 1185 cm-1is assigned to nitrites coordinated also on the Ti4+
adsorption centers. The relative attenuation of the intensities of the latter feature due to increasing NO2 exposure can be
associated with the gradual oxidation of nitrite species to nitrates. Furthermore, the features located at 1638 and 1237 cm-1are assigned to the formation of bridged nitrates on the titania surface. Figure 3b clearly indicates that the presence of nitrite/ nitrates species on the Ti4+ adsorption sites also significantly
dominates the band at 1560 cm-1, which is associated with the monodentate nitrates on the alumina surface. Focusing on the IR data in Figure 3b, it should be pointed out that after the saturation of the surface with NOx, the band which was
originally observed on pure TiO2at 1286 cm-1and the group
of features at 1500-1550 cm-1are not clearly visible in the IR spectra of the Ti/Al(P2) sample. According to the former IR spectroscopy studies on anatase,39-42the features at 1286 and
1500-1550 cm-1were attributed to the presence of monodentate nitrates on the TiO2surface. In addition, it was found that the
Lewis acid sites on the anatase surface reveal four and five-coordinated Ti4+ions (denoted as R and β sites, respectively)
where R-Lewis acid sites (with two oxygen vacancies) favor bidentate/bridge nitrate formation while the β-sites (Ti4+with
one oxygen vacancy) favor the formation of monodentate nitrates.39-42
Current results given in Figure 3b indicate the lack of a significant amount of monodentate nitrate species on the surface of the Ti/Al(P2) support material, in comparison with that observed for the reference anatase material (Figure 3d). Therefore, it can be suggested that due to the different morphology of the TiO2domains on the Ti/Al(P2) sample, most
of the Ti4+sites dispersed on the γ-alumina surface can adsorb
NOxmostly in the form of bidentate and bridged nitrates.
A comparative analysis of the IR spectra depicted in Figure 3a,b, clearly shows that the NOxvibrational features associated
with the titania sites are much more strongly pronounced for the Ti/Al(P2) sample. Along these lines, the presence of noticeably more intense nitrate vibrational features in Figure 3b, can be attributed to the higher surface area of the Ti/Al(P2) sample as well as to the differences in infrared absorption cross sections of nitrates with different adsorption geometries (note that samples that are used for the experiments presented in Figure 3a-d had identical masses, i.e.,∼20 mg). It is also worth mentioning that the relatively more intense nitrate vibrational signals associated with the Ti4+sites observed for the Ti/Al(P2)
sample also imply that the fraction of accessible Ti4+sites on
the Ti/Al(P2) surface is greater than that of the Ti/Al(P1) surface. This, in turn, indicates a better surface dispersion of the Ti4+sites (possibly due to smaller TiO
2/TiOx domains on
the surface of the Ti/Al(P2) sample) where a large fraction of the Ti4+ NO
x adsorption sites are efficiently dispersed on
the surface and are accessible for NO2adsorption. Thus, it is
dictated by the surface morphology and the distribution of the TiO2domains present on the alumina support. Furthermore, the
difference in the NOxadsorption properties of the mixed oxide
support materials can also be ascribed to the different number of oxygen defect sites and the nature of the surface hydroxyl groups exposed on the surface.43
A detailed analysis of the spectral region within 1300-1100 cm-1(the spectra marked in red) in Figure 3a,b during the very initial NO2doses reveals that the NOxuptake process starts to
occur with the formation of nitrites. As discussed above, the nitrite species on the Al3+and Ti4+adsorption sites with the
corresponding IR bands were detected at 1230 and 1185 cm-1, respectively. Comparison of Figure 3a-d reveals that the presence of TiO2domains tends to hinder the nitrite formation
during the initial NOxuptake. In other words, in Figure 3, the
initial nitrite formation is observed to a greater extent on pure
γ-Al2O3(Figure 3a) and decreases as the number of exposed
Al2O3surface sites decreases (i.e., γ-Al2O3> Ti/Al(P1) > Ti/
Al(P2)> TiO2-anatase). This relative decrease in the initial nitrite
formation could be ascribed to the presence of reactive oxygen species on the TiO2 domains in the form of uncoordinated
oxygen defects,43or as transient oxygen species like O
-, O
2-providing an efficient and rapid oxidation of nitrites into nitrates.43
Further insight regarding the structure and the NOxuptake
properties of the synthesized mixed oxide systems can be obtained by analyzing the vibrational spectral changes in the hydroxyl stretching region of the FTIR data. Figure 4 presents the series of IR spectra that were acquired during the identical set of NO2adsorption experiments described for the data given
in Figure 3.
Two major spectral changes are observed in the hydroxyl region of the FTIR data in Figure 4: (i) development of a series of negative bands within 3800-3650 cm-1, indicating the loss of the isolated OH groups that were present on the surface before the NO2(g) adsorption34,35,44-47and (ii) the appearance of a broad
and convoluted band with positive features within 3650-3400 cm-1due to the formation of hydrogen bonded surface hydroxyl groups that are strongly interacting with each other.34,35,44-47
The high-frequency section of the IR data in Figure 4a (νOH
> 3650 cm-1), shows the development of several negative bands
located at 3730, 3760, and 3775 cm-1and shoulders at∼3690 and 3795 cm-1during the NO2(g) adsorption process on pure
alumina. Appearance of these negative features and their relative intensity changes can be explained by a gradual consumption of the isolated hydroxyl groups on the alumina surface with increasing surface NOxcoverage.44-47Five negative bands that
are observed in Figure 4a within 3800-3650 cm-1 can be attributed44-47 to five different types of -OH groups where
hydroxyl groups have distinctly different coordination geom-etries (i.e., linear/atop, bridging or 3-fold adsorption geomgeom-etries). Furthermore, nature of the surface -OH groups also present a variation depending on the coordination number (e.g., four, eight, and probably five) of the surface Al3+sites where the
hydroxyl is adsorbed.44-47 Along these lines, the negative
features in (Figure 4a) can be assigned as follows: the most prominent band at 3730 cm-1is assigned to hydroxyls that bind with a bridging configuration to two Al3+sites having octahedral
coordination (type IIa); the shoulder around 3690 cm-1 is assigned to hydroxyl groups that are bound to three octahedrally coordinated Al3+sites (type III) while the feature at 3795 cm-1
can be attributed to the presence of hydroxyls bound to a single octahedrally coordinated Al3+ site (type Ib). The remaining
couple of -OH bands that give rise to the features at 3775 and
3760 cm-1are associated with the terminal hydroxyl groups adsorbed on a single tetrahedrally coordinated Al3+ site that
can exist on two different crystallographic orientations (i.e., (111) and (110)) of the γ- Al2O3surface.44
The hydroxyl region of the IR spectra corresponding to the Ti/Al(P1) and Ti/Al(P2) samples can also be analyzed in detail to elucidate the nature of the adsorbed -OH groups. It is apparent in Figure 4b,c that the Ti/Al(P1) and Ti/Al(P2) samples also reveal negative vibrational features that are predominantly visible at 3730 and 3690 cm-1 that can be assigned to the presence of isolated type IIa and type III hydroxyls. In addition, comparison of the intensities of the negative peaks in Figure 4a with that of the negative features in Figure 4b,c indicates that these negative features are relatively less pronounced for the Ti/Al(P1) and Ti/Al(P2) samples, where Ti/Al(P2) seems to be the surface with the weakest negative hydroxyl features. These observations are in line with the fact that on the Ti/Al(P1) and Ti/Al(P2) surfaces, Al3+ sites are partially covered with
TiO2/TiOx domains that decrease the number of the isolated
-OH groups bound to the Al3+sites. These results are also in Figure 4. ν(OH) stretching region of the FTIR spectra corresponding
to the stepwise NO2adsorption at 323 K on (a) γ-Al2O3, (b) Ti/Al(P1),
and (c) Ti/Al(P2) surfaces. The spectrum corresponding to the NO2
-saturated surfaces are marked “S”.
very good agreement with the BET, XRD, Raman, and IR data presented above, indicating that the Ti/Al(P1) surface consists of relatively poorly dispersed TiO2 domains (with a larger
average domain size) that partially cover the underlying Al2O3
support surface, whereas the Ti/Al(P2) surface consists of well-dispersed TiO2/TiOxsites as well as exposed surface Al3+sites.
3.3. Thermal Behavior of the Adsorbed NOxSpecies on
Ti/Al Support Materials via TPD. Parts a and b of Figure 5
display the TPD profiles corresponding to the NOxdesorption
signals at m/z ) 30, 32, and 46 amu of the Ti/Al(P1) and Ti/ Al(P2) samples. TPD profiles of the pure γ-Al2O3and TiO2
(anatase) reference materials are also presented in Figure 5. The thermal evolution of the stored NOxspecies on the surface
of the pure γ-alumina (the bottommost TPD profiles given in Figure 5) reveals two different major desorption features.28The
first NOxdesorption feature is seen with a desorption maximum
at 389 K while the second major feature is observed at 625 K. The lower temperature feature at 389 K is related to the desorption of weakly bound N2O3and NO+species,34,35that desorb in the
form of NO2and NO + O2while the second desorption feature
at 625 K is associated with the desorption/decomposition of bridging and bidentate nitrates34,35 yielding a greater NO
2
desorption signal.
In the NOxdesorption profiles corresponding to the Ti/Al(P1)
system in Figure 5 in addition to the common features associated with the alumina surface, an additional strong feature at 780 K is observed that displays an asymmetric structure with a shoulder at∼900 K. It should be noted that in contrast to the reference
γ-Al2O3, it can be seen that the intensities of the desorption
signals at 389 and 625 K are considerably suppressed and the TPD profiles of the Ti/Al(P1) sample are dominated by a new and distinctly high-temperature feature at 780 K. These new desorption features in the TPD profiles of the Ti/Al(P1) sample at 780 K and at ∼900 K can be attributed mostly to the decomposition of the bidentate/bridged nitrates on the TiO2
domains of the Ti/Al(P1) surface. Furthermore, in agreement with the FTIR data for the Ti/Al(P1) system presented above, it is apparent that the presence of Ti4+adsorption sites associated
with the TiO2domains on the Ti/Al(P1) system (mostly in the
form of large crystallites on the alumina surface) brings about
an attenuation in the fraction of accessible Al3+surface sites
for NOxadsorption.
Considering the surface morphology of the Ti/Al(P1) sample, which is composed of mostly large TiO2domains, the feature
at 780 K can be associated with the nitrate decomposition on the isolated and large (bulk-like) TiO2 clusters whereas the
shoulder at ∼900 K can be attributed to the NOx desorption
from the less-abundant TiO2 domains more homogenously
distributed on the surface. These assignments are also consistent with the desorption characteristics of the pure TiO2(anatase
nanopowder with an average particle size of ca. 40 nm and a surface area of ca. 45 m2) and the Ti/Al(P2) samples presented
in Figure 5.
Focusing on the TPD data of the TiO2reference sample (the
topmost profiles given in Figure 5a,b), it can be seen that the NOxdesorption profile presents a weak shoulder at 460 K as
well as two strong and broad features located at 620 and 900 K. In the light of the FTIR results presented above and those reported in numerous former studies in the literature,39-42the
temperature range corresponding to the first and the second features at 460 and 620 K are attributed to the desorption of the monodentate nitrates with a relatively minor contribution from the weakly adsorbed molecular species whereas the feature at 900 K is assigned to the decomposition of the bridged/ bidentate nitrates, respectively. Furthermore, in contrast to the Ti/Al(P1) system, the feature at∼780 K is not clearly visible for the reference TiO2 sample. This can be explained by
considering the surface morphology of the pure TiO2sample,
which is probably composed of TiOx units that are strongly
interacting with each other in comparison with the TiO2domains
that are spread on the alumina surface of Ti/Al(P1) in a relatively isolated manner. Thus, it can be suggested that the existence of at least two different types of nitrate species with distinctively different thermal stabilities on the titania domains of the Ti/ Al(P1) sample seems to be closely associated with the morphol-ogy of the TiO2 crystallites. Nitrates on the surface of the
isolated (bulk-like) TiO2 clusters on the Ti/Al(P1) sample
decompose at lower temperatures such as 780 K, whereas the nitrates coordinated on the TiO2domains that are homogenously
distributed on the surface by forming well-dispersed TiOxunits
Figure 5. TPD profiles obtained after saturating Ti/Al(P1), Ti/Al(P2), γ-Al2O3, and TiO2surfaces with NO2at 323 K: (a) 30 and 32 amu signals;
decompose at higher temperatures (ca. 900 K). Both of these nitrate species decompose by releasing mostly NO. This interpretation is also consistent with the TPD profiles of the Ti/Al(P2) sample, presented in Figure 5a,b. TPD profiles of the Ti/Al(P2) sample reveal that the intensities of the nitrate desorption features associated with the Al3+ adsorption sites
located at 625 K are more visible for the Ti/Al(P2) sample in comparison with that of the Ti/Al(P1) system. Furthermore, the TPD profile for the Ti/Al(P2) material suggests that the intensity of the desorption feature at ∼900 K (that is ascribed to the presence of thermally stable nitrates on well-dispersed TiO2/
TiOxdomains) is significantly greater than the desorption signal
of the nitrates associated with the isolated (bulk-like) TiO2
clusters. On the basis of these observations as well as the FTIR and the BET data discussed above, it is apparent that the Ti/ Al(P2) sample exhibits a surface structure with a greater number of Ti4+ and Al3+ sites that are available for NO
xadsorption.
Considering the thermal evolution of the adsorbed NOxspecies,
the relative stabilities of the stored NOxspecies can be ranked
in the following increasing order: N2O3on Al3+or Al2O3sites
, nitrates on Al3+or Al
2O3sites< nitrates on isolated
(bulk-like) TiO2clusters with large particle sizes< nitrates on well
dispersed TiO2/TiOxdomains.
3.4. Thermal Evolution of the Ba/Ti/Al Ternary Oxide NOx Storage Materials: XRD and Raman Spectroscopy
Experiments. The XRD patterns of the 8(20)Ba/Ti/Al(P2)
samples with different Ba loadings are presented in Figure 6a,b, respectively. The XRD profiles corresponding to the as prepared and annealed 8(20)Ba/Ti/Al(P2) samples within 423-623 K reveal very broad diffraction features that are assigned to
γ-Al2O3(JCPDS 29-0063) and additional intense peaks due to
the crystalline Ba(NO3)2 (JCPDS 24-0053). In addition, the
20Ba/Ti/Al(P2) sample is characterized with considerably higher Ba(NO3)2crystallinity than that of the 20Ba/Ti/Al(P1) sample,27
which is also consistent with the relatively higher thermal stability of the Ba(NO3)2-related peaks for the 20Ba/Ti/Al(P2)
sample, which can exist on the surface even after annealing at 873 K. In line with the XRD data, Raman spectroscopic results
presented in the Supporting Information (Supporting Information Figure 3a,b) also indicate an analogous trend for the thermal decomposition temperatures of the Ba-nitrates on the 8(20)Ba/ Ti/Al(P2) systems.
A new set of reflection signals appear in the XRD patterns for the 8(20)Ba/Ti/Al(P2) samples after thermal treatment at 873 K (Figure 6a,b, marked with asterisk). These features are characterized with considerably higher intensities for the 20Ba/ Ti/Al(P2) sample (Figure 6b) having a higher Ba content and are attributed to the formation of a complex mixed oxide phase in the form of Ba1.23Al2.46Ti5.54O16(JCPDS 33-0133). In addition
to these features, minor diffraction peaks corresponding to BaAl2O4 (JCPDS 17-0306) are also detected at temperatures
above 873 K for the 8(20)BaTi/Al(P2) samples. It can be seen that the degree of crystallinity of the Ba1.23Al2.46Ti5.54O16phase
increases with increasing annealing temperature from 873 to 1073 K for the 20BaTi/Al(P2) sample (Figure 6b). On the other hand, the diffraction signals of this particular phase in the 8BaTi/ Al(P2) sample (Figure 6a) start to attenuate at high temperatures where they completely vanish at 1273 K. The XRD profile corresponding to the 8BaTi/Al(P2) sample at 1273 K is dominated by the strong reflections due to the formation of R-Al2O3(JCPDS 10-0173) and rutile (JCPDS 04-0551) with a
minor contribution from BaAl2O4. It should be mentioned that γ- to R-alumina phase transformation was not detected in the
XRD profile of the 20BaTi/Al(P2) sample at 1273 K. It is visible in Figure 6b that the XRD pattern of the 20BaTi/Al(P2) sample at 1273 K is dominated by the Ba1.23Al2.46Ti5.54O16, BaAl2O4
with a relatively minor contribution from rutile phase. Besides, an additional feature also exists in Figure 6 (marked with open squares) that is tentatively assigned to a TiO2phase (JCPDS
03-5088). These results, which are also consistent with the current Raman spectroscopic results given in the Supporting Information section Figure 3a,b, can be explained by a stronger interaction between the BaO and TiO2 components in the
20BaTi/Al(P2) system, which also hinders the phase transfor-mation of the anatase to rutile. This observation is also in very good agreement with the significantly higher reduction in the
Figure 6. Thermal behavior of the XRD profiles corresponding to the as-prepared Ba/Ti/Al(P2) materials and the Ba/Ti/Al(P2) samples annealed
at 423-1273 K in Ar(g): (a) 8Ba/Ti/Al(P2); (b) 20Ba/Ti/Al(P2).
surface area of the 8Ba/Ti/Al(P2) sample at 1273 K than that of the 20Ba/Ti/Al(P2) system (Table 2).
3.5. NOx Adsorption on Ba/Ti/Al Systems: FTIR
Spec-troscopy Experiments. Parts a and b of Figure 7 present the
series of IR spectra upon NO2(g) adsorption on the surface of
the 8Ba/Ti/Al(P1/P2) samples at 323 K. Similar results for the 20Ba/Ti/Al(P1/P2) samples are also given in Figure 8a,b, respectively.
The nature of the NOxspecies formed on the surface of the
BaO/γ-Al2O3 binary oxide system as a function of the Ba
loading has been studied extensively in the literature via FTIR
spectroscopy in a number of former reports.28,36,37,48-50On the
basis of these studies, the FTIR data presented in Figures 7 and 8 can be analyzed in detail.
The very initial NO2(g) uptake of the 8Ba/Ti/Al(P1) material
(the bottommost spectrum given in Figure 7a) results in the formation of a predominantly nitrite feature at 1225 cm-1and a shoulder at about 1185 cm-1. These signals were attributed to nitrites coordinated on the Ba2+and Ti4+ adsorption sites,
respectively.41,51Further NO
2(g) exposure leads to the oxidation
of the surface nitrite species into various nitrate species whose intensities increase with increasing surface NOx coverage.
Figure 7. FTIR spectra corresponding to the stepwise NO2adsorption at 323 K on (a) 8Ba/TiAl(P1) and (b) 8BaA/Ti/Al(P2) samples. The spectra
corresponding to the fully saturated sample surfaces are marked with “S” .
Figure 8. FTIR spectra corresponding to the stepwise NO2adsorption at 323 K on (a) 20Ba/TiAl(P1) and (b) 20BaA/Ti/Al(P2) samples. The
Evidence for the presence of two different types of nitrate species, namely, the surface (bidentate) nitrates that are associ-ated with a BaO monolayer (or oligomers) on the alumina support surface, and a bulk-like Ba(NO3)2species that form on
the BaO clusters has been reported in a previous series of studies.48,49It was found in these studies that the characteristic
features related to the presence of surface (bidentate) nitrates on the BaO sites appear at 1585, 1565, and∼1300 cm-1while bulk Ba-nitrates yield bands located at 1320, 1442, and 1483 cm-1. In addition, it was also reported that the FTIR intensity ratio of the surface to bulk nitrate species is a function of the BaO loading.48,49 The topmost spectrum in Figure 7a
corre-sponding to the fully saturated sample surface is characterized by adsorption bands due to the presence of the so-called bulk (ionic) Ba nitrates located at 1320, 1442, and 1483 cm-1and additional nitrates at 1583 and 1628 cm-1that are adsorbed on the TiO2 domains with bidentate and bridged configurations,
respectively. A comparative analysis of the IR spectra indicates that the nitrate-related features associated with the Ti4+
adsorp-tion sites on the 8Ba/Ti/Al(P1) sample are significantly sup-pressed in comparison with that of the Ti/Al(P1) support material (Figure 3a). Furthermore, nitrate species bound to alumina sites are hardly seen on the 8Ba/Ti/Al(P1) sample, indicating a smaller number of exposed alumina adsorption sites available. This observation is also in very good agreement with the presence of only a very minor feature at ∼1985 cm-1related to the weakly adsorbed N2O3or NO
+
on the exposed alumina sites.
From the FTIR data presented in Figure 7a, it can be seen that the intensities of the bands due to the formation of bulk Ba-nitrates are much more pronounced for the 8Ba/Ti/Al(P1) system while the IR signals related to the surface (bidentate) Ba-nitrates are significantly suppressed and are overlapping with the nitrate signals associated with the titania domains. These observations imply that BaO sites on the 8Ba/Ti/Al(P1) system exist mostly in the form of large BaO clusters and a relatively smaller amount of well-dispersed (BaO)xunits exists in the form
of “surface” Ba nitrates. Therefore, the agglomerated BaO clusters partially cover and block the accessible Ti4+and Al3+
surface sites for NOx adsorption, which is evident by the
significant attenuation of the signals due to the nitrates on the TiO2clusters and on the γ-alumina surface. These arguments
are also in good accordance with the TPD data discussed in section 3.6.
Comparison of the IR data corresponding to the stepwise NO2
(g) adsorption presented in Figure 7a,b indicates that the 8Ba/ Ti/Al(P2) sample (Figure 7b) displays significant discrepancies in the NOxuptake behavior with respect to the 8Ba/Ti/Al(P1)
system (Figure 7a). It is evident in Figure 7b that the very initial NO2(g) exposure on the surface of the 8Ba/Ti/Al(P2) sample
results in the appearance of adsorption band at 1221 cm-1with a shoulder at ∼1185 cm-1 due to the formation of bidentate nitrates and nitrites on the surface. Concomitant with the attenuation of the shoulder at 1185 cm-1, further NO2(g)
exposure leads to the appearance and growth of various types of nitrates coordinated to different adsorption sites. The spectrum of the fully saturated surface in Figure 7b (red spectrum, marked with “S”) consists of multiple vibrational bands with maxima that are characteristic of the bulk Ba-nitrates (at 1320, 1449, and 1483 cm-1), surface (bidentate) nitrates on the Ba2+sites
(1560, 1585, and∼1300 cm-1), bidentate and bridged nitrates on the TiO2domains (at 1583 and 1628 cm-1) and bidentate/
bridged nitrates on the Al3+adsorption sites (at 1294 and 1256
cm-1). In addition, the feature at ∼1985 cm-1 attributed to
weakly adsorbed N2O3/NO+ on the alumina domains is more
visible for the 8Ba/Ti/Al(P2) sample, as well.
In light of the data presented in Figure 7, it is apparent that NOxadsorption signals associated with the titania domains are
much more strongly pronounced for the 8Ba/Ti/Al(P2) sample in comparison with the 8Ba/Ti/Al(P1) system. Furthermore, in contrast to the 8Ba/Ti/Al(P1) sample, the ratio of the IR intensities of the bulk Ba-nitrate to surface Ba-nitrate signals is profoundly smaller for the 8Ba/Ti/Al(P2) surface (Figure 7b). In other words, a significantly greater amount of nitrates is stored on the 8Ba/Ti/Al(P2) surface, where they are adsorbed particu-larly on Ti4+and surface (BaO)
xunits. Apparently, the surface
distribution of the NOxstorage component (i.e., BaO) strongly
depends on the surface morphology of the TiO2domains. This
is in perfect agreement with one of our recent reports, indicating that surface TiO2domains provide very strong anchoring sites
for BaO domains by limiting their surface mobility.27 Most
likely, the presence of homogeneously distributed TiO2
crys-tallites on the Ti/Al(P2) support surface with a relatively smaller average size than that of the Ti/Al(P1) system dictates a morphology of the surface BaO domains that exists mostly in the form of well-dispersed BaO units directly interacting with the underlying Ti/Al(P2) support surface. In addition, it is worth mentioning that impregnation of the Ti/Al(P2) support material with the NOxstorage component (8 wt % BaO) has also brought
about an alteration in the distribution of the TiO2/TiOxdomains,
leaving bare Al3+ sites available for NO
xadsorption. This is
evident by the observed adsorption bands at 1294 and 1256 cm-1 ascribed to the nitrates on the exposed alumina sites on the 8Ba/ Ti/Al(P2) sample (Figure 7b), which are not that much visible in Figures 3b and 7a for the Ti/Al(P2) and 8Ba/Ti/Al(P1) samples, respectively. This argument is also consistent with the TPD data, presented below (section 3.6).
As can be seen in Figure 8, at a higher BaO surface coverage (i.e., 20 wt % BaO), the vibrational bands due to the formation of bulk Ba-nitrates at 1320, 1442, and∼1482 cm-1are strongly enhanced while the surface Ba-nitrate signals and the bidentate/ bridged nitrates on the TiO2domains (1636 and 1580 cm-1)
become weaker in terms of their IR intensities in comparison with those observed for the 8Ba/Ti/Al(P1/P2) samples (Figure 7a,b). This effect is particularly visible for the 20Ba/Ti/Al(P1) sample (Figure 8a), implying that the formation of bulk BaO domains mostly in the form of large crystallites that cover the large portion of the support surface and leave a small fraction of the titania or alumina sites free for NOxadsorption. Thus,
the origin of the differences in the NOx uptake properties of
the 8 and 20Ba/Ti/Al(P1) samples with respect to the 20Ba/Ti/ Al(P2) sample can be predominantly attributed to the formation of large and poorly dispersed bulk BaO clusters located on the agglomerated TiO2 domains of the 8 and 20Ba/Ti/Al(P1)
surfaces. Such a morphology change also results in a signifi-cantly lower surface area for the 8 and 20Ba/Ti/Al(P1) samples as compared to the 20Ba/Ti/Al(P2) case (Table 2).
3.6. Thermal Behavior of the Adsorbed NOxSpecies on
Ba/Ti/Al via TPD. TPD profiles of the 8Ba/Al and 20Ba/Al
samples with different Ba loadings upon NO2(g) adsorption at
323 K (Figures 9 and 10) can be readily analyzed on the basis of one of our former reports28 as well as other reports in the
literature.34,36,49-51It is visible in Figures 9 and 10 that the first
major desorption feature for the 8(20)Ba/Al samples appears at 389 K due to the decomposition of the N2O3/NO
+
species, which is followed by a desorption feature associated with the decomposition of the nitrates that reside on the exposed γ-Al2O3
sites (600-650 K). Next the decomposition of the surface
(bidentate) nitrates on the BaO monomers/dimers, which are strongly interacting with the support material (650-700 K), takes place by releasing mostly NO2. Finally, the decomposition
of the bulk nitrates takes place at T > 900 K), mostly in the form of NO + O2.28,34,36,49-51
TPD data for the 8(20)Ba/Al samples can be used as a useful benchmark for elucidating the TPD results obtained for the 8(20)Ba/Ti/Al(P1/P2) materials. It is evident that TPD profiles corresponding to the 8Ba/Ti/Al(P1) system (Figure 9a,b) have much closer resemblance to the TPD data of the 20Ba/Al sample (the bottommost profiles in Figure 10a,b) than that of the 8Ba/ Al system (Figure 9a,b). It can be seen that the NOxdesorption
profiles of the 8Ba/Ti/Al(P1) sample are dominated by an intense feature located at higher temperatures (ca. 930 K). In addition to this feature, an asymmetric lower desorption tail with a desorption maximum located at about 780 K was also detected. Despite the similarities between the desorption features of the 8Ba/Ti/Al(P1) and the 20Ba/Al samples, it is seen in Figure 9a
that the main desorption feature in the TPD data for the 8Ba/ Ti/Al(P1) sample (930 K) appears at a higher temperature than the major desorption feature for the 20Ba/Al sample given in Figure 10a (907 K). Furthermore, the asymmetric desorption feature for the 8Ba/Ti/Al(P1) at about 780 K is much more strongly pronounced for the 8Ba/Ti/Al(P1) sample than that of the 20Ba/Al case. Considering the surface morphology of the TiO2 and BaO domains on the surface of the 8Ba/Ti/Al(P1)
sample discussed in section 3.5, it can be suggested that the dominant feature at 930 K is due to the decomposition of the bulk Ba-nitrates on the large BaO clusters located on the surface of the agglomerated TiO2particles. On the other hand,
the low-temperature feature can be attributed to the convolution of signals originating from the decomposition of the nitrates on the TiO2crystallites (780 K) and the decomposition of the
surface (bidentate) nitrates on the Ba domains (650-700 K). TPD data of the 8Ba/Ti/Al(P2) system presented in Figure 9a,b (the topmost profiles) show significant differences with
Figure 9. TPD profiles obtained from 8Ba/Ti/Al(P1), 8Ba/Ti/Al(P2), γ-Al2O3, and 8Ba/Al samples that were initially saturated with NO2(g) at 323
K: (a) 30 and 32 amu signals; (b) 46 amu signal.
Figure 10. TPD profiles obtained from 20Ba/Ti/Al(P1), 20Ba/Ti/Al(P2), and 20Ba/Al samples that were initially saturated with NO2(g) at 323 K:
respect to the TPD data for the 8Ba/Ti/Al(P1) sample. In Figure 9a, it can be clearly seen that for the 8Ba/Ti/Al(P2) sample, the desorption feature at 930 K corresponding to the bulk nitrates on the BaO domains located on the surface of the TiO2
crystallites is significantly suppressed and the NOxdesorption
profiles are almost exclusively dominated by the signals related to the nitrates on the TiO2domains (ca. 780 K), the surface
(bidentate) nitrates on the BaO monomers/dimers strongly interacting with the support material (650-700 K), and the NOx
adsorbed species on the exposed sites of the γ-Al2O3(∼389 K
and 600-650 K). These results are in very good accord with the FTIR results for the NO2adsorption on the 8Ba/Ti/Al(P2)
surface (Figure 7b) given above. Thus, the argument regarding the existence of BaO domains mostly in the form of well-dispersed BaO units directly interacting with the underlying support Ti/Al(P2) surface can also be used for the interpretation of the TPD results.
The arguments regarding the surface morphology and the distribution of the TiO2and BaO domains on the 20Ba/Ti/Al(P1/
P2) sample surfaces can also be exploited to shed light on the TPD data presented in Figure 10.
Despite the observed resemblances of the NOx desorption
profiles of the Ti-containing 20Ba/Ti/Al(P1) sample with the 20Ba/Al system (particularly in terms of their line shapes), the positions and the intensities of the desorption maxima are noticeably different (Figure 10). It can be seen that the major desorption signals in the TPD profiles of the 20Ba/Ti/Al(P1) sample are shifted toward higher temperatures, yielding a desorption maximum at about 930 K. The relative thermal stabilization of the bulk Ba-nitrates and their decomposition at higher temperatures are most likely due to the stronger interaction between the bulk BaO domains and the underlying titania sites where large BaO clusters are immobilized on the TiO2/TiOx domains. In addition to this, it is seen that the
desorption feature at 700-780 K (associated with surface nitrates on BaO and nitrates on titania sites) appearing as an asymmetric tail in the TPD profile of the 20Ba/Ti/Al(P1) sample in Figure 10a is relatively more visible than that for the 20Ba/ Al system. Therefore, it is evident that the surface morphology of the BaO domains on the 20Ba/Al and the 20Ba/Ti/Al(P1) samples are dominated by large bulk-like BaO clusters. This explanation is also is in very good agreement with the current FTIR results (Figure 8) as well as the characteristically low BET surface area values of the 20Ba/Ti/Al(P1) sample (Table 2).
On the other hand, the TPD data given in Figure 10 for the 20Ba/Ti/Al(P2) sample reveal a different behavior where the most prominent desorption feature appears at 780 K. This major feature is also accompanied by a high-temperature desorption signal at 900-950 K and a low temperature asymmetric tail at 600-700 K. In accord with the current FTIR results for the 20Ba/Ti/Al(P2) sample (Figure 8), TPD data also indicate that the major NOx species (i.e., desorption feature at 780 K) is
associated with the nitrates that are bound to the surface of well dispersed small (BaO)xunits as well as to the nitrates bound to
the titania domains. The high temperature shoulder at 900-950 K can be attributed to relatively more stable nitrates in the form of bulk Ba(NO3)2 whereas the low temperature shoulder at
600-700 K can be associated with nitrates on alumina sites. It is also worth mentioning that the differences in the desorption characteristics of the 30 amu signal for the 20Ba/Ti/Al(P1) and 20Ba/Ti/Al(P2) samples are also in line with the significantly dissimilar 46 amu desorption signals for these two samples, emphasizing different decomposition and desorption pathways. Thus, TPD data are also in very good agreement with the
previously discussed results indicating that the 20Ba/Ti/Al(P2) sample presents a good example in which well-dispersed titania domains control the surface mobility and the dispersion of the BaO domains that are present on the Ba/Ti/Al ternary oxide system.
4. Conclusions
In the current work, it was demonstrated that the surface dispersion and the mobility of the BaO domains in a NOxstorage
material can be fine-tuned with the help of a well-dispersed underlying oxide domain (e.g., TiO2), which functions as a
strong anchoring site for the BaO units. We believe that current results are particularly relevant to the development of new strategies toward improving the sulfur tolerance of NOxstorage
materials, in which the growth of large BaSO4 domains are
inhibited and the facile recovery of the NSR catalyst can be achieved through the regeneration of small BaSO4clusters. The
main results of the current work can be summarized as follows: (a) An improved Ba surface dispersion was observed for the BaO/TiO2/Al2O3materials synthesized via the coprecipitation
of alkoxide precursors. Increased BaO dispersion was found to originate mostly from the increased fraction of accessible TiO2/
TiOxsites on the surface.
(b) The presence of TiO2(anatase) crystallites on the TiO2/
Al2O3 and BaO/TiO2/Al2O3 systems with different surface
morphologies significantly influences the nature of the formed NOxspecies by providing additional Ti4+NOxstorage sites that
are able to store NOxpredominantly in the form of bridged and
bidentate nitrates and also by altering the domain size of the BaO clusters.
(c) Two different types of NOxspecies were detected on the
titania sites, with distinctively different thermal stabilities. The relative thermal stabilities of the NOx species investigated in
the current study can be ranked in the following increasing order: NO+/N2O3on alumina , nitrates on alumina< surface nitrates
on BaO < bridged/bidentate nitrates on large/isolated TiO2
clusters< bulk nitrates on BaO on alumina surface and bridged/ bidentate nitrates on TiO2crystallites homogenously distributed
on the surface< bulk nitrates on the BaO sites located on the TiO2domains.
Acknowledgment. We gratefully acknowledge the support
from the Scientific and Technical Research Council of Turkey (TUBITAK) (Project Code: 108M379). This work was also partially supported by the European Union FP7 project called UNAM-REGPOT (Contract No: 203953). We also thank Prof. O. Dag and Assoc. Prof. M. Kantcheva for fruitful discussions and their help with the preparation of the binary oxide TiO2/
Al2O3support materials and Prof. Sefik Su¨zer and Dr. Evgeny
Vovk for the analysis of the XPS data. S.A. thanks Dr. Georgi V. Avdeev (Institute of Physical Chemistry, Bulgarian Academy of Sciences) for helpful discussions about the XRD data.
Supporting Information Available: Discussion and figures
of SEM images, XPS spectra, and Raman spectra. This material is available free of charge via the Internet at http://pubs.acs.org.
References and Notes
(1) “Emission Control Technologies and the Euro 5/6 Emission Legislation”, AECC, http://www.aecc.be/en/Publications/Publications.html.
(2) Matsumoto, S. Cattech 2000, 4, 102.
(3) Toyota Patent, European Patent Application no. 0573 672A1 (1992). (4) Takahashi, N.; Shinjoh, H.; Iijima, T.; Suzuki, T.; Yamazaki, K.; Yokota, K.; Suzuki, H.; Miyoshi, N.; Matsumoto, S.; Tanizawa, T.; Tanaka, T.; Tateishi, S.; Kasahara, K. Catal. Today 1996, 27, 63.