Contents lists available atScienceDirect
Journal of Materials Processing Tech.
journal homepage:www.elsevier.com/locate/jmatprotecMicrostructure e
ffects on process outputs in micro scale milling of heat
treated Ti6Al4V titanium alloys
Masoud Ahmadi
a,b, Yi
ğit Karpat
a,b,c,⁎, Ozgun Acar
d, Yunus Eren Kalay
daDepartment of Mechanical Engineering, Bilkent University, Ankara, Turkey bUNAM− Institute of Materials Science and Nanotechnology, Turkey cDepartment of Industrial Engineering, Bilkent University, Ankara, Turkey
dDepartment of Metallurgical and Materials Engineering, Middle East Technical University, Ankara, Turkey
A R T I C L E I N F O
Keywords: Micro milling Titanium alloys EBSD analysisA B S T R A C T
This study investigates the influence of materials’ microstructural characteristics, including grain size and phase fractions, in micro end milling of heat treated Ti6Al4V titanium alloys. Micro milling process conditions such as feed, depth of cut, and the cutting edge radius of the micro end mill are in the same order of magnitude as the grain size of the material, which gives rise to the anisotropic behavior of the multiphase materials and their deformation characteristics considering their grain size, grain boundaries, and phase fractions. A good under-standing of such relationships is believed to be instrumental in developing predictive models of machining based on computational techniques. The influence of micro milling process on the crystallographic texture and mi-crostructure of Ti6Al4V alloys is the subject of this study. For this purpose, heat treatment was performed on the Ti6Al4V samples to obtain two different microstructures: fine equiaxed and enlarged equiaxed microstructures. Micro milling experiments were performed on each sample and process outputs such as cutting forces, areal surface texture, built-up edge (BUE) formation, and alterations in the microstructure were investigated. Electron backscatter diffraction (EBSD) analysis was used to investigate the microstructure of the machined surfaces. It was observed that smaller grain size (bothα and β) and lower fraction of β phase in the material yielded higher cutting forces. BUE formation and its size were affected by the microstructure of the samples. The results of this study may be useful in developing microstructure-based, predictive modeling of micro milling process.
1. Introduction
Titanium alloys have many applications in industry owing to their excellent material properties such as high strength, corrosion re-sistance, and biocompatibility. The selection of process parameters during machining of titanium alloy is known to affect the surface tex-ture and microstructex-ture of the work material. The interplay between machining process parameters and the microstructure of polycrystalline dual phase materials such as titanium alloy Ti6Al4V requires detailed investigations. A better understanding of the relationship between material microstructure and its machinability will help develop pre-dictive machining models that reduce experimental work performed during the process design phase.
The effect of the work material’s microstructure on its machinability at macro/micro scales has been investigated in literature. Armendia et al. (2010)compared the machinability of two different titanium al-loys Ti6Al4V and Ti54M. These alal-loys have similar material properties, but Ti54M is known to have better machinability. The study’s results
show that the differences in microstructures are responsible for better machinability of Ti54M. The size of BUE formed while machining Ti54M was observed to be smaller which contributes to better ma-chinability, but the relationship between the microstructure and BUE formation was not investigated.Attanasio et al. (2013) conducted a detailed study on micro milling of titanium alloys with different mi-crostructures. They reported that fully lamellar microstructure resulted in better tool life.Sun et al. (2013)studied the effect of microstructure of Ti6Al4V alloy in high speed turning process. They presented the possibility that segmented chip formation would be higher for fully lamellar microstructure compared to bimodal microstructure. Abbasi et al. (2016)also reported that the lamellar microstructure obtained after heat treating of titanium alloy Ti6Al4V yielded better machin-ability when polycrystalline diamond cutting tools were used.Wu et al. (2016)investigated the effect of grain size and cutting edge radius in micro cutting a titanium alloy. It was shown that smaller grain size yielded higher cutting forces and specific cutting energy.Komatsu et al. (2012)showed that the smaller grain size of the material reduces burr
http://dx.doi.org/10.1016/j.jmatprotec.2017.09.042
Received 29 July 2017; Received in revised form 26 September 2017; Accepted 28 September 2017
⁎Corresponding author at: Bilkent University, Department of Industrial Engineering, Turkey.
E-mail address:[email protected](Y. Karpat).
Available online 29 September 2017
0924-0136/ © 2017 Elsevier B.V. All rights reserved.
formation.Deng et al. (2009)reported that grain refinement occurs due to large shear strains during high speed machining, which can be uti-lized to produce ultrafine grained material. Cedergren et al. (2013) analyzed machinability of three different microstructures of titanium alloy during orthogonal turning and reported that feed and work ma-terial microstructure directly affect chip formation.Nouari and Makich (2013)reported the influence of different microstructures in titanium alloys on tool wear. They reported the presence of intense deformation zone beneath the machined surface and hence subsurface texture modification using SEM-EDS analysis.
Electron backscatter diffraction (EBSD) is an advantageous tech-nique to perform microstructural analysis of the machined surfaces. This technique can generate information about the grain structure (size and distribution), grain boundary characteristics, crystallographic tex-ture, and phase distribution. Guo et al. (2011) analyzed surface de-formation and microstructure in macro orthogonal cutting of brass and copper using EBSD analysis. They discussed formation of various mi-crostructural changes including cellular and equiaxed grains as a result of different cutting speeds and shear strains. Velásquez et al. (2010) investigated the deformation layers created due to high speed ma-chining in Ti6Al4V using EBSD. Also using EBSD, Acharyya et al. (2012) reported grain fragmentation and work hardened layer as a result of machining of stainless steel.Crawforth et al. (2012)reported the microstructure damages caused by precision turning of a titanium alloy. They used EBSD analysis to show that the depth of subsurface deformation varies according to cutting speed.M'Saoubi et al. (2012) provided a comparison of cutting tool types and the subsequent
influence on the surface integrity of machined Inconel 718. They in-dicated the presence of recrystallized grains near the surfaces of the machined parts due to high speed turning experiments.
The number of studies investigating the interaction between mi-crostructure and micro scale machining are limited in the literature compared to macro scale machining.Imran et al. (2011)utilized TEM and EBSD for characterizing the micro drilled nickel superalloy and reported the formation of nanocrystalline grains.Smaga et al. (2015) used EBSD to investigate the microstructural changes in TRIP steel parts due to micro milling using.
A considerable amount of studies have also examined the influence of microstructure in predictive modeling of machining of titanium al-loys usingfinite element models.Zhang et al. (2014)developed a mi-crostructure-dependentflow stress model for two-phase titanium alloys. The material constitutive model captures the phase transformation and was integrated intofinite element software to simulate chip serration in high speed machining of titanium alloy. They noted the importance ofβ phase in process outputs. Using thefinite element method,Arısoy and Özel (2015) investigated the microstructure alterations during face turning of Ti6Al4V titanium alloy, and they showed that recrystalliza-tion occurred within the microstructure due to temperature rise and the imposed high strain. Pan and Liang (2017)also developed a micro-structural framework to model process and material parameters in or-thogonal cutting. They predicted dynamic recrystallization (DRX) via their proposed model for Ti6Al4V alloy.
In micro milling, process conditions are set such that feed, depth of cut and cutting edge radius of the micro end mill are in the same order
Fig. 1. (a) The typical shape and dimensions of the fabricated samples, (b) EDX spectra of the as-received Ti6Al4V alloy.
of magnitude as the grain size of the material. Therefore, the aniso-tropic behavior of the multiphase materials considering their grain size, grain boundaries, and phase fractions must be studied. A good under-standing of such relationships is believed to be instrumental in using computational techniques to develop predictive models of machining. The influence of the micro milling process on the crystallographic texture and microstructure of Ti6Al4V alloys using EBSD analysis is the subject of this study.
The paper is organized such that titanium alloy Ti6Al4V work ma-terial was heat treated to have two equiaxed microstructures with dif-ferent grain sizes, and the material properties are investigated in Section2. Micro milling tests were conducted on these work materials, and process outputs were investigated in Section3. A detailed analysis of unmachined and machined surfaces conducted using EBSD appear in Section4.
2. Preparation of different microstructures and determination of material properties
Samples were prepared with the dimensions of 20 mm × 20 mm × 5 mm by considering the appropriate size for micro-scale milling process and materials characterization methods. Fig. 1a illustrates the typical shape and dimensions of the fabricated sample. The composition of the as-received Ti6Al4V alloy is also de-monstrated inFig. 1b by utilizing EDX analysis, showing the nominal composition of this alloy.
In order to obtain different microstructure of Ti6Al4V alloy, the heat treatment was done according to the phase diagram of this alloy pro-posed byWelsch et al. (1993)as illustrated inFig. 2. Important phase diagram points are labeled as a, b, and c where“a” corresponds to β-transus temperature.Table 1contains sample numbers and labels along
Fig. 2. Phase diagram of dual phase Ti6Al4V alloy (Welsch et al., 1993).
Table 1
Sample labels and heat treatment information.
Sample number Sample label Holding Temperature (°C) Holding time (h) Cooling Type 1 S1 – – – 2 S2 925 4 Furnace
Fig. 3. Cross sectional optical micrographs of the resulting microstructures; (a) S1 (b) S2. Table 2
Average results of the image analysis.
Sample label Microstructure α grain size (μm) β grain size (μm) α phase fraction (%) β phase fraction (%) S1 Equiaxed + Elongated 4.9 1.6 84 16 S2 Equiaxed 9.6 2.3 78 22
with the employed heat treatment cycle. Sample 1 (S1) corresponds to the as-received sample and sample 2 (S2) corresponds to the heat treated sample.
For microstructural characterization, samples were cleaned using an ultrasonic cleaner, then ground and polished with diamond suspensions of 6 and 1μm on the nap cloth. The Kroll’s etchant consisting of 6 ml HNO3 + 2 ml HF + 92 ml distilled water was manipulated to etch the surface of the samples with the holding time of 15 s. A laser scanning microscope (Keyence VKX-100) was used to obtain optical micrographs of the specimens’ microstructure. The optical micrographs of the re-sulting cross sectional microstructures are presented inFig. 3. In these images,β phase is seen dark regions whereas α phase is seen as light regions. The as-received sample (S1) exhibited mostly equiaxed grains accompanied by elongated grains (Fig. 3a,) and the heat treated sample (S2) consisted of almost fully equiaxed grains (Fig. 3b) attained by sufficient annealing time leading to α grain growth in α+β region of
Ti6Al4V phase diagram.
The image analysis of the micrographs was performed using MIP and ImageJ software (Schneider et al., 2012). The goal of this image analysis was to estimate the grain size, grain morphology, and volume fraction of each phase for samples S1 and S2. The images were analyzed according to ASTM E-112-96 standard including interception analysis using 50 horizontal and vertical lines in the grid matrix of the optical micrographs. The average quantitative information was summarized in Table 2, which indicates that S2 contains largerα and β grains com-pared to S1. In addition, a higher fraction ofβ phase was attained for S2 compared to S1. Thesefindings help interpret the deformation behavior and response of each sample to micro milling process.
Vickers micro hardness testing (Zwick/Roell ZHVμ) was also con-ducted on the samples with loads of 50 g and 500 g. Loads were applied for 10 s.Fig. 4 shows the average results of Vickers micro hardness evaluations corresponding to two different loads. For both applied
Fig. 5. Representation of indent marks onα and β phases.
loads, the hardness of S2 was found to be higher than that of S1. Al-though the grain size of S1 was lower than that of S2, owing to higher fraction ofβ phase, a higher hardness was obtained for S2. Additional indentation tests were conducted with load of 10 g to obtain the hardness of each phase of S2 as shown inFig. 5. The indent mark onβ phase is observed to be smaller and less penetrated than that on α phase, giving the hardness of 590 HV forβ and 512 HV for α which are in good agreement with the literature (Ankem et al. 2006; Neti et al. 1991). Consequently, the noticed hardness difference between S1 and S2 is mostly ascribed to difference in β fractions which were shown already inTable 2.
In order to explain the observed difference in hardness values in α (HCP) andβ (BCC) phases, spot energy dispersive X-ray (EDX) analysis was carried out locally on each phase of S2 as presented inFig. 6where α and β phases are indicated in the SEM image. The extent of aluminum and vanadium peaks are observed to be different for α and β phases. EDX output ofβ phase exposed a higher amount of vanadium and a lower amount of aluminum compared to that of α phase. Aluminum and vanadium are known as stabilizing alloy elements for α and β phases, respectively (Cotton et al., 2015). These results demonstrate that the higher hardness value ofβ phase is probably due to accumu-lation of vanadium and other elements.
3. Micro milling experiments and process outputs
The setup of micro milling experiments is shown inFig. 7. Experi-ments were performed on a micro machining center (Mikrotools DT110). The process parameters for micro milling tests were kept the same for machining each sample, and they were set as follows: 28000 rpm spindle speed (35 m/min cutting speed), 30μm depth of cut, 1.5μm/rev feed per tooth, 0.4 mm tool diameter with two teeth (NS Tools MSE 0.4). Slots of 10 mm length were machined. A new micro end mill was used in each test. Kistler mini dynamometer (Type 9256) with its charge amplifier was used to measure cutting forces during micro milling experiments.
3.1. Micro milling forces
Fig. 8a shows the recorded machining forces for the duration of the cut. The force component in x direction is measured to be larger than y and z directions.Fig. 8b shows the variation of peak-to-valley forces for each force component. The larger force variation in x direction was measured for S1, which contains smaller grain size andβ phase frac-tion.
By comparing hardness values given inFig. 4, and measured forces in Fig. 8, one can notice an inverse relationship between forces and hardness values. Lower forces were acquired for S2, which exhibited a higher hardness value. As shown in Fig. 3 and Table 2, the micro-structure of S1 consisted offine equiaxed and elongated grains, whereas S2 exhibited enlarged equiaxed microstructure. Consequently, due to thefiner grain size in S1 (both α and β grains), there were more ob-stacles for dislocation motions including grain boundaries than what was seen for S2. Again, it must be noted that milling conditions are selected such that feed is less than the grain size and depth of cut and grain size of the material are comparably sized.
Deformation behavior of a metallic sample is not solely affected by hardness value or yield strength as demonstrated by Ankem et al. (2006).Sergueeva et al. (2001)andDieter and Bacon (1986)also re-ported that the ductility and toughness of thefine grain size micro-structure are normally higher than what is seen in large grain size microstructure resulting in more strain hardening. Jun et al. (2016) demonstrated that the higher fraction ofβ phase reduces the ductility and toughness of Ti6Al4V alloy in small scale deformations. Thus, since S2 contained fraction ofβ phase fraction in comparison with S1, its lower ductility and toughness led to lower micro milling forces as shown inFig. 7b. Jiang (2015)indicated the annealing treatment of Ti6Al4V under high temperatures can increase the hardness of the sample, however, it reduces the ductility. Therefore, the differences in grain size, grain morphology and phase fraction affect the mechanical properties of titanium alloy, especially ductility and toughness, which can be the main factors responsible for the observed force variations in micro milling experiments. Another important consideration on the machining forces is the condition of the cutting edge, which is in-vestigated in the next section.
3.2. Built-up edge (BUE) formation
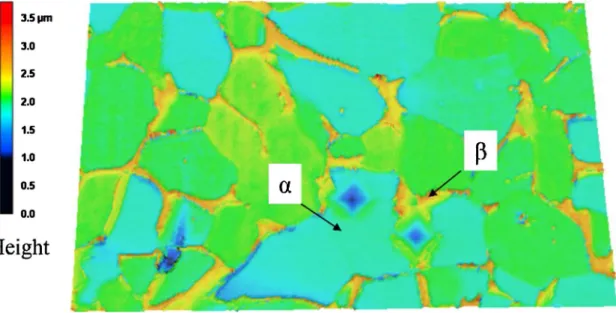
The condition of the cutting edges of the end mills is another im-portant factor in micro milling forces. It is imim-portant to note how the microstructure affects the machinability of the work material.Fig. 9 represents the scanning electron microscopy (SEM) images of the cut-ting edges of the micro end mills after the experiments with two magnifications. Tools are also labeled based on the corresponding machined sample label. For instance, T1 refers to the tool used for micro milling of S1. Images inFig. 9indicate the formation of built-up edge (BUE) accumulated on the rake face of all the micro milling tools where BUE formation is essentially different in shape and amount. These images also show some damage to the tool coating for at least one edge of the cutting tool. The presence of serrated microchips adhered to the rake face of the tools can be noted inFig. 9a and c. Sample S1 with lower hardness and smaller grain size resulted in more BUE on the tool (T1). Larger BUE formation was observed in S1, which probably con-tributed to larger machining forces compared to S2.Oliaei and Karpat (2017)showed that the presence of BUE can increase the cutting forces significantly, yet a stable BUE may act like a protective layer during machining.
3.3. Surface roughness
This section discusses the surface roughness analysis of the ma-chined surfaces after micro milling experiments. Three-dimensional topographies of the machined surfaces obtained using a laser scanning
microscope (Keyence VK-X100) are given in Fig. 10. The recorded images were analyzed based on ISO 25178 using MontainsMap ver7 software.
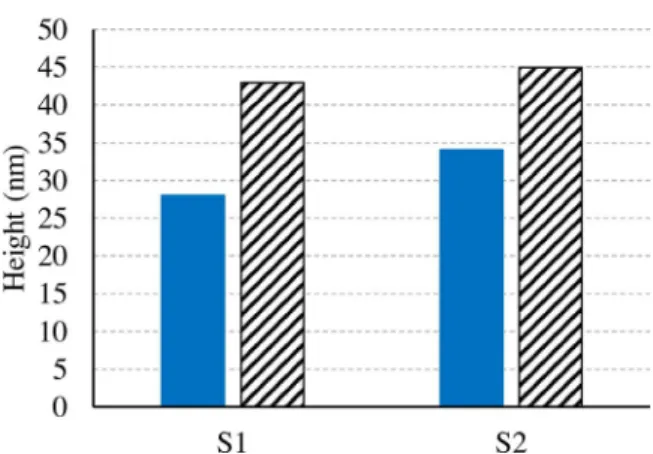
The roughness parameters of the surfaces are given inFig. 11, where Sq represents root mean square and Sa represents average areal surface roughness values. The results imply that surface roughness values are
close to each other, but the surface roughness of S2 is slightly greater than S1. Considering that the same machining parameters were used in both experiments, it is expected to have similar surface roughness va-lues. The influence of larger BUE on T1 does not seem to affect the surface compared to smaller BUE on T2. Long term machining experi-ments would reveal more reliable information on the surface roughness
Fig. 8. (a) Micro milling force measurements (S1 up; S2 down), (b) Peak-to-valley force variations for each sample.
Fig. 9. SEM images of the micro milling tools rake faces exhibiting BUE; (a) T1 Edge1, (b) T1 Edge2, (c) T2 Edge1, (d) T2 Edge2.
as shown inOliaei and Karpat (2016).
4. EBSD analysis
Electron backscatter diffraction (EBSD) is a useful technique to ex-amine the crystallographic behavior of the group of grains within a material that has undergone a manufacturing process. EBSD technique and orientation imaging microscopy (OIM) were used to examine the micro milling induced microstructure alterations on the machined surface. EBSD also allows for accurate determination of grain size and phase fractions/distributions to investigate the texture behavior of the machined samples. EBSD analysis was conducted both on unmachined and machined surfaces of the samples. Both up milling and down
milling directions corresponding to the same uncut chip thickness were considered.Fig. 12illustrates the micro milling process along with a summary of EBSD results obtained from each region sized 50μm × 50 μm. The machined surfaces were prepared by electro-polishing method using a chemical solution containing 60% methanol + 34% butoxyethanol + 6% perchloric acid with voltage of 60 V holding for 15 s at room temperature. In EBSD analysis, 25 kV accel-erating voltage, 10 mm working distance and 0.12μm step size were applied.
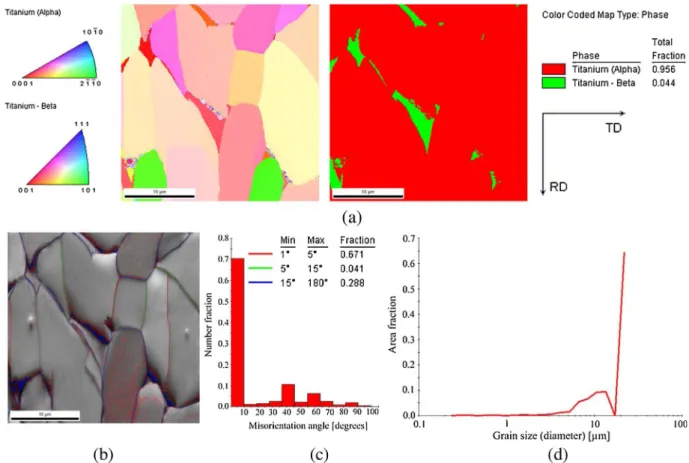
Initial EBSD analysis was conducted on the unmachined surface of sample S1. The orientation color maps, grain size distribution, and misorientation angle variation are demonstrated inFig. 13. The results in Fig. 13a imply that the unmachined S1 contained fine equiaxed
grains accompanied by elongated grains toward the rolling direction (RD) of the sample. The fraction ofα and β phases were determined as 97.3% and 2.7%, respectively. These results, which are calculated from a smaller area, differ from those calculated with images analysis in Table 2. EBSD results for areas corresponding to down milling and up milling direction of the machined S1 are given inFigs. 14 and 15, re-spectively.
The orientation and shapes of bothα and β grains were affected by micro milling experiments. Figs.13a,14a, and15a reveal that after
performing micro milling, the α grains tended to orient and expand toward transverse direction (TD) while they were mostly aligned to rolling direction (RD) in unmachined S1. Furthermore, β grains got smaller in size and became more fragmented and scattered, giving lower fraction within the microstructure as a result of micro milling. The grain size distributions are presented in Figs.13d,14d and15d. The 8.1μm average grain size of unmachined S1 declined to 7.5 μm and 7.7μm for down milled and up milled regions, respectively. The elon-gated grains observed on the unmachined surface are slightly reduced in size and assume more equiaxed shapes after micro milling for both down milled and up milled regions. Compared to Figs.13c,14c and15 c present an increase in high angle grain boundaries (HAGBs) which are considered boundary angles between 15° and 180° (Humphreys and Hatherly (2012)). Misorientation angles were increased after per-forming micro milling. The percentage of HAGBs on unmachined S1 increased from 16% to 31.9% and 22.9% for down milled and up milled regions, respectively. The down milling region seems to be more af-fected by the micro milling compared to the up milling area.
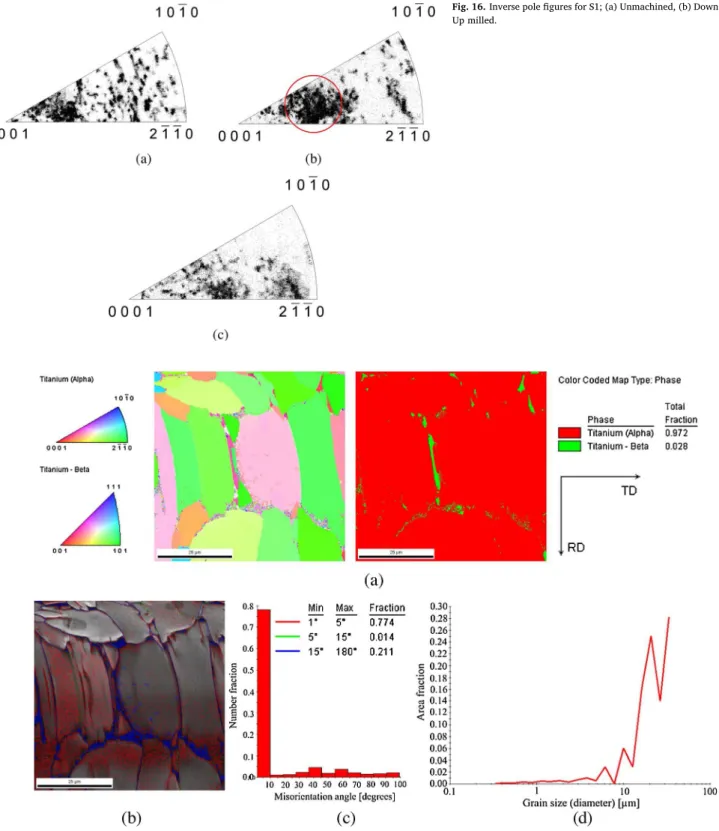
Another observation in the EBSD results is the crystallographic texture of the grains. Considering inverse polefigures of unmachined (Fig. 16a), down milled (Fig. 16b) and up milled (Fig. 16c) regions, the grains textured to a favorable orientation about 25° to [0001] direction designated by a red circle. On the other hand, for the up milling region, the resulting texture approaching mostly to [2110] orientation and distributed in the intermediate directions between [0001] and [2110]. Furthermore, inverse polefigure associated with the down milling re-gion shown in Fig. 16b is highly analogous to that attained for the forged (compressed) titanium parts reported byKocks et al. (2000),
Fig. 11. Areal surface roughness parameters of the machined surfaces.
Fig. 12. Schematic illustration of micro milling process including the machined channel and the re-gions selected for EBSD analysis designated by numbered square boxes.
which implies that the material experienced higher compression in the down milling region compared to the up milling region. Based on the obtained inverse polefigures, the dominant deformation mechanism for the down milled area was mainly associated with activated basal slip systems of HCP titanium. However, for the up milling region, it was the combination of basal and prismatic slip systems as shown in Bridier et al. (2005). Based on the obtained OIM images, no deformation by twinning was observed. According to Dillamore and Roberts (1965), deformation by twinning is highly dependent on existing phases and mode of deformation to satisfy the condition of twin formation. Tensile rather than compressive stresses are required to form twins in HCP metals.
EBSD results of the unmachined surface of S2, down milling, and up milling regions are presented inFigs. 17–19, respectively. For the un-machined surface of S2, a larger area (60μm × 60 μm) was selected to observe more number of grains before conducting micro milling ex-periments.
As Figs.17a,18a and19a depict, the fraction ofβ phase obtained 2.8%, 4.4% and 2.3% which are generally higher than values found for S1. In contrast to S1, theβ grains detected were larger and less scattered in the machined sample S2. This result also supports the role of smaller β grains which resulted in higher cutting forces for S1. β grains mostly oriented to the favorable [001] direction for the down milled area, and intermediate direction between [111] and [101] for up milled region designated by red and blue colors by unit triangle in Figs.18a and19a, respectively. In addition, the average grain size of 18.8μm of un-machined S2, changed to 16.8μm and 18.4 μm for down milling and up milling regions, respectively. Comparing Figs.18c and19c, one can notice that for both cases, the low angle grain boundaries (LAGBs), i.e. the boundary angles between 1° and 15°, were dominant. While the fraction of HAGBs were observed to be more for the down milled area,
similar to the obtained results associated with machined S1. Based on the inverse polefigure shown inFig. 20, the texture of the grains ac-quired for down milling region of S2 (Fig. 20b), is more focused in a specific orientation and is highly analogous to the textures on S1, in-dicating that deformation modes had the same influence during down milling of both the studied samples. Moreover, similar to S1, for the up milling area of S2 (Fig. 20c), a more diverse texture was also observed. The results show that S1 experienced more microstructural changes than S2 during micro scale milling.
Based on the EBSD results obtained for S1, after performing micro milling experiments, the evidence denotes the highly possible occur-rence of dynamic recrystallization (DRX) on the microstructure of machined surfaces.Mamedov and Lazoglu (2016)andThepsonthi and Özel (2016)reported that localized temperatures can rise up to 700 °C at the tool-workpiece interface during micro milling of Ti6Al4V. Con-sidering the low thermal conductivity of the titanium alloy, tempera-tures at the cutting zone may reach 0.1–0.5Tm (Tm is the melting temperature), which is the temperature interval for occurrence of DRX (Estrin and Vinogradov, 2013). The temperature rise accompanied by a relatively high strain rate during micro milling may increase dislocation density and formation of subsequent cellular structure within the mi-crostructure in recovery stage. This stage is followed by dynamic re-crystallization (DRX) phenomenon resulting in grain refinement within the microstructure (Humphreys and Hatherly, 2012). Such small new grains are designated in Figs.14a and15a. Fragmentation of elongated grains accompanied by reduction of average grain size after micro milling of S1, the procedure of grain refinements by DRX seems to have occurred. Further supporting evidence for this comes in the rise of HAGBs fraction on micro milled samples. In S2, a slight increase in HAGBs fraction was observed for down milling stage; however, no such grain refinement appeared in this sample. HAGBs were mostly revealed
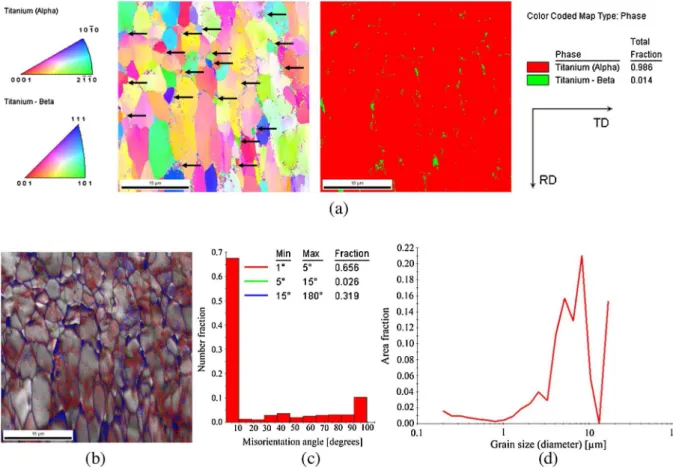
Fig. 14. EBSD results of the down milled S1; (a) orientation color maps (the arrows designate examples of new grains created by DRX), (b) grain boundaries map, (c) misorientation angle variation, (d) corresponding grain size distribution.
Fig. 15. EBSD results of the up milled S1; (a) orientation color maps (the arrows designate examples of new grains created by DRX), (b) grain boundaries map, (c) misorientation angle variation, (d) corresponding grain size distribution.
for β grains after micro milling of S2. Therefore, the applied micro milling condition in this study produced no detectable dynamic re-crystallization (DRX) within the machined surface of S2. This might be attributed to the large initial grain size and high fraction ofβ as the second phase. Also, in case of S1, the microstructure also consisted of elongated grains which became fragmented and refined after micro milling. Whereas in case of S2, the microstructure of the sample was fully equiaxed. Based on the work of Huang and Logé (2016), larger initial grain size leads to reduction of recrystallization kinetics, which may explain the lack of not observed DRX in S2.
In this paper, a foundation was laid to correlate the microstructural features (grain size and phase fraction/distribution) and micro milling outputs of Ti6Al4V titanium alloy. The influence of micro milling process on the microstructure and crystallographic texture of the ma-chined samples was thoroughly investigated using EBSD analysis. The findings can be used in predictive modeling of machining considering microstructural effects. It should be mentioned that, Ti6Al4V alloy exhibits various states of phase distributions, grain size, and grain morphologies depending on the work material history. Only equiaxed and elongated grain types with regular phase distributions within the
Fig. 16. Inverse polefigures for S1; (a) Unmachined, (b) Down milled, (c) Up milled.
Fig. 18. EBSD results of the down milled S2; (a) orientation color maps, (b) grain boundaries map, (c) misorientation angle variation, (d) corresponding grain size distribution.
microstructure of Ti6Al4V were considered in this study. The number of investigations must be increased in order to gain further understanding.
5. Conclusions
In this study, by using various processing and characterization techniques including heat treatment, micro hardness evaluations, image analysis, scanning electron microscopy and EBSD analysis, the interrelationship between microstructural parameters and micro mil-ling outputs of Ti6Al4V alloy were investigated. The conclusions can be summarized as follows:
•
Differences in mechanical properties associated with different grain size and phase fractions within the microstructures affected the deformation behavior of the samples during micro milling.•
Smaller grain size (bothα and β) and lower β phase fraction led to higher cutting force in micro milling. Although the hardness of the sample containing enlarged equiaxed grains was found to be higher due to greaterβ phase fraction, it experienced a lower cutting force as a result of its lower ductility.•
Microstructures of the samples significantly affected the built-up edge (BUE) formation in terms of shape and size. Lower grain size resulted in more BUE, which may have contributed to the increase in cutting forces.•
EBSD results revealed that micro milling experiments affected the microstructure of the machined samples. Dynamic recrystallization (DRX) occurred in thefine grain equiaxed sample.•
EBSD investigation indicated that up milling and down milling can result in different textures within the machined surface.•
In the micro milling experiment, a more compressive deformation occurred in the down milling stage compared to the up milling.•
Surface roughness was slightly better forfine grain equiaxed sample. The hindering influence of large BUE size was not observed.Acknowledgement
The authors would like to thank the Ministry of Development of Turkey (HAMIT-Micro System Design and Manufacturing Research Centre) for thefinancial support.
References
Abbasi, S.A., Feng, P., Ma, Y., Zhang, J., Yu, D., Wu, Z., 2016. Influence of microstructure and hardness on machinability of heat-treated titanium alloy Ti-6Al-4V in end milling with polycrystalline diamond tools. Int. J. Adv. Manuf. Technol. 86, 1393–1405. Acharyya, S., Khandelwal, A., Kain, V., Kumar, A., Samajdar, I., 2012. Surface working of
304L stainless steel: impact on microstructure, electrochemical behavior and SCC resistance. Mater. Charact. 72, 68–76.
Ankem, S., Margolin, H., Greene, C.A., Neuberger, B.W., Oberson, P.G., 2006. Mechanical properties of alloys consisting of two ductile phases. Prog. Mater. Sci. 51, 632–709. Arısoy, Y.M., Özel, T., 2015. Prediction of machining induced microstructure in Ti-6Al-4ıV alloy using 3-D FE-based simulations: effects of tool micro-geometry, coating and cutting conditions. J. Mater. Process. Technol. 220, 1–26.
Armendia, M., Garay, A., Iriarte, L.-M., Arrazola, P.-J., 2010. Comparison of the ma-chinabilities of Ti6Al4V and TIMETAL®54 M using uncoated WC-Co tools. J. Mater. Process. Technol. 210, 197–203.
Attanasio, A., Gelfi, M., Pola, A., Ceretti, E., Giardini, C., 2013. Influence of material microstructures in micromilling of Ti6Al4V alloy. Materials 6, 4268–4283. Bridier, F., Villechaise, P., Mendez, J., 2005. Analysis of the different slip systems
acti-vated by tension in aα/β titanium alloy in relation with local crystallographic or-ientation. Acta Mater. 53, 555–567.
Cedergren, S., Petti, G., Sjöberg, G., 2013. On the influence of work material micro-structure on chip formation, cutting forces and acoustic emission when machining Ti-6Al-4V. Procedia CIRP 12, 55–60.
Cotton, J.D., Briggs, R.D., Boyer, R.R., Tamirisakandala, S., Russo, P., Shchetnikov, N., Fanning, J.C., 2015. State of the art in beta titanium alloys for airframe applications. Jom 67, 1281–1303.
Crawforth, P., Wynne, B., Turner, S., Jackson, M., 2012. Subsurface deformation during precision turning of a near-alpha titanium alloy. Scr. Mater. 67, 842–845. Deng, W., Xia, W., Li, C., Tang, Y., 2009. Formation of ultra-fine grained materials by
machining and the characteristics of the deformationfields. J. Mater. Process. Technol. 209, 4521–4526.
Dieter, G.E., Bacon, D.J., 1986. Mechanical Metallurgy. McGraw-hill, New York. Dillamore, I., Roberts, W., 1965. Preferred orientation in wrought and annealed metals.
Metall. Rev. 10, 271–380.
Estrin, Y., Vinogradov, A., 2013. Extreme grain refinement by severe plastic deformation: a wealth of challenging science. Acta Mater. 61, 782–817.
Guo, Y., M'Saoubi, R., Chandrasekar, S., 2011. Control of deformation levels on machined surfaces. CIRP Ann.-Manuf. Technol. 60, 137–140.
Huang, K., Logé, R., 2016. A review of dynamic recrystallization phenomena in metallic materials. Mater. Design 111, 548–574.
Humphreys, F.J., Hatherly, M., 2012. Recrystallization and Related Annealing Phenomena. Elsevier.
Imran, M., Mativenga, P.T., Gholinia, A., Withers, P.J., 2011. Evaluation of surface in-tegrity in micro drilling process for nickel-based superalloy. Int. J. Adv. Manuf. Technol. 55, 465–476.
Jiang, C.-P., 2015. The effect of initial grain size on the mechanical properties and de-formability of titanium alloy in a direct extrusion process. Int. J. Precis. Eng. Manuf. 16, 301–307.
Jun, T.-S., Sernicola, G., Dunne, F.P., Britton, T.B., 2016. Local deformation mechanisms of two-phase Ti alloy. Mater. Sci. Eng. A 649, 39–47.
Kocks, U.F., Tomé, C.N., Wenk, H.-R., 2000. Texture and Anisotropy: Preferred Fig. 20. Inverse polefigures for S2; (a) Unmachined, (b) Down milled, (c) Up milled.
Orientations in Polycrystals and Their Effect on Materials Properties. Cambridge University Press.
Komatsu, T., Yoshino, T., Matsumura, T., Torizuka, S., 2012. Effect of crystal grain size in stainless steel on cutting process in micromilling. Procedia Cirp 1, 150–155. M'Saoubi, R., Larsson, T., Outeiro, J., Guo, Y., Suslov, S., Saldana, C., Chandrasekar, S.,
2012. Surface integrity analysis of machined Inconel 718 over multiple length scales. CIRP Ann.-Manuf. Technol. 61, 99–102.
Mamedov, A., Lazoglu, I., 2016. Thermal analysis of micro milling titanium alloy Ti-6Al-4V. J. Mater. Process. Technol. 229, 659–667.
Neti, S., Vijayshankar, M., Ankem, S., 1991. Finite element method modeling of de-formation behavior of two-phase materials part II: stress and strain distributions. Mater. Sci. Eng. A 145, 55–64.
Nouari, M., Makich, H., 2013. Experimental investigation on the effect of the material microstructure on tool wear when machining hard titanium alloys: 6Al-4V and Ti-555. Int. J. Refract. Met. Hard Mater. 41, 259–269.
Oliaei, S.N.B., Karpat, Y., 2016. Investigating the influence of built-up edge on forces and surface roughness in micro scale orthogonal machining of titanium alloy Ti6Al4V. J. Mater. Process. Technol. 235, 28–40.
Oliaei, S.N.B., Karpat, Y., 2017. Built-up edge effects on process outputs of titanium alloy micro milling. Precis. Eng. 49, 305–315.
Pan, Z., Liang, S.Y., 2017. Material driven machining process modeling. Manuf. Lett. Schneider, C.A., Rasband, W.S., Eliceiri, K.W., 2012. NIH Image to ImageJ: 25 years of
image analysis. Nat. Methods 9, 671–675.
Sergueeva, A., Stolyarov, V., Valiev, R., Mukherjee, A., 2001. Advanced mechanical properties of pure titanium with ultrafine grained structure. Scr. Mater. 45, 747–752. Smaga, M., Beck, T., Arrabiyeh, P., Reichenbach, I., Kirsch, B., Aurich, J., 2015.
Characterization of micro machined surface from TRIP/TWIP steels. MATEC Web of Conferences. EDP Sciences.
Sun, S.J., Brandt, M., Mo, J., 2013. Effect of microstructure on cutting force and chip formation during machining of Ti-6Al-4V alloy, Advanced Materials Research. Trans. Tech Publ. 2437–2441.
Thepsonthi, T., Özel, T., 2016. Simulation of serrated chip formation in micro-milling of titanium alloy Ti-6Al-4V using 2D elasto-viscoplasticfinite element modeling. Prod. Eng. 10, 575–586.
Velásquez, J.P., Tidu, A., Bolle, B., Chevrier, P., Fundenberger, J.-J., 2010. Sub-surface and surface analysis of high speed machined Ti-6Al-4V alloy. Mater. Sci. Eng. A 527, 2572–2578.
Welsch, G., Boyer, R., Collings, E., 1993. Materials properties handbook: titanium alloys. ASM International.
Wu, X., Li, L., He, N., Yao, C., Zhao, M., 2016. Influence of the cutting edge radius and the material grain size on the cutting force in micro cutting. Precis. Eng. 45, 359–364. Zhang, X., Shivpuri, R., Srivastava, A., 2014. Role of phase transformation in chip seg-mentation during high speed machining of dual phase titanium alloys. J. Mater. Process. Technol. 214, 3048–3066.