Great ape genetic diversity and population history
Javier Prado-Martinez1,*, Peter H. Sudmant2,*, Jeffrey M. Kidd3,4, Heng Li5, Joanna L.
Kelley4, Belen Lorente-Galdos1, Krishna R. Veeramah6, August E. Woerner6, Timothy D.
O’Connor2, Gabriel Santpere1, Alexander Cagan7, Christoph Theunert7, Ferran Casals1,
Hafid Laayouni1, Kasper Munch8, Asger Hobolth8, Anders E. Halager8, Maika Malig2,
Jessica Hernandez-Rodriguez1, Irene Hernando-Herraez1, Kay Prüfer7, Marc Pybus1,
Laurel Johnstone6, Michael Lachmann7, Can Alkan9, Dorina Twigg3, Natalia Petit1, Carl
Baker2, Fereydoun Hormozdiari2, Marcos Fernandez-Callejo1, Marc Dabad1, Michael L.
Wilson10, Laurie Stevison11, Cristina Camprubí12, Tiago Carvalho1, Aurora
Ruiz-Herrera12,13, Laura Vives2, Marta Mele1, Teresa Abello14, Ivanela Kondova15, Ronald E.
Bontrop15, Anne Pusey16, Felix Lankester17,18, John A. Kiyang17, Richard A. Bergl19,
Elizabeth Lonsdorf20, Simon Myers21, Mario Ventura22, Pascal Gagneux23, David Comas1,
Hans Siegismund24, Julie Blanc25, Lidia Agueda-Calpena25, Marta Gut25, Lucinda Fulton26,
Sarah A. Tishkoff27, James C. Mullikin28, Richard K. Wilson26, Ivo G. Gut25, Mary Katherine
Gonder29, Oliver A. Ryder30, Beatrice H. Hahn31, Arcadi Navarro1,32,33, Joshua M. Akey2,
Jaume Bertranpetit1, David Reich5, Thomas Mailund8, Mikkel H. Schierup8,34, Christina
Hvilsom24,35, Aida M. Andrés7, Jeffrey D. Wall11, Carlos D. Bustamante4, Michael F.
Hammer6, Evan E. Eichler2,36,+, and Tomas Marques-Bonet1,33,+
1Institut de Biologia Evolutiva, (CSIC-Universitat Pompeu Fabra), PRBB, 08003 Barcelona, Spain 2Department of Genome Sciences, University of Washington, Seattle, Washington, USA
3Department of Human Genetics, University of Michigan, Ann Arbor, MI, USA 4Department of
Genetics, Stanford University, Stanford, CA, USA 5Department of Genetics, Harvard Medical
School, Boston, Massachusetts, USA 6Arizona Research Laboratories, Division of Biotechnology,
University of Arizona, Tucson, Arizona, USA 7Department of Evolutionary Genetics, Max Planck
Institute for Evolutionary Anthropology, 04103 Leipzig, Germany 8Bioinformatics Research
Centre, Aarhus University, DK-8000 Aarhus C, Denmark 9Bilkent University, Ankara, Turkey 10Department of Anthropology, University of Minnesota, Minneapolis, MN 55455, USA 11Institute
for Human Genetics, University of California San Francisco, San Francisco, California, USA
12Departament de Biologia Cellular, Fisiologia i Immunologia, Universitat Autònoma de
Barcelona, 08193 Cerdanyola del Vallès, Spain 13Institut de Biotecnologia i de Biomedicina.
Universitat Autònoma de Barcelona, 08193 Cerdanyola del Vallès, Spain 14Parc Zoològic de
Barcelona, 08003 Barcelona, Spain 15Biomedical Primate Research Centre, P.O. Box 3306, 2280
+Corresponding authors: Tomas Marques-Bonet, Institut de Biologia Evolutiva, (UPF-CSIC), Pl. Charles Darwin 1, 08003 Barcelona,
Spain, Tel.: +34 933 160 887, [email protected]. Evan E Eichler, Department of Genome Sciences, Howard Hughes Medical Institute, University of Washington, Seattle, Washington, USA, [email protected].
*Equal contribution.
The authors declare no competing financial interests.
AUTHOR CONTRIBUTIONS
EEE and TM-B designed the study. JP-M, PHS, JMK, JLK, BL-G, MD, MF-C, JCM, CDB, EEE, and TM-B analyzed the raw data and performed the variant calling. JP-M, PHS, MM, JHG, IH, CB, LV, AR-H, and CC validated the different variants. JP-M, PHS, BL-G, CA, FH, EEE, and TM-B analyzed large variants. KV, AW, and MH analyzed the X/Autosome diversity. DT, GS, AC, CT, FC, HL, KP, MP, ML, NP, DC, JB, AN, and AMA performed selection analyses. JP-M, PHS, TDO, HL, DR, KM, AH, AEH, MHS, CH, JMA, TM, CDB, EEE, and TM-B analyzed different aspects of demography. MLW, LS, TA, IK, RWP, AP, FL, JK, EL, HS,
NIH Public Access
Author Manuscript
Nature
. Author manuscript; available in PMC 2014 January 25.Published in final edited form as:
Nature. 2013 July 25; 499(7459): . doi:10.1038/nature12228.
NIH-PA Author Manuscript
NIH-PA Author Manuscript
GH, Rijswijk, The Netherlands 16Department of Evolutionary Anthropology, Duke University,
Durham, NC 27708, USA 17Limbe Wildlife Centre, Limbe, Cameroon 18Paul G. Allen School for
Global Animal Health, Washington State University, WA 99164, USA 19North Carolina Zoological
Park. Asheboro, NC 27205. USA 20Department of Psychology, Franklin and Marshall College,
Lancaster, PA 17604, USA 21Department of Statistics, Oxford University, 1 South Parks Road,
Oxford OX1 3TG, UK 22Department of Genetics and Microbiology, University of Bari, Italy 23Department of Cellular and Molecular Medicine, University of California San Diego, CA, USA 24Department of Biology, Bioinformatics, University of Copenhagen, Denmark 25Centro Nacional
de Análisis Genómico (CNAG), 08028 Barcelona, Spain 26Genome Sequencing Center,
Washington University School of Medicine, St Louis, MO 63108, USA 27Department of Biology
and Genetics. University of Pennsylvania, Philadelphia, USA 28NISC, US NIH, Bethesda,
Maryland, USA 29Biological Sciences, University at Albany, State University of New York, Albany,
NY 12222, USA 30San Diego Zoo Institute for Conservation Research, San Diego Zoo Global,
San Diego, CA, USA 31Departments of Medicine and Microbiology, Perelman School of Medicine,
University of Pennsylvania, Philadelphia, USA 32Instituto Nacional de Bioinformatica, UPF,
Barcelona, Spain 33Institució Catalana de Recerca i Estudis Avançats (ICREA). 08010,
Barcelona, Spain 34Department of Bioscience, Aarhus University, DK-8000 Aarhus C, Denmark 35Copenhagen Zoo, DK 2000 Frederiksberg, Denmark 36Howard Hughes Medical Institute,
Seattle, Washington, USA
Summary
Most great ape genetic variation remains uncharacterized1,2; however, its study is critical for understanding population history3–6, recombination7, selection8, and susceptibility to disease9,10. Here, we sequence to high coverage a total of 79 wild- and captive-born individuals representing all six great ape species and seven subspecies and report ~88.8 million single nucleotide polymorphisms. Our analysis provides support for genetically distinct populations within each species, novel signals of gene flow, and the split of common chimpanzees into two distinct groups: Nigeria-Cameroon/Western and Central/Eastern populations. We find extensive inbreeding in almost all wild populations with Eastern gorillas being the most extreme. Inferred effective population sizes have varied radically over time in different lineages and this appears to have a profound effect on the genetic diversity at or close to genes in almost all species. We comprehensively discover and assign 1,982 loss-of-function variants throughout the human and great ape lineages, determining that the rate of gene loss has not been different in the human branch compared to other internal branches in the great ape phylogeny. This comprehensive catalog of great ape genome diversity provides a framework for understanding evolution and a resource for more effective management of wild and captive great ape populations.
We sequenced great ape genomes to a mean of 25-fold coverage per individual (Table 1, Supplementary Note, Table S1) sampling natural diversity by selecting captive individuals of known wild-born origin as well as individuals from protected areas in Africa (Figure 1a). We also included nine human genomes—three African and six non-African individuals11. Variants were called using the software package GATK12 (Methods), applying several quality filters, including conservative allele balance filters, and requiring that genomes showed <2% contamination between samples (Methods and Supplementary Note). In order to assess the quality of single nucleotide variant (SNV) calls, we performed three sets of independent validation experiments with concordance rates ranging from 86%–99% depending on allele frequency, the great ape population analyzed, and the species reference genome used (Supplementary Note, Table S2). In total, we discovered ~84.0 million fixed substitutions and ~88.8 million segregating sites of high quality (Table 1, Table S3)
NIH-PA Author Manuscript
NIH-PA Author Manuscript
providing the most comprehensive catalog of great ape genetic diversity to date. From these variants we also constructed a list of potentially ancestry-informative markers (AIMs) for each of the surveyed populations, although a larger sampling of some subspecies is still required (Supplementary Note).
We initially explored the genetic relationships between individuals by constructing neighbor-joining phylogenetic trees from both autosomal and mitochondrial genomes (Supplementary Note). The autosomal tree identified separate monophyletic groupings for each species/subspecies designation (Suppl. Figure 8.5.1) and supports a split of extant chimpanzees into two groups. Nigeria-Cameroon and Western chimpanzees form a monophyletic clade (>97% of all autosomal trees) while Central and Eastern chimpanzees form a second group (72% of all autosomal trees).
Genome-wide patterns of heterozygosity (Figure 1b) reveal a threefold range in single nucleotide polymorphism (SNP) diversity. Non-African humans, Eastern lowland gorillas, bonobos, and Western chimpanzees show the lowest genetic diversity (~0.8 x 10⁻³ heterozygotes/bp). In contrast, Central chimpanzees, Western lowland gorillas, and both orangutan species show the greatest (1.6–2.4 x 10⁻³ heterozygotes/bp). These differences are also reflected by measures of inbreeding from runs of homozygosity13 (Figure 1c, Supplementary Note). Bonobos and Western lowland gorillas, for example, have similar distributions of tracts of homozygosity as human populations that have experienced strong genetic bottlenecks (Karitiana and Papuan). Eastern lowland gorillas appear to represent the most inbred population, with evidence that they have been subjected to both recent and ancient inbreeding.
To examine the level of genetic differentiation between individuals we performed a
principal component analysis (PCA) of SNP genotypes (Supplementary Note). Chimpanzees were stratified between subspecies with PC1 separating Western and Nigeria-Cameroon chimpanzees from the Eastern and Central chimpanzees and PC2 separating Western and Nigeria-Cameroon chimpanzees. In gorillas, PC1 clearly separates Eastern and Western gorillas while the Western lowland gorillas are distributed along a gradient of PC2, with individuals from the Congo and Western Cameroon positioning in opposite directions along the axis. The isolated Cross River gorilla is genetically more similar to Cameroon Western lowland gorillas and can be clearly differentiated with PC3 (Suppl. Figure 8.2.9).
We explored the level of shared ancestry among individuals within each group14 using an admixture model (FRAPPE). In chimpanzees, the four known subspecies are clearly distinguished when fitting the model using four ancestry components (K=4) (Figure 1d). Additional substructure is identified among the Eastern chimpanzees Vincent and Andromeda (K=6), who hail from the most Eastern sample site (Gombe National Park, Tanzania). As in Gonder et al2 we have identified three Nigeria-Cameroon samples (Julie, Tobi and Banyo, K=3–5) with components of Central chimpanzee ancestry. However, taking Central chimpanzees and the remaining Nigeria-Cameroon chimpanzees as ancestral populations shows no evidence of gene flow by either the F3 statistic or HapMix. This suggests these three samples are not the result of a recent admixture and may represent a genetically distinct population (Supplementary Note).
In gorillas, following the separation of Eastern and Western lowland species (K=2), an increasing number of components further subdivide Western lowland populations
distinguishing Congolese and Cameroonian gorillas—a pattern consistent with the structure observed in the PCA analysis (Suppl. Figure 8.2.9). One striking observation is the extent of admixed ancestry predicted for captive individuals when compared to wild-born. Our analysis suggests that most captive individuals included in this study are admixed from two
NIH-PA Author Manuscript
NIH-PA Author Manuscript
or more genetically distinct wild-born populations leading to an erosion of phylogeographic signal. This finding is consistent with microsatellite analyses of captive gorillas15 and the fact that great ape breeding programs have not been managed at the subspecies level. As great apes have been evolving on separate lineages since the middle Miocene, we attempted to reconstruct the history of these various species and subspecies by applying methods sensitive to branching processes, changes in effective population size (Ne), and
gene flow occurring at different time scales. Using a combination of speciation times inferred from a haploid pairwise sequential Markovian coalescent (PSMC) analysis16, a coalescent hidden Markov model (CoalHMM)3, and incomplete lineage sorting approaches, we were able to estimate the most ancient split times and effective population sizes among the great ape species. By combining these estimates with an approximate Bayesian computation (ABC)17 analysis applied to the more complex chimpanzee phylogeny, we constructed a composite model of great ape population history over the last ~15 million years (Figure 2). This model presents a complete overview of great ape divergence and speciation events in the context of historical effective population sizes.
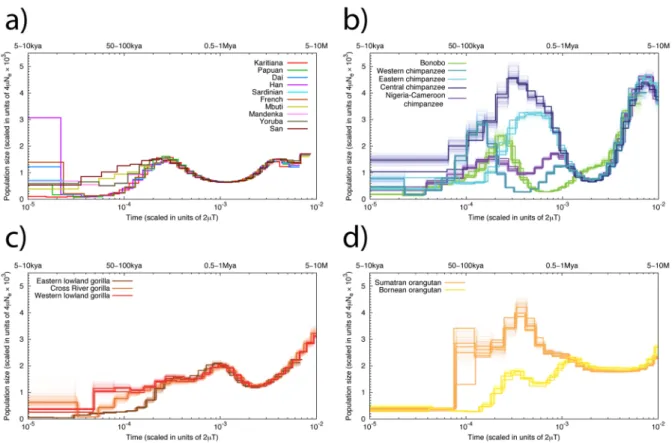
PSMC analyses of historical Ne (Figure 3) suggests that the ancestral Pan lineage had the
largest effective population size of all lineages >3 million years ago (Mya), after which the ancestral bonobo-chimpanzee population experienced a dramatic decline. Both PSMC and ABC analyses support a model of subsequent increase in chimpanzee Ne starting ~1 Mya,
prior to their divergence into separate subspecies. Following an Eastern chimpanzee increase in Ne (~500 thousand years ago, kya), the Central chimpanzees reached their zenith ~200–
300 kya followed by the Western chimpanzee ~150 kya. Although the PSMC profiles of the two subspecies within each of the major chimpanzee clades (Eastern/Central and Nigeria-Cameroon/Western) closely shadow each other between 100 kya and 1 Mya, the Western chimpanzee PSMC profile is notable for its initial separation from that of the other chimpanzees, followed by its sudden rise and decline (Supplementary Note, Figure 3). The different gorilla species also show variable demographic histories over the past ~200 ky. Eastern lowland gorillas have the smallest historical Ne, consistent with smaller present-day
populations and a history of inbreeding (Figure 1c). A comparison of effective population sizes with the ratio of non-synonymous to synonymous substitutions finds that selection has acted more efficiently in populations wit higher Ne, consistent with neutral theory
(Supplementary Note).
Although the phylogeny of bonobos and Western, Central and Eastern common chimpanzees has been well established based on genetic data18, there is still uncertainty regarding their relationship to Nigeria-Cameroon chimpanzees2,19. Regional neighbor-joining trees and a maximum-likelihood tree estimated from allele frequencies both show that Nigeria-Cameroon and Western chimpanzees form a clade. A complex demographic history has been previously reported for chimpanzees with evidence of asymmetrical gene flow among different subspecies. For instance, Hey4 identified migration from Western into Eastern chimpanzees, two subspecies that are currently geographically isolated. We find support for this using the D-statistic, a model-free approach that tests whether unequal levels of allele sharing between an outgroup and two populations that have more recently diverged (D(H,W;E,C)>16SD). However, no previous genome-wide analysis that has examined gene flow included chimpanzees from the Nigeria-Cameroon subspecies and a comparison of them with Eastern chimpanzees results in a highly significant D-statistic
(D(H,E;W,N)>25SD). Furthermore, TreeMix, a model-based approach that identifies gene flow events to explain allele frequency patterns not captured by a simple branching phylogeny, infers a signal of gene flow between Nigeria-Cameroon and Eastern chimpanzees (p=2x10300). A more detailed treatment of gene flow applying different models and methods may be found in the Supplementary Note.
NIH-PA Author Manuscript
NIH-PA Author Manuscript
Genetic diversity is depressed at or close to genes in almost all species (Suppl. Fig 11.1) with the effect less pronounced in subspecies with lower estimated Ne, consistent with
population genetic theory. When we compare the relative level of X chromosome and autosomal (X/A) diversity across great apes as a function of genetic distance from genes, the Eastern lowland gorillas and Bornean orangutans are outliers, with substantially reduced X/ A diversity compared to the neutral expectation of 0.75, regardless of the distance to genes. This pattern is consistent with a recent reduction in effective population size20, clearly visible in the PSMC analysis for both species (Figure 3). However, bonobos also
demonstrate a relatively constant level of X/A diversity regardless of distance from genes, with values very much in line with neutral expectations. All other subspecies demonstrate a pattern consistent with previous studies in humans21 where X/A diversity is lower than 0.75 close to genes and higher farther away from genes.
It has been hypothesized that loss of gene function may represent a common evolutionary mechanism to facilitate adaptation to changes in an environment22. There has been speculation that the success of humans may have, in part, been catalyzed by an excess of beneficial loss-of-function mutations23. We, thus, characterized the distribution of fixed loss-of-function mutations among different species of great apes identifying nonsense and frameshift mutations resulting from SNVs (n=806) and indels (n=1080) in addition to gene deletion events (n=96) (Table S4). We assigned these events to the phylogeny and
determined that the number of fixed loss-of-function mutations scales proportionally to the estimated branch lengths (R2=0.987 SNVs, R2=0.998 indels). In addition, we found no evidence of distortion on the terminal branches of the tree compared to point mutations based on a maximum likelihood analysis (Supplementary Note). Thus, the human branch in particular showed no excess of fixed loss-of-function mutations even after accounting for human-specific pseudogenes24 (Supplementary Note).
Our analysis provides one of the first genome-wide views of the major patterns of
evolutionary diversification among great apes. We have generated the most comprehensive catalogue of SNPs for chimpanzees (27.2 million), bonobos (9.0 million), gorillas (19.2 million), and orangutans (24.3 million)(Table 1) to date and identified several thousand AIMs, which provides a useful resource for future analyses of ape populations. Humans, Western chimpanzees, and Eastern gorillas all show a remarkable dearth of genetic diversity when compared to other great apes. It is striking, for example, that sequencing of 79 great ape genomes identifies more than double the number of SNPs obtained from the recent sequencing of more than a thousand diverse humans25—a reflection of the unique out-of-Africa origin and nested phylogeny of our species.
We provide strong genetic support for distinct populations and subpopulations of great apes with evidence of additional substructure. The common chimpanzee shows the greatest population stratification when compared to all other lineages with multiple lines of evidence supporting two major groups: the Western and Nigeria-Cameroon and the Central and Eastern chimpanzees. The PSMC analysis indicates a temporal order to changes in ancestral effective population sizes over the last two million years, previous to which the Pan genus suffered a dramatic population collapse. Eastern chimpanzee populations reached their maximum size first, followed by the Central and Western chimpanzee. The Nigerian chimpanzee population size appears much more constant.
Despite their rich evolutionary history, great apes have experienced drastic declines in suitable habitat in recent years26, along with declines in local population sizes of up to 75%27. These observations highlight the urgency to sample from wild ape populations to more fully understand reservoirs of genetic diversity across the range of each species and to illuminate how basic demographic processes have affected it. The ~80 million SNPs we
NIH-PA Author Manuscript
NIH-PA Author Manuscript
identified in this study may now be used to characterize patterns of genetic differentiation among great apes in sanctuaries and zoos and, thus, are of great importance for the conservation of these endangered species with regard to their original range. These efforts will greatly enhance conservation planning and management of apes by providing important information on how to maintain genetic diversity in wild populations for future generations.
METHODS Summary
We sequenced to a mean coverage of 25X (Illumina HiSeq 2000) a total of 79 great ape individuals, representing 10 subspecies and four genera of great apes from a variety of populations across the African continent and Southeast Asia. SNPs were called using GATK12 after BWA28 mapping to the human genome (NCBI Build 36) using relaxed mapping parameters. Samples combined by species were realigned around putative indels. SNP calling was then performed on the combined individuals for each species. For indels, we used the GATK Unified Genotyper to produce an initial set of indel candidates applying several quality filters and removing variants overlapping segmental duplications and tandem repeats. We also removed groups of indels clustering within 10 bp to eliminate possible artifacts in problematic regions. Conservative allelic imbalance filters were used to eliminate false heterozygotes that may affect demographic analyses, some of which are sensitive to low levels of contamination. We estimate that the application of this filter resulted in a 14% false negative rate for heterozygotes. Our multispecies study design facilitated this
assessment of contamination, which may remain undetected in studies focused on assessing diversity within a single species. The amount of cross-species contamination was estimated from the amount of non-endogenous mitochondrial sequence present in an individual. Because we wished to compare patterns of variation between and within species, we report all variants with respect to coordinates of the human genome reference. For FRAPPE analyses, we used MAF0.06 (human, orangutan, and bonobo) and 0.05 (chimpanzee and gorilla) to remove singletons. For most of the analyses, we only used autosomal markers, except in the X/A analysis. To determine the amount of inbreeding, we calculated the heterozygosity genome-wide in windows of 1 Mbp with 200 kbp sliding windows. We then clustered together the neighboring regions to account for runs of homozygosity. For the PSMC analyses, we called the consensus bases using SAMtools29. Underlying raw sequence data is available through the SRA (PRJNA189439/SRP018689). Data generated in this work are available from http://biologiaevolutiva.org/greatape/. A complete description of the material and methods is provided in the Supplementary Note.
Supplementary Material
Refer to Web version on PubMed Central for supplementary material.
Acknowledgments
We thank the following funding agencies: ERC Starting Grant (260372) to T.M.-B.; NIH grants HG002385 to E.E.E., R01_HG005226 to K.R.V., A.E.W., M.F.H., L.S. and J.D.W., GM100233 and NSF HOMINID grant 1032255 to D.R. and He.Li.; MICINN (Spain) BFU2011-28549 to T.M.-B., BFU2010-19443 to Ja.Be., Spanish Government and FEDER for grants BFU2009-13409-C02-02 and BFU2012-38236 to A.N. and J.P.-M., Direcció General de Recerca, Generalitat de Catalunya (Grup de Recerca Consolidat 2009 SGR 1101) to Ja.Be., D.C., A.N. and T.M.-B.; ERC Advanced Grant (233297) and Max Planck Society to S. Paabo; Danish Council for Independent Research Natural Sciences to H.S.; Spanish Grant (CGL-2010-20170) and Zoo de Barcelona (Beca PRIC) to A.R.-H.; EUPRIM-Net to BPRC; DP1ES022577-04 NIH grant to S.A.T.; NSF Grant 0755823 to M.K.G.; P.G. is supported by the G. Harold and Leila Y. Mathers Foundation. A.N. and T.M.-B. are ICREA Research Investigators (Institut Catala d’Estudis i Recerca Avancats de la Generalitat de Catalunya). J.P.-M. is supported by the Zoo de Barcelona and l’Ajuntament de Barcelona. P.H.S. is supported by an HHMI International Student Fellowship. E.E.E. is an investigator with the Howard Hughes Medical Institute. We are especially grateful to all those who generously provided the samples for the project: O. Thalmann and H. Siedel from Limbe Sanctuary; R. Garriga from Tacugama Sanctuary; W. Schempp (University of Freiburg), Burgers' Zoo; Zoo of Antwerp; Wilhelma Zoo;
NIH-PA Author Manuscript
NIH-PA Author Manuscript
Givskud Zoo; Ngamba Island Chimpanzee Sanctuary and Centre de Primatologie; Centre International de Recherches Médicales de Franceville; North Carolina Zoological Park; Zoo Atlanta; the Lincoln Park Zoo (Chicago); the Antwerp Zoo and the Limbe Wildlife Centre (Cameroon); D. Travis from University of Minnesota and M. Kinsel from University of Illinois Urbana-Champaign and S. Paabo and L. Vigilant, Max Planck Institute for Evolutionary Anthropology. We thank T. Brown for revising the manuscript, L. Capilla and E. Eyras for technical support, and M. Dierssen for comments on genes expressed in the brain.
We are especially grateful to all those who generously provided the samples for the project: O. Thalmann and H. Siedel from Limbe Sanctuary; Rosa Garriga from Tacugama Sanctuary; Professor Dr. Werner Schempp (University of Freiburg), Burgers’ Zoo; Zoo of Antwerp; Wilhelma Zoo; Givskud Zoo; Ngamba Island Chimpanzee Sanctuary and Centre de Primatologie; Centre International de Recherches Médicales de Franceville; North Carolina Zoological Park; Zoo Atlanta, the Lincoln Park Zoo (Chicago); the Antwerp Zoo and the Limbe Wildlife Centre (Cameroon); Dominic Travis from University of Minnesota and Michael Kinsel from University of Illinois Urbana-Champaign and Dr. Svante Paabo, Max Planck Institute for Evolutionary Anthropology. Finally, we thank Tonia Brown for revising the manuscript, Laia Capilla and Eduardo Eyras for technical support, and Mara Dierssen for comments on genes expressed in the brain.
References
1. Gonder MK, et al. A new west African chimpanzee subspecies? Nature. 1997; 388:337. [PubMed: 9237749]
2. Gonder MK, et al. Evidence from Cameroon reveals differences in the genetic structure and histories of chimpanzee populations. PNAS. 2011; 108:4766–4771. [PubMed: 21368170] 3. Hobolth A, Christensen OF, Mailund T, Schierup MH. Genomic Relationships and Speciation
Times of Human, Chimpanzee, and Gorilla Inferred from a Coalescent Hidden Markov Model. PLoS Genetics. 2007; 3:11.
4. Hey J. The divergence of chimpanzee species and subspecies as revealed in multipopulation isolation-with-migration analyses. Molecular biology and evolution. 2010; 27:921–33. [PubMed: 19955478]
5. Becquet C, Przeworski M. A new approach to estimate parameters of speciation models with application to apes. 2007:1505–1519.10.1101/gr.6409707
6. Mailund T, et al. A New Isolation with Migration Model along Complete Genomes Infers Very Different Divergence Processes among Closely Related Great Ape Species. PLoS genetics. 2012; 8:e1003125. [PubMed: 23284294]
7. Coop G, Przeworski M. An evolutionary view of human recombination. Nature reviews Genetics. 2007; 8:23–34.
8. Bustamante CD, et al. Natural selection on protein-coding genes in the human genome. Nature. 2005; 437:1153–7. [PubMed: 16237444]
9. Hahn BH. AIDS as a Zoonosis: Scientific and Public Health Implications. Science. 2000; 287:607– 614. [PubMed: 10649986]
10. Keele BF, et al. Chimpanzee reservoirs of pandemic and nonpandemic HIV-1. Science. 2006; 313:523–6. [PubMed: 16728595]
11. Meyer M, et al. A high-coverage genome sequence from an archaic Denisovan individual. Science. 2012; 338:222–6. [PubMed: 22936568]
12. DePristo M, et al. A framework for variation discovery and genotyping using next-generation DNA sequencing data. Nature genetics. 2011; 43:491–8. [PubMed: 21478889]
13. Pemberton TJ, et al. Genomic patterns of homozygosity in worldwide human populations. American journal of human genetics. 2012; 91:275–92. [PubMed: 22883143]
14. Tang H, Peng J, Wang P, Risch NJ. Estimation of individual admixture: Analytical and study design considerations. Genetic epidemiology. 2005; 28:289–301. [PubMed: 15712363] 15. Nsubuga AM, Holzman J, Chemnick LG, Ryder OA. The cryptic genetic structure of the North
American captive gorilla population. Conservation Genetics. 2010; 11:161–172.
16. Li H, Durbin R. Inference of human population history from individual whole-genome sequences. Nature. 2011; 475:493–6. [PubMed: 21753753]
17. Beaumont MA, Zhang W, Balding DJ. Approximate Bayesian Computation in Population Genetics. Genetics. 2002; 162:2025–2035. [PubMed: 12524368]
NIH-PA Author Manuscript
NIH-PA Author Manuscript
18. Morin PA, et al. Kin selection, social structure, gene flow, and the evolution of chimpanzees. Science. 1994; 265:1193–1201. [PubMed: 7915048]
19. Bjork A, Liu W, Wertheim JO, Hahn BH, Worobey M. Evolutionary History of Chimpanzees Inferred from Complete Mitochondrial Genomes. Molecular Biology. 2011; 28:615–623. 20. Pool JE, Nielsen R. Population size changes reshape genomic patterns of diversity. Evolution:
International Journal of Organic Evolution. 2007; 61:3001–3006. [PubMed: 17971168] 21. Hammer MF, et al. The ratio of human X chromosome to autosome diversity is positively
correlated with genetic distance from genes. Nature genetics. 2010; 42:830–1. [PubMed: 20802480]
22. Olson MV, Varki A. Sequencing the chimpanzee genome: insights into human evolution and disease. Nature reviews Genetics. 2003; 4:20–8.
23. Olson M. V When less is more: gene loss as an engine of evolutionary change. American Journal of Human Genetics. 1999; 64:18–23. [PubMed: 9915938]
24. Wang X, Grus WE, Zhang J. Gene losses during human origins. PLoS biology. 2006; 4:e52. [PubMed: 16464126]
25. Consortium T. 1000 G. P. A map of human genome variation from population-scale sequencing. Nature. 2010; 467:1061–1073. [PubMed: 20981092]
26. Junker J, et al. Recent decline in suitable environmental conditions for African great apes. Diversity and Distributions. 2012; 18:1077–1091.
27. Campbell G, Kuehl H, N’Goran Kouamé P, Boesch C. Alarming decline of West African chimpanzees in Côte d’Ivoire. Current Biology. 2008; 18:R903–R904. [PubMed: 18957231] 28. Li H, Durbin R. Fast and accurate short read alignment with Burrows-Wheeler transform.
Bioinformatics. 2009; 25:1754–60. [PubMed: 19451168]
29. Li H, et al. The Sequence Alignment/Map format and SAMtools. Bioinformatics. 2009; 25:2078– 2079. [PubMed: 19505943]
30. Consortium CSA. Initial sequence of the chimpanzee genome and comparison with the human genome. Nature. 2005; 437:69–87. [PubMed: 16136131]
NIH-PA Author Manuscript
NIH-PA Author Manuscript
Figure 1. Samples, heterozygosity and genetic diversity
a. Geographical distribution of great ape populations across Indonesia and Africa sequenced
in this study. The formation of the islands of Borneo and Sumatra resulted in the speciation of the two corresponding orangutan populations. The Sanaga River forms a natural boundary between Nigeria-Cameroon and Central chimpanzee populations while the Congo River separates the bonobo population from the Central and Eastern chimpanzees. Eastern lowland and Western lowland gorillas are both separated by a large geographical distance. b.
Heterozygosity estimates of each of the individual species and subspecies are superimposed onto a neighbor-joining tree from genome-wide genetic distance estimates. Arrows indicate heterozygosities previously reported30 for Western and Central chimpanzee populations c. Runs of homozygosity among great apes. The relationship between the coefficient of inbreeding (FROH) and the number of autozygous >1 Mbp segments is shown. Bonobos and
Eastern lowland gorillas show an excess of inbreeding compared to the other great apes, suggesting small population sizes or a fragmented population. d. Genetic structure based on clustering of great apes. All individuals (columns) are grouped into different clusters (K=2 to K=6, rows) colored by species and according to their common genetic structure. Most captive individuals, labeled on top, show a complex admixture from different wild
populations. A signature of admixture, for example, is clearly observed in the known hybrid Donald, a second-generation captive where we predict 15% admixture of Central
chimpanzee on a Western background consistent with its pedigree. A gray line at the bottom denotes new groups at K=6 in agreement with the location of origin or ancestral admixture.
NIH-PA Author Manuscript
NIH-PA Author Manuscript
Figure 2. Inferred population history
Population splits and effective population sizes (Ne) during great ape evolution. Split times
(dark brown) and divergence times (light brown) are plotted as a function of divergence (d) on the bottom and time on top. Time is estimated using a single mutation rate (μ) of 1·10−9 mut/(bp·year). The ancestral and current effective population sizes are also estimated using this mutation rate. The results from several methods used to estimate Ne, (COALHMM, ILS
COALHMM, PSMC and ABC are colored in orange, purple, blue and green respectively). The chimpanzee split times are estimated using the ABC method. The x-axis is rescaled for divergences larger than 2·10−3 to provide more resolution in recent splits. All the values used in this figure can be found in Table S5.
NIH-PA Author Manuscript
NIH-PA Author Manuscript
Figure 3. PSMC analysis
Inferred historical population sizes by PSMC. The lower x-axis gives time measured by pairwise sequence divergence and the y-axis gives the effective population size measured by the scaled mutation rate. The upper x-axis indicates scaling in years, assuming a mutation rate ranging from 10−9 to 5·10−10 per site per year. The top left panel shows the inference for modern human populations. In the rest of the three panels, thin light lines of the same color correspond to PSMC inferences on 100 rounds of bootstrapped sequences.
NIH-PA Author Manuscript
NIH-PA Author Manuscript
NIH-PA Author Manuscript
NIH-PA Author Manuscript
NIH-PA Author Manuscript
Table 1
Genetic variation summary by species and subspecies
Summary statistics for each species and subspecies. Genus
Scientific name Species/subspecies
Common name
N
Mean Coverage
Fixed Sites to Human reference
No. of SNVs a Mean SNVs per Individual a No. of Singletons b Ancestry
Informative Markers (AIMs)
c Ne (10-3) d Homo Non-African 6 18.3 386,974 5,887,443 2,639,546 1,379,448 12,316 9.7 – 19.5 African 3 20.9 632,253 6,309,453 3,203,178 2,448,454 12,316 13.9 – 27.9 Homo sapiens Humans 9 19.2 224,660 9,172,573 3,061,604 3,827,902 -13.1 – 16.2 Pan
Pan troglodytes ellioti
Nigerian-Cameroon 10 16.7 25,017,403 12,605,585 4,816,435 2,695,109 2,213 18.5 – 37.0
Pan troglodytes schweinfurthii
Eastern 6 28.7 25,126,506 11,264,879 4,843,530 2,228,396 1,265 19.7 – 39.5
Pan troglodytes troglodytes
Central 4 23.8 25,080,750 11,820,858 4,983,933 3,948,347 619 24.4 – 48.7
Pan troglodytes verus
Western * 4 27.3 26,832,247 4,729,933 2,411,501 1,481,079 145,548 9.8 – 19.5 Pan troglodytes Common Chimpanzees 24 22.5 24,087,088 27,153,659 5,693,903 10,352,931 149,645 30.9 – 61.8 Pan Pan paniscus Bonobos 13 27.5 27,068,299 8,950,002 2,738,755 3,159,889 -11.9 – 23.8 Gorilla
Gorilla beringei graueri
Eastern lowland 3 22.8 34,537,496 3,866,117 2,578,328 484,482 317,028 12.2 – 24.3
Gorilla gorilla diehli
Cross river 1 17.6 35,553,861 2,585,360 2,585,360 165,482 35,693 14.9 – 29.8
Gorilla gorilla gorilla
Western lowland 23 17.8 31,602,620 17,314,403 6,410,662 2,797,388 19,902 26.8 – 53.5 Gorillas 27 18.3 31,376,203 19,177,989 6,492,831 3,447,352 372,623 28.4 – 56.9 Pongo Pongo abellii Sumatran 5 28.7 62,880,923 14,543,573 7,263,256 5,681,303 1,132,808 27.5 – 55.0 Pongo pygmaeus Bornean 5 25.8 64,249,235 10,321,213 5,763,354 3,555,596 1,132,808 19.5 – 39.0 Orangutans 10 27.3 60,661,869 24,309,920 9,338,148 6,409,648 -42.3 – 84.6 All 83 23.0 83,954,672 83,580,213
-a Polymorphic v-ari-ants found in e-ach species/subspecies -after substr-acting fixed sites. b Singletons and doubletons calculated combining all the samples within the species. c Variants only found in a single group within each species. d Calculated from
Θ
w.
μ
= 1e-9 - 0.5e-9 mut·bp-1·yr-1 and g = 25 for Homo and Pan, 19 for Gorilla and 26 for Pongo.