i
hsa-miR-497 AS A MODULATOR OF THE EXPRESSION IN THE PRESENCE OR ABSENCE OF CHRNA5 IN BREAST CANCER
A THESIS SUBMITTED TO
THE GRADUATE SCHOOL OF ENGINEERING AND SCIENCE OF BILKENT UNIVERSITY
IN PARTIAL FULFILLMENT OF THE REQUIREMENTS FOR THE DEGREE OF
MASTER OF SCIENCE IN
MOLECULAR BIOLOGY AND GENETICS
By
Başak ÖZGÜRSOY June 2017
ii
hsa-miR-497 as a Modulator of the Expression in the Presence or Absence of CHRNA5 in Breast Cancer
By Başak Özgürsoy June, 2017
We certify that we have read this thesis and that in our opinion it is fully adequate, in scope and in quality, as a thesis for the degree of Master of Science.
________________________ Özlen Konu Karakayalı
(Advisor)
________________________ Onur Çizmecioğlu
________________________ Çağdaş D. Son
Approved for the Graduate School of Engineering and Science
__________________ Ezhan Karaşan
iii
Abstract
hsa-miR-497 AS A MODULATOR OF THE EXPRESSION IN THE PRESENCE OR ABSENCE OF CHRNA5 IN BREAST CANCER
Başak ÖZGÜRSOY
MSc. in Molecular Biology and Genetics Supervisor: Özlen KONU KARAKAYALI
June, 2017
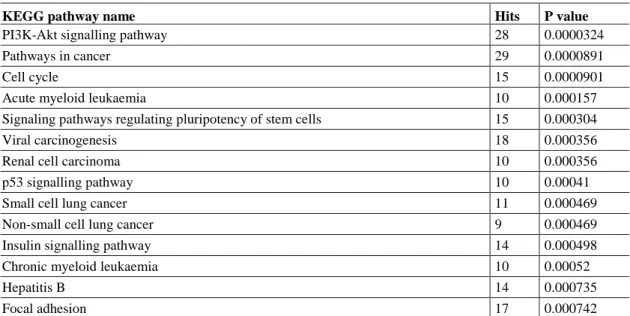
CHRNA5 is an important ligand-gated receptor with roles in addiction and in cancer. In lung cancer, CHRNA5 dysregulation is well known. There is also expression of CHRNA5 in breast cancer cell lines. microRNAs regulate mRNA expression; and different regulatory microRNAs are involved in different cancer types. microRNAs are thus potential biomarkers to diagnose the diseases (e.g. cancer). However, there is no study testing interactions between microRNAs and CHRNA5 in breast cancer. In the present study, mir-497 was found to be one of the most downregulated microRNAs with testable expression levels upon analysis of expression in the breast cancer cell line MCF7 when exposed to CHRNA5 siRNA. RT-qPCR was performed to test the expression level of mir-497. Validated target genes of mir-497 were found to be significantly related to a list of different KEGG pathways significantly (p value < 0.001) among which there were P53 and PI3K-Akt signalling pathways.
Mimic-mir-497 treatment, alone or together with CHRNA5 siRNA, was applied on MCF7 cells to understand the interaction between the miRNA and siRNA under investigation. Selected target genes of mir-497 were tested; the most significantly modulated genes were involved in P53 pathway. The results indicated interactions between mir-497 and CHRNA5 however selected targets were not affected by mimic-mir-497.
GSE41079 and GSE41074 public datasets containing mRNA and microRNA expression profiles of liver cancer cells treated with mimic-mir-497. Treatment were used to identify
iv
novel targets of mir-497 for future use. Immune system was detected in the second place upon REACTOME analysis of GSE41079 and GSE41074. Using multiple online microRNA-mRNA network tools mir-497 mRNA-miRNA networks were extracted for all or only immune genes. The results from network based analyses helped identify additional targets for later use in our mimic-siRNA system.
Keywords: microRNA, breast cancer, CHRNA5, mir-497, P53, PI3K-Akt, immune system
v
Özet
mir-497 MEME KANSERİNDE, CHRNA5 İLE ALAKALI, ÖNEMLİ BİR REGÜLATÖR MÜ?
Başak ÖZGÜRSOY
Moleküler Biyoloji ve Genetik Bölümü Yüksek Lisans Tez Danışmanı: Özlen KONU KARAKAYALI
Haziran, 2017
CHRNA5 bağımlılık ve kanserde rol oynayan önemli bir kimyasal kapılı iyon kanalıdır. Akciğer kanserinde bozulmaya uğradığı bilinen CHRNA5, meme kanserlerinde de ifade profile olan bir gendir. mikroRNAlar mRNA ifadesinde düzenleyici görevdedir, değişik mikroRNAlar değişik kanser tiplerinde düzenleyici görev alırlar. mikroRNAlar potansiyel biyo-belirteç görevi görerek kanser gibi hastalıkların teşhisinde kullanılırlar. Fakat meme kanserinde CHRNA5 ve onu hedefleyen mikroRNAlarla ilgili çalışma bulunmamaktadır.
Bu çalışmada, mir-497, siRNA CHRNA5 uygulanmış MCF7 hücrelerinde, en çok azalan ve test edilebilir ifade düzeyine sahip bir mikroRNA olarak saptanmıştır. Ters transkriptaz polimeraz zincir reaksiyonu gerçekleştirilmiş ve mir-497 ifadesi görülmüştür. MCF7 meme kanseri hücre hattında CHRNA5 susturulunca azalan ifadesiyle mir-497, meme kanserinde CHRNA5 bağlantılı önemli bir molekül olmaya adaydır. Kanıtlanmış mir-497 hedef genleri incelendiğinde, KEGG yolaklarının bu hedef genlerle belirgin bir seviyede (p < 0.001) ilgili olduğu görülmüştür. P53 and PI3K-Akt sinyal yolağı bunlardan ikisidir.
MCF7 hücrelerine mimik-mir-497 (tek başına veya siRNA CHRNA5 ile birlikte) uygulaması sonuçlarına dayanarak meme kanserinde mir-497 ve CHRNA5 arasındaki bağlantı incelenmiştir. Mir-497 hedef genleri deneyleri sonucu en çok belirgin bir değişim gösteren geneler P53 yolağında bulunmaktadır. Sonuçlar mir-497 ve CHRNA5 arasondaki ilişkiyi gösterse de seçilen hedef genler mimik-mir-497’den etkilenmemektedir.
GSE41074 ve GSE41079’da mimik-mir-497 HCC hücresine uygulanan mimic-mir-497 ile değişen mikroRNA ve mRNA profilleri bulunmaktadır. Devam eden çalışmalarda
vi
kullanılmak üzere mir-497 için daha önce çalışılmayan hedef genler belirlenmiştir. Analizleri sonrası ifadesi artan genler araştırıldığında bağışıklık sistemi REACTOME tarafından öne çıkarılmıştır. Çeşitli mRNA-mikroRNA odaklı harita oluşturma aracı kullanılarak tüm genler için ve sadece bağışıklık sistemi genleri için haritalar çıkartılmıştır. Bu haritalar sayesinde devam deneylerinde test edilebilecek aday moleküller elde edilmiştir.
Anahtar kelimeler: mikroRNA, meme kanseri, CHRNA5, mir-497, P53, PI3K-Akt, bağışıklık sistemi
vii
viii
Acknowledgements
I would like to express my thanks to my supervisor Assoc. Prof. Dr. Özlen Konu for her support, guidance, and for giving me the chance to study in this project. During my study in Konu Lab beside gaining knowledge on the subject, I improved my teamwork skills and I have been enlightened about life.
I would like to thank also Asst. Prof. Dr. Onur Çizmecioğlu and Assoc. Prof. Dr. Çağdaş D. Son for their time and being a jury member of my thesis. I would like to express my gratitude to my instructors. I would like to thank people who are working with us in the department in graduate school for their companionship and help. I would like to thank Ayşe Gökçe Keşküş for helping me on my plots. I would like to thank my colleagues: Dr. Mehtap Yılmaz Tezcan, Ermira Jahja, Şahika Cingir Köker, Rafed Said Tiryaki, Murat Yaman. I would like to thank Huma Shehwana for her answers to my sudden questions. I would like to thank my lovely mate, my precious companion Seniye Targen for the joy that she brings to my life, for helping me survive and simply being herself with me. I would like to thank all my friends; we share any kind of emotions.
I would like to express my deepest love to my family/my home: my father Musa Özgürsoy, my mother Nevin Özgürsoy and my brother Anıl Özgürsoy. They are more than what a human being can expect in life. I am very thankful to them for their unconditional love, their glowing eyes and warm words. They thought me anything and everything.
This project was supported by a research grant (to OK) funded by The Scientific and Technological Research Council of Turkey (TUBITAK) (114S367) and COST (BM1406). I was supported by Bilkent University and TUBITAK 114S367 for my graduate studies.
ix
Table of Contents
ABSTRACT ... III ÖZET ... V ACKNOWLEDGEMENTS ... VIII TABLE OF CONTENTS ... IX LIST OF FIGURES ... XII LIST OF TABLES ... XVIII ABBREVIATIONS ... XX CHAPTER 1.INTRODUCTION ... 1 1.1. CANCER ... 1 1.1.1. Breast Cancer ... 2 1.1.2. Hepatocellular Carcinoma (HCC) ... 4 1.2. MICRORNAS ... 41.2.1. microRNAs Related to Cancer ... 7
1.2.1.1. microRNAs related to Breast Cancer ...8
1.2.1.2. microRNAs related to immune system and cancer ...9
1.2.2. microRNAs Related to Cholinergic Receptor/ Nicotine... 12
1.2.3. hsa-mir-497 ... 13
1.2.3.1. Features and Relationship with Breast Cancer ... 13
1.2.3.2. hsa-mir-497 Targets and Related pathways ... 14
1.3. CHOLINERGIC RECEPTOR NICOTINIC ALPHA ... 17
1.4. ASSOCIATION OF CHRNA5 AND MICRORNAS FROM UNPUBLISHED/PREVIOUS STUDIES ... 17
1.5. EXPRESSION MEASUREMENT TECHNOLOGIES ... 18
1.5.1. Microarray ... 18
1.5.2. qRT-PCR using Sybr Green ... 18
1.6. IN SILICO ANALYSIS BY USING EXPRESSION MATRICES ... 18
1.6.1. miRWalk ... 19 1.6.2. MAGIA2 ... 19 1.6.3. MSigDB ... 21 1.6.4. MiRNet ... 21 1.6.5. MirTarVis ... 21 CHAPTER 2.AIM ... 23
CHAPTER 3.MATERIALS AND METHODS ... 24
x
3.1.1. Msigdb, MiRWalk, miRNet ... 24
3.1.2. MAGIA2 ... 25
3.1.3. MirTarVis ... 25
3.1.4. MATLAB ... 26
3.2. IN VITRO ANALYSES ... 27
3.2.1. Cell culture ... 27
3.2.1.1. Cell Culture Materials and Preparation of Reagents ... 27
3.2.1.2. Thawing Cells ... 27
3.2.1.3. Passaging Cells ... 28
3.2.1.4. Counting Cells ... 28
3.2.1.5. Freezing Cells ... 29
3.2.1.6. Treatment (siRNA, Scrambled oligo, mimic microRNA) ... 29
3.2.1.7. MTT assay ... 30
3.2.2. Gene Expression Analysis ... 32
3.2.2.1. RNA Extraction ... 32 3.2.2.2. cDNA synthesis ... 33 3.2.2.3. Primer ... 34 3.2.2.4. qPCR ... 36 3.2.2.5. Statistical Analysis ... 38 3.2.2.6. Microarray Study ... 39 CHAPTER 4.RESULTS ... 40
4.1. INTEGRATED MRNA-MICRORNACOUPLES BY SIRNA AND MIMIC TREATMENTS ... 40
4.1.1. mir-497 as a candidate microRNA related to CHRNA5 in breast cancer ... 40
4.1.2. Determination of target Genes of mir-497 ... 41
4.1.3. Expression Analyses of mir-497 Targets under CHRNA5 siRNA or mimic-mir-497 Treatment ... 46
4.1.4. Results of mimic-mir-497 in-vitro Treatment ... 52
4.1.4.1. MTT assay ... 52
4.1.4.2. qPCR Analyses of Mimic and siRNA experiments... 53
4.1.5. Correlation between GEO Data and qPCR Results under mimic-mir-497 Treatment ... 65
4.2. IMMUNE SYSTEM AND MIR-497RELATIONSHIP ... 67
4.2.1. Immune System Pathway Relation with mir-497 ... 67
4.2.1.1. Msigdb (REACTOME)... 67
4.2.1.2. General Analysis of GSE41079 and GSE4107 to Compare All Genes and only Immune Genes Clustergrams ... 70
4.2.2. Expression Results of Immune Genes under siRNA CHRNA5 and mimic-mir-497 Treatment ... 73
4.3. MIR-497RELATED GEODATA ANALYSIS (GSE41079 AND GSE41074) BY MRNA-MICRORNA INTEGRATION TOOLS ... 79
4.3.1. General GEO data analysis to see candidate microRNA under mimic-mir-497/195 treatment ... 79
xi
4.3.3. MAGIA2 ... 92
CHAPTER 5.CONCLUSION & DISCUSSION ... 96
CHAPTER 6.FUTURE PERSPECTIVES ... 107
REFERENCES ... 109
APPENDIX I ... 123
APPENDIX II ... 132
xii
List of Figures
Figure 1.1: 2012 Europe results of the rate of incidence and case of death for top five common cancer types a) Males B) Females (proportion and number of cases are seen). (Figure was taken from “Ferlay, J., et al., Cancer incidence and mortality patterns in
Europe: estimates for 40 countries in 2012. Eur J Cancer, 2013. 49(6): p. 1374-403. ” by
permission of Elsevier.) ... 3 Figure 1.2: microRNA action mechanism and therapeutic blocker or activator of their function. (Figure was taken from “Ling, H., M. Fabbri, and G.A. Calin, MicroRNAs and
other non-coding RNAs as targets for anticancer drug development. Nat Rev Drug
Discov, 2013. 12(11): p. 847-65.” by permission of Nature Publishing Group.) ... 6 Figure 1.3: Immune System Related microRNAs (Figure was taken from “Paladini, L., et al., Targeting microRNAs as key modulators of tumor immune response. J Exp Clin Cancer Res, 2016. 35: p. 103.” by permission of Creative Commons.) ... 10 Figure 1.4: Connection among microRNAs inflammation and cancer by the expression change of elements are involved in PI3K/Akt Signaling pathway in colon cancer. (Figure was taken from “Josse, C., et al., Identification of a microRNA landscape targeting the
PI3K/Akt signaling pathway in inflammation-induced colorectal carcinogenesis. Am J
Physiol Gastrointest Liver Physiol, 2014. 306(3): p. G229-43.” Permission was not required.) ... 11 Figure 1.5: SUMOylation of TARBP2 model (S: SUMOylation and P:Phosphorylation Figure was taken from “Chen, C., et al., SUMOylation of TARBP2 regulates
miRNA/siRNA efficiency. Nat Commun, 2015. 6: p. 8899.” by permission of Creative
Commons.) ... 16 Figure 3.1: Experimental design of treatment before MTT (grey parts should not be included in the experiments, - means no treatment there only DMEM to avoid vaporization) ... 32 Figure 4.1: mir-497-5p expression level in siRNA CHRNA5 treated MCF7 cells A) Si-111 reagent was used for five biological replicates of scrambled oligo and siRNA CHRNA5 treatments B) Si-40 and Si-53 were used for two biological replicates of scrambled oligo and siRNA CHRNA5 treatments. (* significant 0.01<p value< 0.05, **
xiii
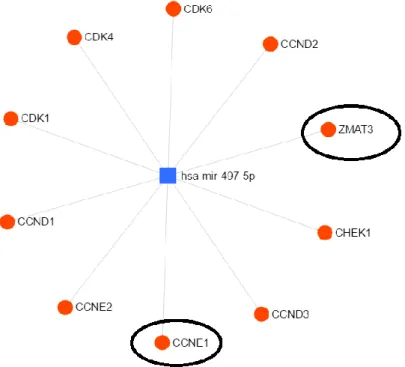
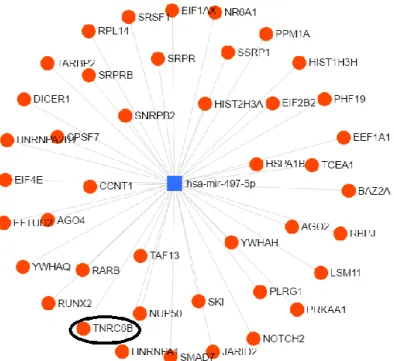
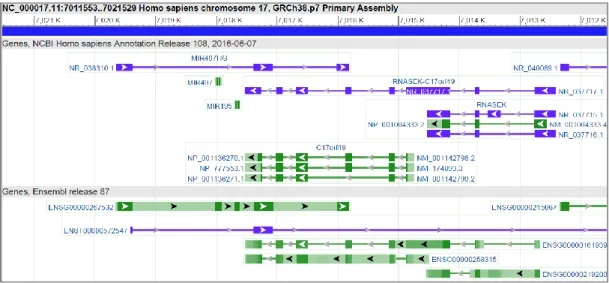
very significant 0.001 < p value < 0.01, *** extremely significant 0.0001 < p value < 0.001, **** extremely significant p val≤0.0001) ... 40 Figure 4.2: Mir-497-5p expression levels when SiRNA CHRNA5 treatment was applied with the same siRNA CHRNA5 reagent (Si-111) in MDA-MB-231 cell line. (p val. = 0.1173) ... 41 Figure 4.3: hsa-mir-497-5p network with PI3K-Akt Signaling Pathway genes by miRNet (KEGG). ... 42 Figure 4.4: hsa-mir-497-5p network with P53 Signaling Pathway genes by miRNet (KEGG). ... 43 Figure 4.5: hsa-mir-497-5p network with genes from REACTOME maximum hits involved pathway (Gene Expression) in miRNet... 44 Figure 4.6: ZMAT3 expression level under siRNA CHRNA5 treatment by using 5 biological replicates. (ZMAT3 p val. <0.0001, * significant 0.01<p value< 0.05, ** very significant 0.001 < p value < 0.01, *** extremely significant 0.0001 < p value < 0.001, **** extremely significant p val≤0.0001) ... 47 Figure 4.7: LAMC1 expression level under siRNA CHRNA5 treatment by using 5 biological replicates. (LAMC1 p val. <0.0001, * significant 0.01<p value< 0.05, ** very significant 0.001 < p value < 0.01, *** extremely significant 0.0001 < p value < 0.001, **** extremely significant p val≤0.0001) ... 48 Figure 4.8: CCNG1 expression level under siRNA CHRNA5 treatment by using 5 biological replicates. (p val. <0.0001, * significant 0.01<p value< 0.05, ** very significant 0.001 < p value < 0.01, *** extremely significant 0.0001 < p value < 0.001, **** extremely significant p val≤0.0001) ... 48 Figure 4.9: CADM1 expression level under siRNA CHRNA5 treatment by using 5 biological replicates.(p val. = 0.0003, * significant 0.01<p value< 0.05, ** very significant 0.001 < p value < 0.01, *** extremely significant 0.0001 < p value < 0.001, **** extremely significant p val≤0.0001) ... 49 Figure 4.10: PAM expression level under siRNA CHRNA5 treatment by using 5 biological replicates. (p value = 0.0679) ... 49
xiv
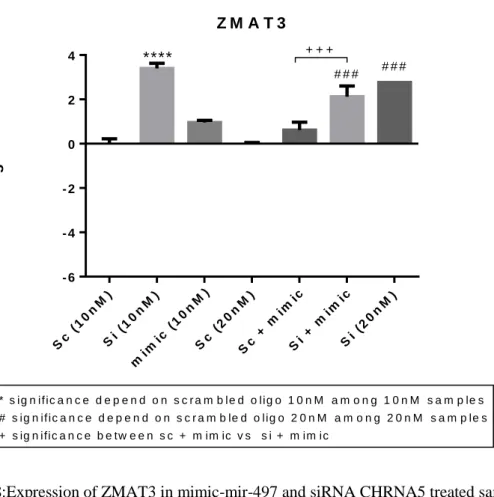
Figure 4.11: TNRC6B expression level under siRNA CHRNA5 treatment by using 5 biological replicates. (p val. = 0.4251) ... 50 Figure 4.12: CCNE1 expression level under siRNA CHRNA5 treatment by using 5 biological replicates. (p val. = 0.1354) ... 50 Figure 4.13: Map of a part of chromosome 17 (containing MIR497HG, C17orfHG and mir-497 cluster) from Genome Data Viewer. ... 51 Figure 4.14: Expression of A) antagonistic gene to mir-497 and B) synergistic gene to mir-497 in the absence of CHRNA5 (5 biological replicates for each treatment were used) ... 52 Figure 4.15: Cell viability data (MTT assay) of MCF7 cells treated with siRNA CHRNA5 and mimic-mir-497 single or alone with different doses A) by using 1.2µl transfection reagent B) by using 0.6µl transfection reagent. (, * significant 0.01<p value< 0.05, ** very significant 0.001 < p value < 0.01, *** extremely significant 0.0001 < p value < 0.001, **** extremely significant p val≤0.0001 depend on DMEM) ... 53 Figure 4.16: Expression of CHRNA5 in mimic-mir-497 and siRNA CHRAN5 treated samples A) 10nM reagents are used B) total treatment reagent is 20nM. (* significant 0.01<p value< 0.05, ** very significant 0.001 < p value < 0.01, *** extremely significant 0.0001 < p value < 0.001, **** extremely significant p val≤0.0001) ... 54 Figure 4.17: Expression of mir-497-5p in siRNA CHRNA5 and mimic-mir-497 treated samples. (* significant 0.01<p value< 0.05, ** very significant 0.001 < p value < 0.01, *** extremely significant 0.0001 < p value < 0.001, **** extremely significant p val≤0.0001) ... 55 Figure 4.18:Expression of ZMAT3 in mimic-mir-497 and siRNA CHRNA5 treated samples. (* significant 0.01<p value< 0.05, ** very significant 0.001 < p value < 0.01, *** extremely significant 0.0001 < p value < 0.001, **** extremely significant p val≤0.0001) ... 56 Figure 4.19: Expression of CCNG1 in mimic-mir-497 and siRNA CHRNA5 treated samples. (* significant 0.01<p value< 0.05, ** very significant 0.001 < p value < 0.01, *** extremely significant 0.0001 < p value < 0.001, **** extremely significant p val≤0.0001) ... 57
xv
Figure 4.20: Expression of CADM1 in mimic-mir-497 and siRNA CHRAN5 treated samples. (* significant 0.01<p value< 0.05, ** very significant 0.001 < p value < 0.01, *** extremely significant 0.0001 < p value < 0.001, **** extremely significant p val≤0.0001) ... 58 Figure 4.21: Expression of TNRC6B in mimic-mir-497 and siRNA CHRNA5 treated samples. (* significant 0.01<p value< 0.05, ** very significant 0.001 < p value < 0.01, *** extremely significant 0.0001 < p value < 0.001, **** extremely significant p val≤0.0001) ... 59 Figure 4.22: Expression of LAMC1 in mimic-mir-497 and siRNA CHRAN5 treated samples. (* significant 0.01<p value< 0.05, ** very significant 0.001 < p value < 0.01, *** extremely significant 0.0001 < p value < 0.001, **** extremely significant p val≤0.0001) ... 60 Figure 4.23: Expression of PAM in mimic-mir-497 and siRNA CHRAN5 treated samples. (* significant 0.01<p value< 0.05, ** very significant 0.001 < p value < 0.01, *** extremely significant 0.0001 < p value < 0.001, **** extremely significant p val≤0.0001) ... 61 Figure 4.24: Expression of CCNE1 in mimic-mir-497 and siRNA CHRAN5 treated samples. (* significant 0.01<p value< 0.05, ** very significant 0.001 < p value < 0.01, *** extremely significant 0.0001 < p value < 0.001, **** extremely significant p val≤0.0001) ... 62 Figure 4.25: Expression of MIR497HG in mimic-mir-497 and siRNA CHRAN5 treated A) samples from combined experiment B) samples from a new setup (p-val = 0.1491). (* significant 0.01<p value< 0.05, ** very significant 0.001 < p value < 0.01, *** extremely significant 0.0001 < p value < 0.001, **** extremely significant p val≤0.0001) ... 63 Figure 4.26: Expression of C17orf49 in mimic-mir-497 and siRNA CHRNA5 treated A) samples from combined experiment B) samples from a new setup (p-value= 0.8737 ). (* significant 0.01<p value< 0.05, ** very significant 0.001 < p value < 0.01, *** extremely significant 0.0001 < p value < 0.001, **** extremely significant p val≤0.0001) ... 64 Figure 4.27: Target genes’ scatter plots and Pearson correlation results under mimic-mir-497 treatment to compare A) GEO Total RNA result (HepG2) and qPCR result (MCF7)
xvi
(p value = 0.0826) B) GEO Ago2-IP result (HepG2) and qPCR result (MCF7) (p value = 0.4665) ... 66 Figure 4.28: Analysis of GSE41074 linkage A)Total RNA B) Ago2-IP ... 71 Figure 4.29: Analysis of immune genes in GSE41074 linkage A)Total RNA B) Ago2-IP ... 72 Figure 4.30: Clustergram of GSE41074 according to log2 fold changes. ... 73 Figure 4.31: Expression of mir-497-5p in mimic-mir-497 and siRNA CHRAN5 treated samples. ... 75 Figure 4.32: Expression of mir-221-3p in mimic-mir-497 and siRNA CHRNA5 treated samples. ... 76 Figure 4.33: Expression of mir-146a in mimic-mir-497 and siRNA CHRAN5 treated samples. (p value (sc/mimic) = 0.0811) ... 77 Figure 4.34: Expression of mir-23a in mimic-mir-497 and siRNA CHRAN5 treated samples ... 78 Figure 4.35: Expression of mir-34c in mimic-mir-497 and siRNA CHRAN5 treated samples ... 79 Figure 4.36: Upregulated microRNAs in both mimic treatments. ... 80 Figure 4.37: Log2 fold changes of upregulated microRNAs in mimic-mir-195 and down-regulated in mimic-mir-497. ... 80 Figure 4.38 Most A) upregulated and B) downregulated microRNAs present in the sort of % difference for mimic-mir-497 treatment from most upregulated to most downregulated. ... 81 Figure 4.39: Predicted CHRNA5 targeted microRNAs which are affected by one of the treatments mimic-mir-195 or mimic-mir-497. ... 82 Figure 4.40: CHRNA5 is targeted by microRNAs which have log2 fold change in Ago2-IP mimic-mir-497 samples are less than Ago2-Ago2-IP mimic-mir-195 in at least 5 predictors out of 12 in miRWalk. Future studies will focus on testing these findings. ... 82
xvii
Figure 4.41: Top 100 interactions’ network of mimic-mir-195 treatment by MirTarVis (Correlation Analysis) with no data filter by using Ago2-IP samples A)No negative correlation no filtering on direction B) Only negative correlation and opposite direction C) No filtering on correlation but downregulated microRNA and upregulated mRNA chosen as direction D) No filtering on correlation but downregulated mRNA and upregulated microRNA chosen as direction ... 85 Figure 4.42: Top 100 interactions’ immune related network of mimic-mir-195 treatment by MirTarVis (Correlation Analysis) with no data filter by using Ago2-IP samples A)No negative correlation no filtering on direction B) Only negative correlation and opposite direction C) No filtering on correlation but downregulated microRNA and upregulated mRNA chosen as direction D) No filtering on correlation but downregulated mRNA and upregulated microRNA chosen as direction ... 87 Figure 4.43: Top 100 interactions’ related network of mimic-mir-497 treatment by MirTarVis (Correlation Analysis) with no data filter by using Ago2-IP samples A )No negative correlation no filtering on direction B) Only negative correlation and opposite direction C) No filtering on correlation but downregulated microRNA and upregulated mRNA chosen as direction D) No filtering on correlation but downregulated mRNA and upregulated microRNA chosen as direction ... 89 Figure 4.44: Top 100 interactions’ immune related network of mimic-mir-497 treatment by MirTarVis (Correlation Analysis) with no data filter by using Ago2-IP samples A)No negative correlation no filtering on direction B) Only negative correlation and opposite direction C) No filtering on correlation but downregulated microRNA and upregulated mRNA chosen as direction D) No filtering on correlation but downregulated mRNA and upregulated microRNA chosen as direction ... 91 Figure 4.45: Network of microRNAs which targets CHRNA5 by miRNet. ... 92 Figure 4.46: MAGIA2 networks of GSE41079 and GSE41074 A) direct network B) circuits network (Analysis: Matched, target predictor: TargetScan, correlation: spearman, limitation: nothing, data: Ago2-IP mimic-mir-497). ... 93 Figure 4.47: MAGIA2 immune networks of GSE41079 and GSE41074 A) direct network B) circuits network (Analysis: Matched, target predictor: TargetScan, correlation: spearman, limitation: nothing, data: Ago2-IP mimic-mir-497). ... 95
xviii
List of Tables
Table 1.1: Cancer Types and Features of Different Cancer Types ... 2
Table 1.2: microRNAs and related cancer types (breast, ovary, colon, AML, CML, CLL, endometrioid adenocarcinoma) ... 8
Table 1.3: microRNAs and related cancer types (Esophagus, Gastrointestinal, lung, bladder, thyroid tumours) ... 8
Table 1.4: In Tumour cancer and immune related functions of microRNAs... 12
Table 3.1: File format for gene and microRNA data in MAGIA. ... 25
Table 3.2: File format for paired and unpaired samples in MirTarVis. ... 26
Table 3.3: Mimic treatment for further RNA isolation procedure ... 30
Table 3.4: Treatments for further MTT procedure... 31
Table 3.5: Primer sequences of genes negatively correlated to hsa-mir-497-5p ... 35
Table 3.6: Qiagen Primer Assays ... 36
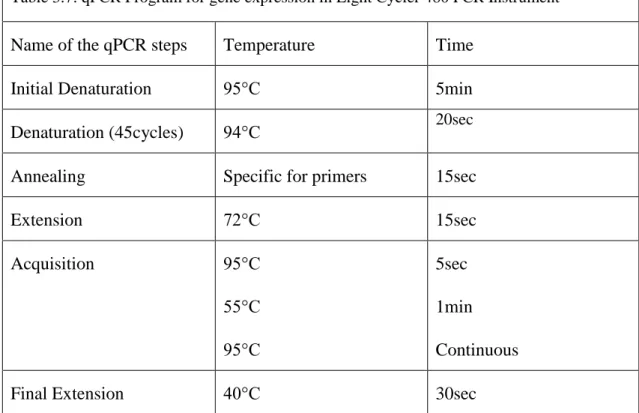
Table 3.7: qPCR Program for gene expression in Light Cycler 480 PCR Instrument ... 37
Table 3.8: qPCR Program for microRNA expression in Light Cycler 480 PCR Instrument ... 37
Table 4.1 : List of KEGG pathways related to mir-497-5p obtained from miRNet analysis ... 42
Table 4.2: : Expression Profiles of mir-497 target genes from mRNA microarray (siRNA CHRNA5 Treatment; Data obtained from Tubitak Project111T316)... 45
Table 4.3: Experimental genes’ prediction out of twelve different predictors in miRWalk. ... 45
Table 4.4: Related disease classes to selected genes in DAVID 145,146... 46
Table 4.5: Expression Profile of mir-497 target genes from GSE41074 (mimic-mir-497 or mimic-mir-195 Treatment) ... 46
xix
Table 4.6: Analysis of Expression Profile of C17orf49 and MIR497 under siRNA CHRNA5 treatment (Tubitak project 111T316). ... 51 Table 4.7:Top 50 pathways of downregulated genes (fc<-0.5, pathway database: REACTOME, data: Total RNA) ... 68 Table 4.8:Top 50 pathways of upregulated genes (fc>0.5, pathway database: REACTOME, data: Total RNA) ... 69 Table 4.9: Top 50 pathways of downregulated genes (fc<-0.5, pathway database: REACTOME data: Ago2-IP) ... 70 Table 4.10: Top 50 pathways of upregulated genes (fc>0.5, pathway database: REACTOME data: Ago2-IP) ... 70 Table 4.11: Expression Profile of microRNAs under siRNA CHRNA5 Treatment ... 74 Table 4.12: Expression Profile of microRNAs under mimic-mir-497 or mimic-mir-195 Treatment ... 74
xx
Abbreviations
BRCA: breast carcinomas CRC: colorectal cancers GBM: glioblastoma
UCEC: endometrial carcinomas BLCA: bladder carcinomas
OVCA: ovarian serous adenocarcinomas LAML: acute myelogenous leukemia LUAD: lung adenocarcinoma
LGG: low grade glioma
STAD: stomach adenocarcinoma LogFC: log2 fold change
1
Chapter 1. Introduction
1.1. CancerCancer can be defined as the production of abnormal immortal cells unfettered in different parts of body. The next step is metastasis which means that cancer invades and spreads to other body parts. Physical (e.g. UV light), chemical (e.g. smoking) and biological (e.g. viruses) effects can produce a tumour cell from a normal cell by alteration of genes or expression of genes in the cell. Affected genes can be separated into two categories: tumour suppressors and oncogenes. Tumour suppressors prevent cancer formation while oncogenes potentially cause cancer. Additionally, aging is another important factor for cancer formation. Cancer is one of top diseases causing death in the world. There are different cancer types referring to the origin of tumour cells, e.g., lung cancer, liver cancer, breast cancer, stomach cancer, colorectal cancer and oesophageal cancer. Different cancer types have different behaviours: some are slowly developing some are fast, some cancer types give better results with chemotherapy and some others are treated with surgery. Therefore each should be investigated separately; treatment methods and importance of diagnosis differ among them 1. Moreover, depending on gender, some cancer types are more common than the others. The most dramatic one is the breast cancer since it is seen much more commonly in females. The rate of incidence for different cancer are seen in Table 1.1 2.
2
Table 1.1: Cancer Types and Features of Different Cancer Types
Taken from “Lu, C., et al., Patterns and functional implications of rare germline variants
across 12 cancer types. Nat Commun, 2015. 6: p. 10086.” by permission of Creative
Commons.
1.1.1. Breast Cancer
3
Figure 1.1: 2012 Europe results of the rate of incidence and case of death for top five common cancer types a) Males B) Females (proportion and number of cases are seen). (Figure was taken from “Ferlay, J., et al., Cancer incidence and mortality patterns in Europe: estimates for 40
countries in 2012. Eur J Cancer, 2013. 49(6): p. 1374-403. ” by permission of Elsevier.)
Cancer is one of the most common causes of death and in women breast cancer is the most common type of cancer: 28.8% of cancer cases are formed in breast, and 16.8% of deaths from cancer is due to breast cancer (Figure1.1). Factors that can contribute to breast cancer are being overweight, exposure to hormonal therapies, alcohol usage, radiation, not having a child and having a positive family history. These factors are physical, chemical or biological. Around ten percent of breast cancer cases occur because of an inherited gene mutation (BRCA1 or BRCA2 etc.) 3.
4
Breast cancer cell lines obtained from different stages and types of cancers with different features exist for use by researchers. MCF7, BT20, T47D, MDAMB231 are examples to these cell lines. MCF7 whose expression profile belongs to luminal gene cluster, is Estrogen Receptor Positive (ER+) and Progesterone Receptor Positive (PR+) cell line while it is obtained from pleural effusion sourced invasive ductal carcinoma. BT20 falls into Basal A gene cluster. This is ER and PR negative invasive ductal carcinoma; it’s source is primary breast. MDA-MB-231 is from ER and PR negative adenocarcinoma. It’s source is pleural effusion and it clusters with Basal B type breast cancer samples 4.
1.1.2. Hepatocellular Carcinoma (HCC)
Third cause of death from cancer is liver originated cancers and hepatocellular carcinoma (HCC) is the most common type of liver cancer. Most common cause of liver cancer is cirrhosis because of alcohol, hepatitis B (by HBV: hepatitis B virus) or hepatitis C (HCV: hepatitis C virus). Hepatocellular carcinoma is not common in developed countries generally, but prevalence of hepatitis B infection makes the disease common 5. Molecular level of disease includes changes in gene regulation. Biomarkers 6, protein markers 7 and non-coding RNAs 8 are some categories of affected genes from HCC. Seven hundred thousand human deaths occur in a year because of this lethal disease 9.
1.2. microRNAs
Small non-coding RNAs are around 22 nucleotides length and have roles in regulation of mRNA expression. They are named as “microRNAs (miRNAs)” and they regulate mRNA/protein expression upon cutting of targeted mRNA or only repression of translation of the gene 10. Reinhart et al found that microRNAs exist also in Arabidopsis therefore it is a proof that microRNA existence is originated in early eukaryotic evolution
11. And later, multiple microRNAs are identified in different organisms 12 (even in viruses 13) by in-silico analysis and experiments.
On this point, understanding of mechanism of synthesis and involvement of microRNAs in the gene expression regulation is important. microRNA genes encode a longer RNA than mature microRNA molecule. There are processing steps for the mature microRNA occurrence. For example, there are pre-mRNA host genes and many of microRNAs are in introns of these host genes. These microRNAs use regulatory elements of host genes and have relatively similar expression 14. RNA polymerase II transcribes microRNAs as
5
pri-miRNA (large RNA precursor) which has a polyA tail and five-prime cap structures
15. There is a complex in nucleus consisting of Drosha and DGCR8/Pasha where Drosha
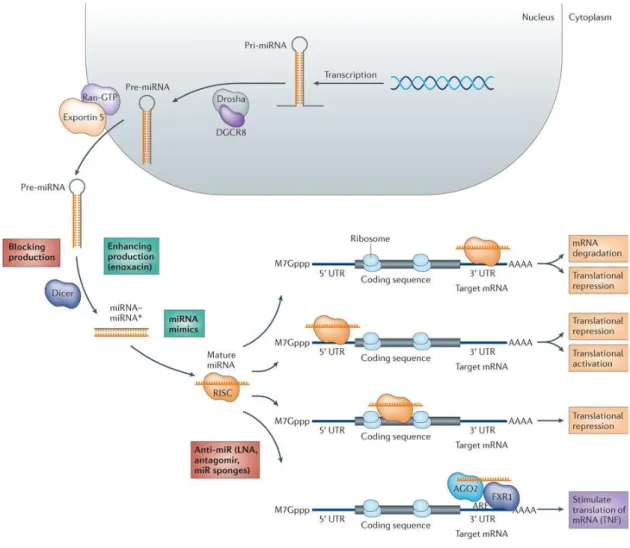
is the name of ribonuclease III enzyme and DGCR8 is a protein and subunit of microprocessor complex in human (Pasha is the name given to the same protein in other organisms especially model organisms) 16. The complex makes pri-miRNAs processed to pre-miRNAs as hairpin loop of folded 70 nucleotide length sequence 17. Exportation is then started by recognition of this RNA sequence by Exp5 which is a receptor 18. The release of pre-miRNAs happens through nuclear pore complex as a result of GTP hydrolysis; and it is possible in the presence of Ran-GTP cofactor. After pre-miRNAs are in cytoplasm; there are more processing steps occurring with Dicer and RNase III to get mature microRNAs. Mature microRNAs bind to Ago protein (Argonaut) and RISC is composed. 19. Dicer is encoded by DICER1 gene in human. It cuts pre-miRNA and double stranded RNA (dsRNA) leading to siRNA and mature microRNAs. The resulting fragments are around twenty-two base pairs long with two base pair extension on the 3’ end 20. RISC is a ribonucleoprotein complex which has an ability to target and silence a nucleic acid sequence (degrade mRNA) 21. As explained in Figure 1.2, after RISC complex formation there are different outcomes depending on which part of mRNA is targeted. Possible results are: mRNA degradation, translational repression when 3’ UTR is targeted; translational repression, translational activation when 5’ UTR is targeted; translational repression when coding sequence is targeted. Additionally, microRNAs cannot be in RISC complex but interact with some proteins (AGO2 & FXR1) which have effects on regulation so those microRNAs upregulate expression of target gene as a second-hand effector 22.
6
Figure 1.2: microRNA action mechanism and therapeutic blocker or activator of their function. (Figure was taken from “Ling, H., M. Fabbri, and G.A. Calin, MicroRNAs and other
non-coding RNAs as targets for anticancer drug development. Nat Rev Drug Discov, 2013. 12(11):
p. 847-65.” by permission of Nature Publishing Group.)
Regulation of microRNAs does not only happen in development 23, proliferation, differentiation 24 or apoptosis but also during tumorigenesis 25. microRNA gene locations seem near to important parts of chromosomes that correlate with tumour progression or chromosome abnormality 26. Since microRNAs have regulatory effects on gene expression, changes in microRNA expression tend to be related to diseases. As expected, current data suggest that microRNAs can be considered as potential biomarkers to use in the diagnosis of diseases (e.g., cancer 27, diabetes 28 or cardiovascular 29 disorders etc.). More than one mRNA can be targeted by a single microRNA. Also one mRNA can be regulated by multiple microRNAs. Thus network production by using integration between microRNAs-mRNAs expression has led researchers to discover cancer biomarkers (microRNAs as cancer biomarker). microRNAs can be useful not only at the treatment level but also help detection of disease phase. In Cambridge Healthtech
7
Institute’s 10th Annual microRNA as Biomarkers and Diagnostics Conference, in 2014, the main question to answer was how to detect a disease earlier by the help microRNAs. The resulting achievement of the conference has been that microRNAs don’t just help diagnose the disease but give hints about stratification of patients and treatment response
30. There are many different processes which microRNAs are involved such as cell cycle 31, metabolism 32, development 33. In development microRNAs have effective roles
because of their potential to control cell growth and differentiation. Therefore, microRNAs tend to be used also in cancer therapy which share control of the same processes. There are different ways to modulate microRNAs and thus the related processes: microRNA can have a single point mutation preventing their binding, or mRNA which is targeted can have a mutation, or microRNA transcription can be silenced epigenetically 34. Lastly there is a wide range of research on microRNAs which supports that they can be used in treatment of diseases and or to diagnose them 35.
1.2.1. microRNAs Related to Cancer
In different human cancer types, there is an expression difference between patient and healthy groups depicted as an increase or decrease 36. Cleavage of targets is seen more commonly in oncogenic microRNAs’ functional patterns. Although oncogenic microRNAs are placed in the amplified sequences, tumour suppressor microRNAs can be found in deleted parts of the genome in general 37. Two tables consisting of different microRNAs show expression changes in different cancer types. Common or uncommon microRNAs are seen in different cancer types. For example, the expression of mir-191, in both ovary and breast cancers, is upregulated. On the other hand, mir-199a is not seen to be changing in breast cancer 36.
8
Table 1.2: microRNAs and related cancer types (breast, ovary, colon, AML, CML, CLL, endometrioid adenocarcinoma)
Taken from “Naeini, M.M. and A.M. Ardekani, Noncoding RNAs and Cancer. Avicenna J Med Biotechnol, 2009. 1(2): p. 55-70.” by permission of Creative Commons.
Table 1.3: microRNAs and related cancer types (Esophagus, Gastrointestinal, lung, bladder, thyroid tumours)
Taken from “Naeini, M.M. and A.M. Ardekani, Noncoding RNAs and Cancer. Avicenna J Med Biotechnol, 2009. 1(2): p. 55-70.” by permission of Creative Commons.
1.2.1.1. microRNAs related to Breast Cancer
Several microRNAs have been shown to be related to breast cancer formation due to their effects on breast cancer specific genes 38. These microRNAs are separated into different classes: tumour suppressors, oncogenic (oncomiRs) and lastly metastatic microRNAs. Tumour suppressor microRNAs’ targets consist of oncogenes. Metastatic microRNAs
9
have roles in the process of changing a tissue from epithelial to mesenchymal, e.g., mir-9, mir-10b, mir-21, miR-29a are some of the metastatic microRNAs 39. Some microRNAs
provide protection from metastases: miR-20, miR-30, miR-193b, miR-146, mir-31 while Let-7, mir-200 microRNA families and mir-205, mir145 are tumour suppressors 40. Examples to OncomiRs include mir-15, mir-16, mir155, mir-21 family etc. 41.
1.2.1.2. microRNAs related to immune system and cancer
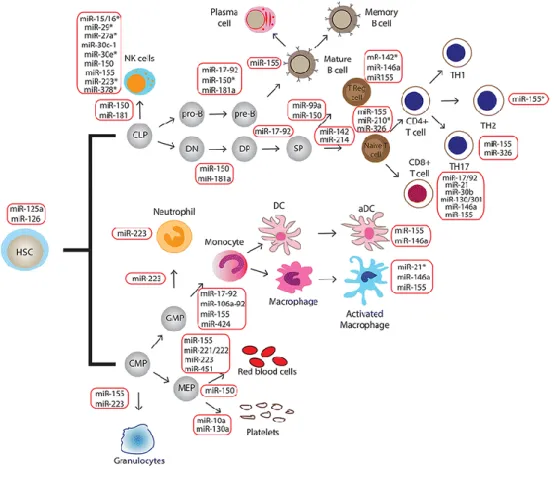
There are specific microRNAs related to the immune system. Innate and adaptive immune systems may be regulated by microRNAs specifically. mir-144 42, mir-150 43, mir-10 44, mir21 45, mir-155 46, mir-146a 47, mir-125b 48 and let-7 48 are involved in innate immune cell development. mir-132 49, mir-150 50, mir-34a 51, mir-155 52, mir-146a 53, mir-21 54 are involved in immune function and B/T cell development. The general map of map of microRNAs in the immune system and where each one has role are shown 55.
10
Figure 1.3: Immune System Related microRNAs (Figure was taken from “Paladini, L., et al.,
Targeting microRNAs as key modulators of tumor immune response. J Exp Clin Cancer Res,
2016. 35: p. 103.” by permission of Creative Commons.)
There is a connection between the immune system and cancer. Immunity has role both as protector from cancer or promoter to cancer 56. microRNAs are gene regulators in different biological processes (e.g. development, differentiation) 57. microRNAs at the same time are differently expressed in immune system and misregulation of specific microRNAs results in multiple diseases as cancer or inflammatory disorder 58. An example for the connection among cancer, immune system and microRNAs is: PI3K/Akt Signaling pathway proteins are affected by a defect on microRNAs in leukocytes or colon cells in a case of chronic inflammation resulting cancer cell proliferation contribution 59.
11
Figure 1.4: Connection among microRNAs inflammation and cancer by the expression change of elements are involved in PI3K/Akt Signaling pathway in colon cancer. (Figure was taken from “Josse, C., et al., Identification of a microRNA landscape targeting the PI3K/Akt
signaling pathway in inflammation-induced colorectal carcinogenesis. Am J Physiol
12
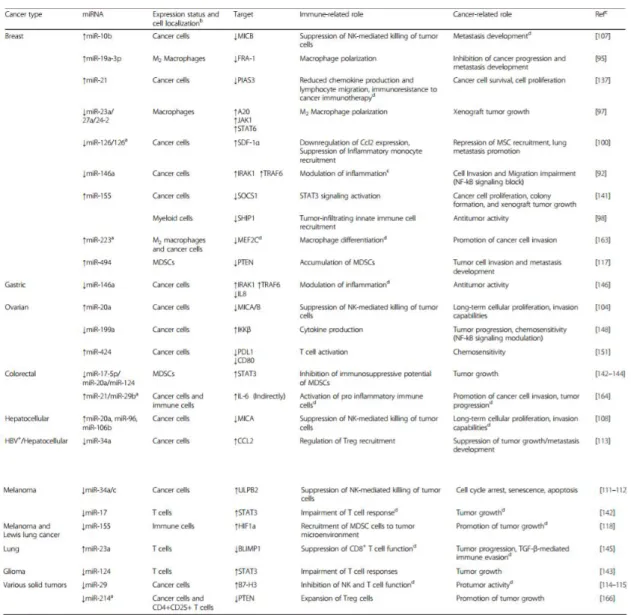
Table 1.4: In Tumour cancer and immune related functions of microRNAs.
Modified from “Paladini, L., et al., Targeting microRNAs as key modulators of tumor immune
response. J Exp Clin Cancer Res, 2016. 35: p. 103.” by permission of Creative Commons.
1.2.2. microRNAs Related to Cholinergic Receptor/ Nicotine
Several microRNAs have roles in nicotinic acetylcholine receptor signalling. mir-140-3p is a nicotine sensitive microRNA 60. Expression of mir-124 increases after LPS exposure to cells by cholinergic agonists. Mir-124 stops TACE and cause TNFa downregulation and also targets STAT3 activator and IL6 expression decreases 61. Mir-132 and mir-212 also have roles in cholinergic signalling 62. In mesocorticolimbic reward pathway,
13
nicotine arranges mir-542-3p level. When mir-542 is upregulated, CHRNB2 is downregulated 63. For primates and rodents, acetylcholine formation is regulated by
mir-149 64. miR-199a-5p, miR-200b and miR-429 are predicted target butyrylcholinesterase and acetylcholinesterase receptor 65. There are specific mRNA-miRNA couple in primates: mir-608 targets acetylcholinesterase 66. Additionally, in mammals, mir-132 targets acetylcholinesterase and it is conserved couple 67. SNPS in CHRNA5 and NRXN1 are related with smoking. For NRXN1 SNP, the sequence is homolog to mir-6740-5p when common allele is seen and mir-6866-5p when risk allele exists 68. Mir-10a and mir-615-3p target CHRNA5 69.
1.2.3. hsa-mir-497
1.2.3.1. Features and Relationship with Breast Cancer
Hsa-mir-497 is the miRBase name of a microRNA found in human. MIR497HG (ENSG00000267532) is the host gene of the microRNA and is also named as mir-195. It is found on chromosome 17 from 7,015,818bp to 7,019,659bp, its size is around 4000 bases 9. From the first intron of MIR497HG gene, mir-497 microRNA is encoded. It is categorized as a mir-15 family member 70, or miR-16/15/195/424/497 71. In NCBI GeneRIFs hsa-mir-497 seems to be related to bladder cancer, colorectal cancer, gastric cancer, ovarian cancer, lung cancer, renal cancer, pancreatic cancer, cervical cancer and breast cancer.
Firstly, a breast cancer study indicates a change in mir-497 expression 72. In a study of breast cancers in males mir-497 has been shown as one of the most downregulated microRNAs 73. Another paper indicates that mir-497 is downregulated in HCC 74. Also in other cancer types mir-497 is downregulated, e.g., colorectal cancer 75, bladder cancer
76, ovarian cancer 77. These suggest that this microRNA acts as a tumour suppressive in
general. However, in new studies an opposite role (oncogenic) also has been recognized in some other cancer types: large B-cell lymphoma 78 and chronic lymphocytic leukaemia 79. When recent studies are combined with old ones the result is that, hsa-mir-497 can act
both of the roles, as tumour suppressor or promoter.
In breast cancer, miR-497 correlates negatively with the size of tumour, metastasis and HER-2 status but seems not correlated with ER or PR status and p53 gene expression 40. Upregulation of the microRNA causes a decrease in expression of anti-apoptotic Bcl-2
14
family member (Bcl-w) whose downregulation is inhibited in cellular growth and enhanced apoptosis so mir-497 acts as a tumour suppressor. Therefore, mir-497 expression level can be used as a biomarker for diagnosis 80. In breast cancer, mir-497 targets different genes and has a role in different processes: VEGFR-2/angiogenesis 81, CCNE1/Cell cycle 82 and Bcl-2/apoptosis 83.
1.2.3.2. hsa-mir-497 Targets and Related pathways Apoptosis
Bcl-2 decreases apoptosis rate; thus, it is anti-apoptotic. In breast cancer Bcl-2 is targeted by mir-497 83; and also in chronic lymphocytic leukaemia 79 and gastric cancer 84. A
similar functioning molecule Bcl-w is another target of mir-497. Mir-497 binds to 3’UTR of Bcl-w and inhibits its effect on reducing apoptosis. The expression of Bcl-w in mRNA and protein level decreases via the effect of mir-497 85. These two anti-apoptotic molecules also promote migration and invasion of cells by involvement of downstream molecules as EGFR, PI3K and MMP-2 86.
Cell Cycle
There are genes which have roles in cell cycle regulation. In addition they are targets of mir-497: eIF4E (Eukaryotic translation initiation factor 4E) 87, CCNE1 (G1/S-specific cyclin-E1) and CDK4 (Cyclin-dependent kinase 4) 9. In different cancer types, there is an increase in the expression of mir-497 level 88. CCNE1 binds to CDK2 (Cyclin-dependent kinase 2) and activates it to change G1 to S phase 89. In breast cancer and hepatocellular carcinoma, mir-497 targets CCNE1 and blocks CCNE1 mRNA. Thus, G1 arrest happens and tumour growth is inhibited 9, 82.
PI3K/AKT, MAPK/ERK and NF -kappa B signalling pathways
Another critical target of mir-497 is VEGF-A, since it has a role in angiogenesis. In HCC, angiogenesis and metastasis are reduced by mir-497 by the help of targeting VEGF-A 90. mir-497 inhibitors induce p-Akt upregulation because of VEGF-A upregulation. The increase of p-Akt upregulates Bcl-2 and CCND1; also promotes osteosarcoma cell growth
91. When an ovarian cancer cell is transfected with mir-497, the expression levels of
downstream molecules of VEGF-A in signalling (AKT, ERK1, ERK2) display reductions. These reductions result in an inhibition of the rate of angiogenesis 92. VEGF-A, together with VEGFR-2 are important in the anti-angiogenesis actions; The expression levels of both of them are estimated to be reduced by mir-497 via pathways: PI3K/AKT
15
and MAPK/ERK 93. Mir-497 inhibits cell growth and human umbilical vein endothelial
cells’ apoptosis in breast cancer by targeting VEGFR-2 81. There are two more receptors:
IGF-1R (insulin like growth factor receptor 1) and insulin receptor (IR) regulated by mir-497. Mir-497/IR or mir-497/IGF-1R are tumour suppressor/oncogene couples. mir-195 and mir-497 targets include Igf1r, Insr, Ccnd2 and Ccne1 in myoblasts. In myogenesis NF-κB–miR-195/497–Igf1r/Insr-Ccnd2/Ccne1 signalling pathway is important 94. In cervical cancer, mir-497 also is downregulated. The microRNA binds to 3’ UTR of IGF-1R and reduces its expression level 95. In colorectal cancer, inhibition of metastasis, proliferation and invasion are provided by mir-497 targeting IGF-1R and PI3K/Akt signalling pathway regulation 96. In cytoplasm, when IKKβ (Ikβ kinase) phosphorylates, phosphorylated Ikβ (NFκβ inhibitor) releases NFκβ and translocation signal is formed then NFκβ goes into the nucleus and binds to DNA. As a result of the binding, several steps in cancer are promoted: metastasis and invasion, tumour growth or angiogenesis 97. There is a binding site on IKKβ mRNA 3’ UTR and when mir-497 binds to this site, it blocks NFκβ release and hence mir-497 acts as a tumour suppressor. There is also a feedback mechanism: mir-497 blocks the NFκβ release from IKK and also NFκβ can block mir-497 94.
mir-497 Relation to Immune System and Inflammation
There are examples that mir-497 has a relation to immune system regulation. It is one of eight microRNAs found to be down-regulated (significantly) in glaucomatous retinae causes up-regulation of immune system related genes 98. Type 2 diabetes is a complex
disease; microarray result show mir-497 is one of the microRNAs up-regulated in diabetic GK rats more than two fold. Additionally, statistical tests with genes show that genes (differently expressed in disease) maybe related to immune system 99. Granulocytic
airway inflammation has subgroups (e.g. allergic airway diseases) and there is a connection between granulocyte recruitment and microRNAs. miR-497 is one of the candidate microRNAs with a role in neutrophil recruitment and as a regulator of inflammation on the airway 100.
Mir-497 and Calcium
There are microRNAs regulate cardiac calcium signalling (e.g. mir-494, mir-145, mir-1)
101. Also, in a study related with stroke, there are microRNAs shown related with Ca2+
(mir-16
497, mir-320, mir-29b, mir-181) block pro-survival genes as exitotoxic Ca2+ influx 102.
On the other hand, mir-34a blocks pro-cell death gene which is promoted by exitotoxic Ca2+ influx. Antagomirs effect on mir-497 reduces severity when there is a neurological damage 103.
More Targets
There are more targets of mir-497. SMURF1, ANLN, NRDP1, BIRC5, WNT7A are directly repressed by mir-497. YAP1 is repressed by mir-497 104. mTOR 105 and KSR1
106 are also repressed by mir-497 and leading to less chemosensitive cells. WEE1
(retinablastoma) 107, PDCD4 (glioma) 78, HDGF (lung cancer) 108 and AMOT (osteosarcoma) 109 are some other targets of mir-497. As it was explained under the title “microRNAs” DICER is important in mature microRNA formation. There is another molecule “TARBP2” which is bound to DICER in the process of binding non-mature microRNA together with Ago2. It is suggested that in adrenocortical carcinoma DICER and TARBP2 are direct targets of mir-497 by the help of Ago2 IP; mir-497 can down-regulate both of them. There is a feedback: pre-mir-497 mature mir-497--| TARBP2&DICER transition from pre-mir-497 to mature mir-497 110.
Figure 1.5: SUMOylation of TARBP2 model (S: SUMOylation and P:Phosphorylation Figure was taken from “Chen, C., et al., SUMOylation of TARBP2 regulates miRNA/siRNA
17 1.3. Cholinergic Receptor Nicotinic Alpha
One of the important factors leading to lung cancer and even other cancer formations is smoking. Nicotine is contained in smoke and is a ligand of ligand gated ion channels/receptors (nAChRs: neuronal nicotinic acetylcholine receptors) to which ligand acetylcholine also binds. CHRNA5 is one of the nAChRs. It is encoded from Chromosome 15. On this chromosome CHRNA4 and CHRNA3 are also encoded (15q25). CHRNA5 affects cell proliferation in lung cancer 111. There are two common SNPs on CHRNA5 and
CHRNA3 in lung cancer 112. Rs16969968 is a SNP on CHRNA5; CHRNA5 containing this SNP has less protectiveness against nicotine/CHRNA7 mediated signalling. CHRNA5 and CHRNA3 knockdown make Ca influx increase. The cause can be explained as more CHRNA7 formation to support the lack of other nAChRs 113. Other subunits which are involved in acetylcholine receptor with CHRNA5 are β2 and α4. From miRNet.ca, for α4 and α5, there is no microRNA validation. However, there are thirteen microRNAs target β2. Most of the microRNAs were not studied deeply. After nicotine binds to nAChRs, calcium influx happens and signalling pathways (e.g. PI3K/Akt) are affected. Proliferation and blocking on apoptosis are two examples of the result of the nicotine binding 114. Many lung and breast cancer cell lines have expression of CHRNA9, CHRNA5 and CHRNA10. Nicotine is not a carcinogen. However, in cancer cells nicotine induces cell growth (e.g. breast cancer). Nicotine exposure level promotes CHRNA9 expression in breast cancer 115. CHRNA5 might be involved in estrogen signalling 116. Nicotinic receptors show some connection to breast cancer but the relations between CHRNA5 and microRNAs are not known.
1.4. Association of CHRNA5 and microRNAs from Unpublished/Previous Studies
CHRNA5 was detected as an important gene for breast cancer in our previous unpublished data. In the study CHRNA5 was silenced resulting in phenotypic changes and differential expression of genes related to proliferation or apoptosis under siRNA CHRNA5 treatment in MCF7 cells (Ermira Jahja et al. submitted; TUBITAK 111T316; Affymetrix HGU133 Plus 2 microarrays for siRNA and scrambled oligo treated cells). Differentially expressed mRNAs were shown as targets of microRNAs and microRNA array was performed in the context of 114S367 project (MCF7 cells treated with siRNA
18
CHRNA5 / scrambled oligo). The aim was to find microRNAs antagonist or synergistic with CHRNA5. The achievement can be a biomarker and used in a treatment with CHRNA5. The microRNA array results gave a group of candidate microRNAs; they and their targets are being analysed to confirm the hypothesis (Tubitak Project 114S367; Cıngır Köker et al. unpublished).
1.5. Expression Measurement Technologies
1.5.1. Microarray
Nowadays the information obtained from expression levels is very important for diagnosis and treatment of human diseases. Microarray is a chip-based technology to obtain the expression levels of molecules (mRNA, microRNA) simultaneously. The chip consists of a surface (glass or silicon), and genetic materials to differentiate different molecules. The array is 2D. The array technology has become popular in recent years 117. Different companies provide different chips as Affymetrix, Agilent, etc. 118.
1.5.2. qRT-PCR using Sybr Green
Real-time PCR or qRT-PCR is a quantification technology of RNA molecules when converted into cDNA and amplified in real-time in molecular biology. Fluorescent dyes (eg. Sybr Green) bind to cDNA are measured by a fluorescent detector at each cycle of the amplification by giving values for a process period and not just at the plateau level. Quantification cycle Cq is set for the log linear phase of the amplification process and they can be compared to obtain relative expression of an RNA in comparison with other RNAs and an internal standard. Primers can be designed for specific gene locations 119 while using housekeeping molecules as GAPDH 119 for genes and RNU6 120 for microRNAs.
1.6. In Silico Analysis by Using Expression Matrices
There are three main categories on analysing expression matrices results together: a) online tools, b) desktop tools, c) customized programming (R, matlab etc.). Online tools are most time saving and user-friendly although the choices are limited. Desktop tools give more detailed results, have more options to choose. They require more time but give
19
better results if there is a need for a deeper understanding. Programming is the best to develop a novel idea; however, it needs bioinformatics knowledge. In this section of introduction, I will briefly describe online tools that I have used to identify a) targets of hsa-mir-497; b) hsa-mir-497 target networks in HCC; and c) related pathways to a group of gene d) immune gene and microRNA networks in HCC. Among these tools; MSigDB
121, miRWalk 122, miRNet 123, MAGIA2 124 and MirTarVis 125, 126 are the most useful ones
as a guide for further in vitro experimental steps. 1.6.1. miRWalk
miRWalk 2.0 is a new version of miRWalk. In this tool, user does not need to load in any microRNA and mRNA expression data while he/she needs to upload a gene list or a microRNA list (or individual mRNA or microRNA name). After mRNA-miRNA network tools (e.g., MAGIA2) miRWalk 2.0 can be used to see if chosen microRNA-mRNA integration has been validated in the literature. Another option is to use predicted target search. It provides a new algorithm and also a chance to see targets from different predictors in a list. miRWalk 2.0 provides the information from 14 species in addition to human: monkey, chimpanzee, orangutan, rat, mouse, pig, chicken, dog, cow, opossum, fruit fly, zebrafish, worm and frog. There are two modules: validated and predicted. There are eleven predictors, predicting integration between mRNA and microRNA: mirDB 127,
PITA 128, microT4 129, miRMap 130, RNA22 131, miRanda 132, miRNAMap 133, RNAhybrid 134, miRBridge 135, PICTAR2 136 and TargetScan 137. For valid integrations, automated
text mining is the method combined with the data of existing programs: miRTarBase
138, PhenomiR 139, miR2Disease 140 and HMDD 141. Nearly fourteen thousand
publications, three thousand microRNAs, nineteen thousand genes and their 151.5 million relations are used in miRWalk. Five hundred forty-six pathways and twenty-eight protein classes and four hundred and fifty diseases are accessed by miRWalk 2.0 as related concepts of integrated mRNA-microRNA 122.
1.6.2. MAGIA2
MAGIA2 is one of the most useful and fast tools for mRNA-microRNA data integration and prediction. MAGIA2 was reconsidered and redesigned to improve the quality of the results by giving chance for more user defined options. MAGIA2 combines the results of
20
the different target predictors and detect better integrations. The organism content is bigger in MAGIA2 as human, rat, Drosophila and mouse microRNAs are included. MAGIA2 has a novel component since it identifies microRNAs and transcription factors that regulate microRNA-mRNA networks. MAGIA2 also has advantages over target prediction algorithms since it uses both the mRNA and microRNA data obtained from the same conditions (paired) or different conditions/experiments (unpaired). To use MAGIA2, ensemble IDs of genes and miRBase names of microRNAs are uploaded in the .csv files format for both microarray experiments. The tool gives the information on how many of the IDs in each file are valid among all IDs uploaded. Once files are uploaded, user can do analyses immediately or later since the data could be saved for later use. microRNA target prediction is done by using the knowledge of TF binding sites between microRNA and promoter of the target gene. Matched and unmatched samples can be used and depending on what kind of sample is used a different analysis method can be selected on the next step (i.e., Spearman Correlation, Pearson Correlation, Mutual Information or Analysis). When there are unmatched samples, sole analysis method is Meta-Analysis. microRNA-mRNA couples are found by using Inverse-Chi-Squared Distribution of differentially expressions p-values by LIMMA in Meta-Analysis. If gene and microRNA data are matched; there are three choices and the choice depends on the sample size. From small to bigger sample size, the order is as in the following lines: Spearman Correlation is used for three to 5 samples; Pearson Correlation is for more than five samples; Mutual Information is used for bigger data (more than twenty samples). There are differences between these three methods. Spearman Correlation is a non-parametric while Pearson is a non-parametric method; Spearman uses rank-based linear correlation and it is useful when the data do not have normal distribution inversely to Pearson Correlation. Mutual information method is again for non-linear relations and mutually dependent variables. The tool gives the user a warning when uploaded data and the analysis method don’t match to each other. The next step is to choose a target predictor: DIANA microT 129, TargetScan 137, Pita 128, Microcosm 142, PicTar 143, mirDB
127, RNA22 144 and microrna.org 126. There is a possibility to choose more than one
predictor. For each target predictor, one should decide on the stringency of the prediction and produce more than one list which are then combined by a Booleand operator. User gives a name to each analysis and the results are saved on MAGIA2. MAGIA2 results in not only the network but also text files that contain downloadable lists of interactions. The result figure gives 200 best interaction depend on the options chosen between TFs,
21
genes and microRNAs. There is a direct link to DAVID for functional enrichment. For only matched samples, positive or negative correlation can be distinguished by the colour of the arrow between hubs (red arrow: positive correlation, blue arrow: negative correlation). TFs, microRNAs and target genes can be distinguished by the shape and the colour of the hubs (TF: Green circle, target genes: blue circle, microRNA: orange triangle). Direction of the arrow states which regulates which molecule 124.
1.6.3. MSigDB
The Molecular Signatures Database is a database which has more than ten thousand gene sets which are divided collections as: hallmark, curated, positional, computational, GO, motif gene sets and oncogenic, immunologic signatures. Gene set enrichment analysis use MSigDB. In “Investigate Gene Sets” option you can import a set of gene names and get the most related pathways, diseases or molecular function kind of information about the group of gene which you load. It directs the search by showing the most common feature of a group of gene 121.
1.6.4. MiRNet
Previously done microRNA studies guide the new studies on commenting and analysing statistically in miRNet 123. In the tool the input options are various: gene set, microRNA
set, microarray, RNA seq, lncRNA, small molecule, disease, epigenetic modifier or RT-qPCR. Eleven databases, three differential analysis and two enrichment analysis methods are used. It is more of an improved online tool (resembles a desktop tool) with options of different input types, analysis methods and last step modifications on downloaded images. Zooming and different network styles are allowed. For example, when there is a network, members of network can be analysed depending on the function and then can be coloured 123. MiRNet can be used to get experimental targets of a given microRNA or microRNAs bind to a list of mRNAs modulated at the same time.
1.6.5. MirTarVis
MirTarVis is one of the desktop tools to make the mRNA-microRNA microarray integration analysis. There are four steps in MirTarVis analysis: data loading, filtering the data separately, integrated mRNA-microRNA prediction and visualization. First step asks
22
the kind of file to be uploaded because there are different choices: paired/unpaired, expressions for each sample/ directly fold changes and p-values, multi sample, RNA-seq and miRNA-seq type. Files should be .csv, microRNA names should be miRBase IDs and gene names should be gene symbols. First step should be downloading of the tool. The folder provides tool “miRTarVis.jar” and example input files for different data (multiple samples/ paired two sample/ unpaired two sample / p value and fold-change). At least Java Runtime Environment 7+ and 1280*720 screen resolution is required. After files are arranged as in the example input files which are provided inside of the downloaded folder, they directly uploaded without filtration. Analysis starts with the filtration separately on microRNA or mRNA and filtering may depend on p-value, fold change or both in the tool. User decides on the cut-off value (e.g. p < 0.05). Prediction is the third step after filtration. MirTarVis uses 2 algorithms for the prediction which depend on sequences: TargetScan 137 and microrna.org 126 and 4 algorithms which depend on expression: Correlation Analysis, MINE, Mutual Information and GenMiR. Correlation Analysis is the simplest and the best working one among them. Information of which resource or which species, and how many interactions from top are seen are decided by the user. Additionally, correlation (positive or negative) and direction of the change can be chosen before starting the analysis. Negative correlation could be selected when a microRNA targets a gene because the presence of this microRNA blocks the expression of that particular gene. The list composed of mRNA fold change, mRNA ID, microRNA ID, mRNA p- value, microRNA fold change, microRNA p-value and the correlation value cannot be downloaded but can be copied. Visualization is the last step containing two different visualization methods: Node Link Diagram or Treemap. Node Link Diagrams are done by different algorithms (ISOM layout, KK layout, Circle layout, force directed layout). The images are colour coded and able to edit. 125.
23
Chapter 2. Aim
The aims of this thesis are multifold:
1) To understand the relationship between mir-497-5p and CHRNA5/cancer a) identify mRNA targets of mir-497-5p and b) analyse the functional enrichment of mir-497-5p using MSigDB tools.
2) To test by qPCR a) whether mimic mir-497 modulates expected targets obtained in above aim in MCF7 cells and b) whether, CHRNA5, a previously identified regulator of mir-497-5p modulates the expression of mir-497 family in MCF7; c) whether, mimic alone or mimic together with CHRNA5 siRNA modulates selected targets and d) whether chromosomal location of mir-497-5p has any effect on its expression and expression/regulation.
3) To understand the relationship between mir-497-5p and immune system a) filter the immune gene set from GSE41074 and make mRNA-miRNA network for specific immune genes b) to test immune microRNAs by qPCR.
4) To analyse mimic treated cancer samples (GSE41079 and GSE41079) in silico a) for a general understanding of mimic-mir-497 impacts on mRNAs and microRNAs in HCC by using mRNA-microRNA integration tools (MAGIA and MIRTARVIS) b) to compare Ago2-IP and Total RNA results and mimic-mir195 and mimic-mir-497 results.
24
Chapter 3. Materials and Methods
3.1. In Silico Analysis3.1.1. Msigdb, MiRWalk, miRNet
MSigDB: “Investigate Gene Sets” option was used. The genes uploaded were obtained from GSE41074. After log2 fold changes were found by subtracting non-treated samples from mimic treated samples, the log2 fold change values are sorted for each treatment. Total RNA mimic-mir-497 treatment and Ago2-IP mimic-mir-497 treatment results were used. 0.5 and -0.5 are limits for log2 fold change. Upregulated genes and downregulated genes by these treatments were taken as 4 groups: Total RNA mimic-mir-497 treated samples upregulated genes, Total RNA mimic-mir-497 treated samples downregulated genes, Ago2-IP mir-497 treated samples upregulated genes and Ago2-IP mimic-mir-497 treated samples downregulated genes. When one of the groups were loaded with the gene identifiers REACTOME was chosen under “Compute Overlaps” and significant 50 pathways were found in order of significance.
MiRWalk: miRWalk 2.0 tool was used to get the information about validated/predicted targets of microRNAs. To find predicted targets of mir-497-5p candidate genes’ official gene symbols were uploaded in “Predicted Target Model (Gene-miRNA Targets)” of miRWalk. There are 12 target-predictors and all of them were chosen for each gene. The result was analysed to see if mir-497-5p targeted the candidate gene or not by how many predictors.
miRNet: It gives information of validated targets of microRNAs in a network. Moreover, genes can be grouped by looking for features of targets as pathways that the genes were involved. Mir-497-5p was uploaded and target genes were shown. Selections were human (organism), miRBase ID (ID type), Genes (target type). Without any filtering there were many genes, therefore most related pathways to mir-497-5p were chosen to focus on. Pathways were found by KEGG/REACTOME by hypergeometric test of all target genes. To find which microRNAs are related to CHRNA5 mRNA was chosen by selection human (organism) and official symbol (ID type). There were just three microRNAs so no further limitation was needed.
25 3.1.2. MAGIA2
There is a need for two files: mRNA and microRNA with same treatments. GSE41079 and GSE41074 consisted mRNA and microRNA arrays for Ago2IP samples for same treatments (mimic-mir-497 and non-treated sample). Data should be put as a tab delimited text file with sample names and gene/microRNA ID in the first column. “Homo sapiens” was chosen as organism. Target predictor was chosen as TargetScan, correlation method was Spearman and there was no limitation on data. There was no mandatory sample name but the order should be same for both files. Ensembl ID or Entrez gene ID can be used for mRNAs and mirBase names are used for microRNAs. Sample file format was as in Table 3.1.
Table 3.1: File format for gene and microRNA data in MAGIA.
3.1.3. MirTarVis
The first step was to arrange data suitable to upload into the tool. There had to be two files should be uploaded before starting analysis: microRNA and mRNA. There were two choices to make if expression values were uploaded directly: unpaired analysis and paired analysis. Column names labelled differently when it is paired or unpaired. Column names of paired analysis were 0_pre, 0_post 1_pre, 1_post… Pre and post meant two different conditions as tumour vs. normal samples. Paired values were near to each other in paired analysis. Unpaired analysis did not need pre and post values near to each other because they were not paired they cannot match to each other. The first column started with “1_” and columns continue as 2, 3, 4… Both files contained columns with the same name and the same sample at the same location.
gene id C C C T T T ENSG... microRNA id C C C T T T hsa-mir-...

![Başlık: “A[u]gmenter of Their Kingdome”: Goffe’s The Couragious Turke, or, Amurath the First as a Christian Tragedy based on Knolles’ The Generall Historie of the TurkesYazar(lar):GÜVENÇ, Sıla ŞenlenSayı: 28 Sayfa: 049-063 DOI: 10.1501/OTAM_0000000555 Yay](data:image/gif;base64,R0lGODlhAQABAIAAAP///wAAACH5BAEAAAAALAAAAAABAAEAAAICRAEAOw==)