Ücret, Kariyer, İş Tatmini ve
Performans Arasındaki İlişkiler:
Karaman Valiliğinde Bir
Uygulama
Relations Between Pay, Career,
Job Satisfaction And
Performance: An Application In
Karaman Governorship
Hasan GÜL* Ercan OKTAY**
ÖZET
Bu çalışma kamu kurumlarında çalışan memur ve yöneticilerin ücret beklentileri ve kariyer olanakları ile iş tatmini ve performans arasındaki ilişkileri araştırmak amacıyla planlanmıştır. Ayrıca yaş, kıdem ve cinsiyet gibi demografik özelliklerin söz konusu değişkenler üzerindeki etkileri de incelenmiştir. Literatürdeki veriler ışığında bir araştırma modeli meydana getirilerek değişkenler arasındaki ilişkiler test edilmiştir. İlişkileri test etmek için faktör, güvenilirlik, korelasyon, t-testi, anova ve regresyon analizleri kullanılmıştır. Araştırmanın verileri Karaman Valiliğinde görev yapan 116 çalışandan toplanmıştır. Araştırma sonucunda demografik özelliklerden sadece eğitim düzeyinin çalışanların ücret, kariyer, iş tatmini ve performans düzeylerini farklılaştırmakta olduğu bulgusuna ulaşılmıştır.
Anahtar Kelimeler: İş tatmini, Kariyer, Ücret, Performans ve Demografik özellikler. Çalışmanın Türü: Araştırma
ABSTRACT
This study is planned in order to clarify the relations between job satisfaction and performance with pay expectations and career opportunities of public servants and managers in state organizations. Today one of the vital problems in organizational and social life is the dissatisfaction employees feel from their work inevitably [requiring higher focusing] on human factor. Within this context job satisfaction presents importance both for public and private sectors.
Job satisfaction reflects the reactions of employees towards the work or [at least] to a part of the work. Job satisfaction exists when employee expectations and what they face match with one another. Job satisfaction increasing the contentment of the employee, additionally leads to his/her loyalty to his/her work, productivity, minimization of imperfect and faulty product, and turnover within the organization.
Main demographic features employed in similar studies are the age, sex, education level, and seniority.
Age: Age of persons is one significant feature effecting their attitude and behavior towards their work. Individuals are
classified as young, middle aged and old people based on their age terms. In literature the general idea is that different age terms affect job satisfaction levels in different ways.
Sex: Among the demographic features sex is the most attractive one subjected to vast research for in social life the
differentiating function, statute and roles trusted to fit men and women reflects to work life.
Education Level: This is an important factor affecting approach and expectations towards work life. Pay, job satisfaction,
and working conditions are factors included within the expectations of individuals with higher education levels.
Seniority: Seniority is an indication of the time spent at work. People working a long on the same job are expected to have
higher job satisfaction related to those just started.
Marital Status: Job satisfaction levels of married employees are higher than that of single. In a study conducted by Yılmaz
and Işık (2004: 100) “over 755 employees in 14 factories at the Manisa Organize Industry Zone the job satisfaction levels of singles are found to be far less than that of the bachelors”.
Pay is one highly significant concern in work life affecting all concerning parties. While pay is an issue affecting income and life standards for employees, it stands as an important cost factor in the case of employers and management.
Job satisfaction is affected by pay, work itself, [quality of] supervision, work group and conditions. “Erdoğan (1999: 236) referring to Sabuncuoğlu and Tüz indicates that high pay, sufficient promotion possibilities, positive communication with the peers, [appointment to] different posts, work methods, and control are among the factors affecting job satisfaction (Sabuncuoğlu et al. 1998: 118)”.
Individuals in general hope to be successful in their work and climb up to higher levels in organization by promoting. Promotion while increasing the pay affects the social statutes of employees in a positive manner. In general performance is defined as the degree of realization of a goal. According to another definition performance is a concept indicating the degree of reaching to a target aimed by such work in a qualitative and quantitative manner either by a person, a group or an organization.
The purpose of this study conducted on the public servants and managers in Karaman governorship is to determine the relations between pay, career, job satisfaction and performance. Out of 150 questionnaires distributed 116 returned and evaluated. Accordingly the return rate of the questionnaires is 77,3%.
* Yrd. Doç. Dr., Karamanoğlu Mehmet Bey Üniversitesi ** Yrd. Doç. Dr., Karamanoğlu Mehmet Bey Üniversitesi
To measure job satisfaction Job Satisfaction Scale with 14 questions developed by Hackman and Oldham is used. Despite that performance is measured through a scale including 4 expressions of Sigler and Pearson (2000) that they get from Kirkman and Rosen (1999). Subsequently, evaluation is made with data consisting of 25 questions and supplied through of that prepared over a five-point Likert scale with a SPSS 11.0 statistical software program. In order to test the relations between the variables in the research model factor, reliability, correlation, regression, T-test and single factor variance (Anova) analyses are used.
In this study hypothesis given below are tested.
H1: Pay, career, job satisfaction, and performance levels differentiate according to the sexuality of the workforce. H2: Pay, career, job satisfaction and performance levels differentiate according to the education levels of the workforce. H3: Pay, career, job satisfaction and performance levels differentiate according to the seniority of the workforce. H4: Pay, career, job satisfaction and performance levels differentiate according to the marital status of the workforce. H5: Pay, career, job satisfaction and performance levels differentiate according to the age of the workforce.
H6: There is a positive correlation between the pay expectations and the job satisfaction. H7: There is a positive correlation between the career expectations and the job satisfaction. H8: There is a positive correlation between the pay expectations and performances.
H9: There is a positive correlation between the career expectations and performances of the workforce. H10: There is a positive correlation between the job satisfaction and performances.
This study examines:
• Relations between the sex, marital status, education level, age and seniorities of employees and pay, career, job satisfaction and performance,
• Relations between pay and career, and job satisfaction, • Relations between pay and career, and performance, • Relations between job satisfaction and performance.
Study indicates that merely the education level as a single demographic characteristic differentiates the pay, career, job satisfaction, and performance levels of employees, where it stands to be indifferent in that of the sex, age, marital status and seniority.
Contrary to the literature relating to job satisfaction this study conducted in the Karaman governorship concludes that there is no meaningful relation between pay expectations and career possibilities, and job satisfaction. Yet the same study indicates a positive relation between career and performance parallel to that in literature. Separately, it also justifies the same in case of job satisfaction and performance.
Keywords: job satisfaction, career, pay, performance, and demographic characteristics. The Type of Research: Research
INTRODUCTION
Today one of the vital problems in organizational and social life is the dissatisfaction employees feel from their work inevitably [requiring higher focusing] on human factor. Within this context job satisfaction presents importance both for public and private sectors (Serinkan et al. 2007: 153).
In contemporary business environments employees have distinct work attitudes. A significant one of these attitudes is the job satisfaction. Job satisfaction reflects the reactions of employees towards the work or [at least] to a part of the work. Job satisfaction exists when employee expectations and what they face match with one another (Eroğlu 2000: 251). In other words, job satisfaction realizes when needs, wants and values of the employees matches with the job (Erdoğan 1999: 231-232).
Job satisfaction increasing the contentment of the employee, additionally leads to his/her loyalty to his/her work, productivity, minimization of imperfect and faulty product, and turnover within the organization (Türk et al. 2003: 2; Baysal et al. 1996: 281; Quarstein et al. 1992: 860). To the contrary, meaning when there is no job satisfaction, high turnover, absenteeism, tendency in leaving the job, alienation, stress, damage to machinery and devices, mental and somatic disorder, and falls in productivity increases, beyond the weakening of organizational adherence (Baysal et al. 1996: 281; Şimşek et al. 2001: 137). Research indicates that employees with high job satisfaction live longer, are healthier, more content, more philanthropic, more reliable, less criticizing, and skeptical (Paksoy 2007: 140). The purpose of this study is to develop a theoretical model that will explain the effects of satisfaction or dissatisfaction they get from the pay levels and career possibilities on their job satisfaction and performances, besides contributing to the generalizations to date by examining relations between mentioned variables within the framework of the model created through a field survey conducted in the public sector.
1. JOB SATISFACTION CONCEPT AND ITS IMPORTANCE
Studies relating to the job satisfaction go back to 1930s. Job satisfaction concept depending on the feelings of employees towards their work is first discussed in 1920s, despite its importance is understood within the years 1930-1940 (Agho et al. 1993: 1007).
Job satisfaction is a multidimensional fact. In general, job satisfaction is believed to have a relation with dimensions such as pay, harmony with manager and colleagues, and chance to advance that are directly concerned with the work. While there is consensus on the direct relationship of each of these dimensions with job satisfaction, the definition of the job varies from one person to the other.
Job description in its simplest means is the positive emotional situations existing as a result of the evaluation of work experiences of an employee. Job dissatisfaction occurs when such expectations do not realize. As an example, an employee will possibly feel job dissatisfaction if facing with a dirty, unsanitary, and dangerous workplace while expecting a sanitary, clean and secure one.
In literature it is possible to meet a large number of job satisfaction definitions. Some of these are indicate below:
• Job satisfaction is the emotional reactions by employees towards their work (Weiss 2002: 174). • Job satisfaction is a fact that determines the pleasure of an employee from his work actualizing when the characteristic of the work coincides with the wants of the employee (Akıncı 2002: 2-3).
• Job satisfaction as accepted to be a degree of the pleasure an employee gets from his/her work, is a concept deemed to be significant in determining the reactions of the employees towards their work in organizational activities (Yüksel 2005: 293).
• The pleasure of employees from their work and workplaces, or, their positive attitudes towards work is defined as the job satisfaction, [while] their displeasure to work and the workplace, or, negative attitudes to that is defined as the job dissatisfaction (Tütüncü 2000: 1).
• Job satisfaction is a symptom of the mental and somatic hygiene of the employees (Bingöl 1997: 220).
• Job satisfaction is an indication of the physical and mental wellness of the employee (Oshagbemi 2000: 88).
• According to Conrad, Conrad and Parker job satisfaction is the comparison of job expectancies of an employee with his/her benefits that he/she get from his work (Burnard et al. 1999: 9).
• Job satisfaction is the naming of emotional reaction resulting from the comparison of his/her wants and what he/she gets from his/her work (Samad 2006: 113).
Common point of all those definitions mentioned above are based on the satisfaction individuals get from the work that they do. Accordingly, the satisfaction from the work depends on the matching levels of expectancies with rewards provided (Çağlar 2005: 155).
The close relationship between the job satisfaction and provision of positive results towards the work makes the subject even more crucial. “According to Luthans (1995: 3) job satisfaction has three vital dimensions. It is a concept mainly based on emotions. Because it could merely be felt yet not seen:
• Job satisfaction in general is affiliated with the level of matching of the output with expectancies. • Job satisfaction drags a large number of attitudes such as work, pay, promotion, friendship”. 2. JOB SATISFACTION AND DEMOGRAPHIC FEATURES
Main demographic features employed in similar studies are the age, sex, education level, and seniority. For the study is based on relations between job satisfaction and performance a brief explanation on such features are given below:
Age: Age of persons is one significant feature effecting their attitude and behavior towards their work. Individuals are classified as young, middle aged and old people based on their age terms. In literature the general idea is that different age terms affect job satisfaction levels in different ways (Güven et al. 2005: 134). The job satisfaction levels of aged and senior persons are higher than those young and having less seniority (Scott et al. 2006: 528).
Increase in age decreases alternative job possibilities. Accordingly that makes the present job more attractive for the aged. “Bowen, Randhakrishna and Keyser (1994: 5-9) comments that the age factor affects the job satisfaction in a positive way, where job experience, seniority and education also have a similar influence on it”.
Sex: Among the demographic features sex is the most attractive one subjected to vast research for in social life the differentiating function, statute and roles trusted to fit men and women reflects to work life (Çarıkçı et al. 2004: 159; Güven et al. 2005: 132). “Chusmir and Parker (2001: 96) indicate that the success criteria of men and women in life are not alike. According to these researchers while women concentrate on personal and family satisfaction beyond security, have less concern for job satisfaction features”.
A study on male employees indicates that their family life affects the work life independent from the career. The findings of the research show that their job satisfaction falls to a great extend when having problems in family life (Dodson et al. 2006: 6).
According to the results of a research conducted in Turkey by Ardıç (www.bilgiyonetimi.org) the job satisfaction of the female workforce shows to be higher than that of the males. Keser (www.paradoks.org) performing a similar one on academic personnel concluded that there is no meaningful difference between sex and employee satisfaction.
Education Level: This is an important factor affecting approach and expectations towards work life. Pay, job satisfaction, and working conditions are factors included within the expectations of individuals with higher education levels.
Seniority: Seniority is an indication of the time spent at work. People working a long on the same job are expected to have higher job satisfaction related to those just started (Güven et al. 2005: 132; Özgen et al. 2001: 331).
Marital Status: Job satisfaction levels of married employees are higher than that of single (Scott et al. 2006: 528). In a study conducted by Yılmaz and Işık (2004: 100) “over 755 employees in 14 factories at the Manisa Organize Industry Zone the job satisfaction levels of singles are found to be far less than that of the bachelors”.
3. PAY
Pay is one highly significant concern in work life affecting all concerning parties. While pay is an issue affecting income and life standards for employees, it stands as an important cost factor in the case of employers and management (Güven et al. 2005: 131).
As justified by research pay directly affects job satisfaction (Lam 1995: 73; Emmert et al. 1992: 37-48). The attitude of the employee towards work is determined by the sufficiency of pay and level of reaching needs. More “just” and “higher the degree of meeting expectancies” of the pay system, more affected the job satisfaction in a positive manner (İmamoğlu et al. 2004: 169-170). There is vast research on pay dissatisfaction of employees leading to falls in performance, high turnover, and job dissatisfaction (Güven et al. 2005: 131).
Job satisfaction is affected by pay, work itself, [quality of] supervision, work group and conditions (Baysal et al. 1996: 279). “Erdoğan (1999: 236) referring to Sabuncuoğlu and Tüz indicates that high pay, sufficient promotion possibilities, positive communication with the peers, [appointment to] different posts, work methods, and control are among the factors affecting job satisfaction (Sabuncuoğlu et al. 1998: 118)”. Same researcher in a different study found out that the general appearance and hardness of work, pay, promotion opportunities, just rewarding, human relations, social prestige of the organization, working conditions and job security are the main elements in determining the job satisfaction.
In a study conducted by Lum and others (1998: 6) on nurses it is concluded that there is a positive correlation between their contentment in pay and satisfaction levels. A similar study by Güven and others (2005: 127-151) based on 210 employees in the textile sector in Kahramanmaraş a positive and meaningful relation is found between pay level and job satisfaction. Research indicates that job satisfaction levels of employees increases in parallel with increases in their pay levels.
4. CAREER
Individuals in general hope to be successful in their work and climb up to higher levels in organization by promoting. Promotion while increasing the pay affects the social statutes of employees in a positive manner. (Bozkurt et al. 2008: 6). Career is defined as the climbing of an individual up the success stairs one by one and in a steady way in his/her work life. There is a tight relation between the career opportunities submitted by the organization and job satisfaction.
Research verifies that delays in moving up career stairs affect job satisfaction in a negative way. Employees unable to reach up higher in hierarchy despite deserving promotion have lower job satisfaction levels (Savery 1996: 18-26). However, it is should be remembered that job satisfaction is a factor that can change from one person to the other. For instance while career opportunities is happening to be a primary satisfaction factor for an individual, for another this could be the pay factor (Örücü et al. 2006: 40).
5. PERFORMANCE
In general performance is defined as the degree of realization of a goal. According to another definition performance is a concept indicating the degree of reaching to a target aimed by such work in a qualitative and quantitative manner either by a person, a group or an organization (Çöl 2008: 39). In this case there is a tight and direct connection between the performances of employees and organizational performance. Yet the performance of employees depends on their satisfaction with their work.
Employees spend most of their daytime in the workplace. Thus, fulfillments of their expectations with their work and workplace have psychological and economic affects and results on them (Bakan et al. 2004: 6).
Performance is a concept that is considered in a large number of research concerning with organizational loyalty, job satisfaction and job leaving tendency. In organization literature while it is assumed that there is a relation between job satisfaction and performance, findings that support the existence and direction of such relationship in a consistent way are cannot be reached (Yüksel 2002: 69). Job satisfaction arises when a work ends in a successful manner and individual value, expectations and standards are reached. Researchers and practitioners overvalue job satisfaction for its positive contribution to the performance and loyalty of employees (Gordon 1999: 67). In order the relationship between the job satisfaction and performance to be meaningful supportive elements such as reward expectations and equality feelings are necessary beyond employee’s personal characteristics. Employees with higher job satisfaction levels are expected to exhibit higher performances in relation to those that have lower job performances (Akıncı 2002: 8).
6. PURPOSE AND METHOD OF THE RESEARCH
The purpose of this study conducted on the public servants and managers in Karaman governorship is to determine the relations between pay, career, job satisfaction and performance. Out of 150 questionnaires distributed 116 returned and evaluated. Accordingly the return rate of the questionnaires is 77,3%.
Survey is the method employed in this study. Care is extended in the appropriateness of the number, design and application of questionnaire forms to generally accepted rules and format. In the study a scale consisting of three questions to measure pay, and another consisting of four questions to measure career is used. Questions used to measure pay and career are supplied from a research conducted by İmamoğlu and others in 2004 (İmamoğlu et al. 2004: 167-176).
To measure job satisfaction Job Satisfaction Scale with 14 questions developed by Hackman and Oldham is used. Despite that performance is measured through a scale including 4 expressions of Sigler and Pearson (2000) that they get from Kirkman and Rosen (1999). Subsequently, evaluation is made with data consisting of 25 questions and supplied through of that prepared over a five-point Likert scale with a SPSS 11.0 statistical software program. In order to test the relations between the variables in the research model factor, reliability, correlation, regression, T-test and single factor variance (Anova) analyses are used.
Figure 1. Research model
Research model is indicated in Figure 1. As indicated the research model is designed to exhibit the relations of pay and career both to job satisfaction and performance.
In this study hypothesis given below are tested.
H1: Pay, career, job satisfaction, and performance levels differentiate according to the sexuality of the workforce. H2: Pay, career, job satisfaction and performance levels differentiate according to the education levels of the workforce. H3: Pay, career, job satisfaction and performance levels differentiate according to the seniority of the workforce. H4: Pay, career, job satisfaction and performance levels differentiate according to the marital status of the workforce. H5: Pay, career, job satisfaction and performance levels differentiate according to the age of the workforce.
H6: There is a positive correlation between the pay expectations and the job satisfaction. H7: There is a positive correlation between the career expectations and the job satisfaction. H8: There is a positive correlation between the pay expectations and performances.
H9: There is a positive correlation between the career expectations and performances of the workforce. H10: There is a positive correlation between the job satisfaction and performances.
7. VALUATION OF RESEARCH FINDINGS
7.1. Factor Loads: Factor analyses relating to variables used in the research are given in tables below. A strong factor structure is supplied through the factor analyses performed upon variables concerned with work satisfaction. This situation indicates that the questionnaire used to measure work satisfaction consist a whole and loaded to variables as expected.
Table 1. Factor Analyses Results FACTORS
QUESTIONS
1 2 3 4
WORK SATISFACTION
1. My work helps me to have a confident future. ,671 2. This work provides me sufficient pay and chance to promote. ,625 3. My work provides me personal progress and promotion. ,715 4. I’m in harmony with my peers and people I’m in connection with. ,660 5. Managers are just and respectful to all employees. ,737 6. I always feel that I’m appreciated when doing my work. ,511 7. I have the chance to know my business companions in a more close way. ,611
8. My manager supports and guides me. ,649
9. I believe that the pay I get for my work is just. ,683 10. I have the chance to exercise my independent thoughts and behavior in my work. ,577 11. My workplace permits me to realize my future expectations. ,719 12. I have the chance to help my business companions in my workplace. ,588 13. I have the chance to compete in my workplace. ,640 14. Attitude of the management in my workplace is positive. ,658
PERFORMANCE
1. I complete my work in time. ,797
2. I can overreach my targets in my work. ,839
Career
Job satisfaction Performance
3. I’m sure that I overreach the standards against the quality of service I supplied. ,840 4. I can reach ready solutions whenever a problem shows up. ,825
PAY
1. I’m satisfied with the pay I get for my work. ,903
2. I believe that the pay policy in this workplace is just and balanced. ,906 3. I believe that my pay is high related to similar jobs in similar workplaces. ,810
CAREER
1. I have the chance to promote in my workplace. ,915
2. I’m content with the success in my career. ,843
3. I’m satisfied with the chances of promotion in my workplace. ,908
4. I’m happy with the pay I get. ,859
Revealed Cumulative Variable Percentages 63,175 68,159 76,406 77,788
Table above indicates the results of factor analyses supplied through varimax rotation. Figures provided by the analyses shows that the variables in each group are in correlative harmony with one another, forming a meaningful group. This indicates that the criteria and variables used are suitable, consistent and valid in content.
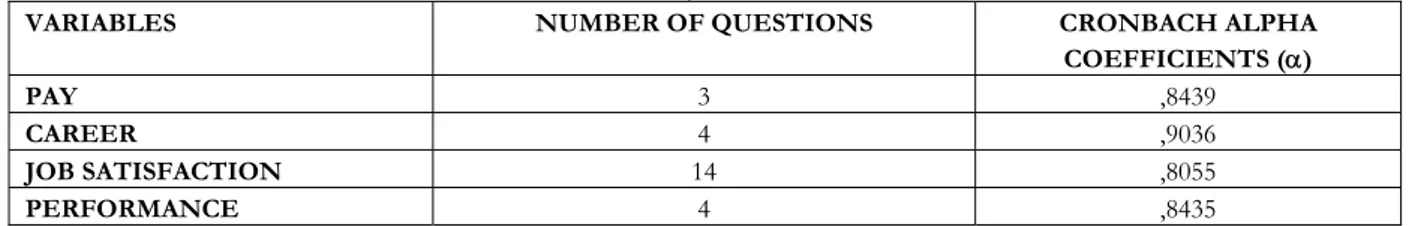
7.2. Defining Statistics Relating to Variables and Correlation Analyses: In this research where similar studies in literature are considered in determining the reliability of criteria Cronbach α value assumed to be the most popular reliability measure is used. In reliability analysis where changes in criteria as a result of the factor analyses are considered α coefficients of each variable are taken into account. Accordingly, related variables and Cronbach α coefficients are given in Table 2 below.
Table 2. Reliability Indicators of Variables
VARIABLES NUMBER OF QUESTIONS CRONBACH ALPHA
COEFFICIENTS (α)
PAY 3 ,8439
CAREER 4 ,9036
JOB SATISFACTION 14 ,8055
PERFORMANCE 4 ,8435
As could be seen from Table 2 the Cronbach Alpha reliability analyses of each variable are conducted in SPSS where their reliabilities are found between 0.80 and 0.90. Consequently, the reliabilities of all variables show to have acceptable values over 0.70 Cronbach α level.
The Pearson correlation coefficients, means, standard deviations and correlation values of the variables are calculated for correlation analyses. Such analyses indicate that there is a correlation between the variables as shown in Table 3 below.
Table 3. Correlation Analyses
VARIABLES MEANS STD. DEV. 1 2 3 4 Work Satisfaction 3,1244 ,66026 α: ,80 Career 2,8039 1,15005 ,120 α:,90 Pay 2,4540 1,08872 ,066 ,788** α:,84 Performance 3,4145 1,01632 ,154 ,539** ,463** α:,84 ** meaningful at p<0.01 level
Correlation analyses indicate that the performance is correlated with career and pay at 0,01 meaningfulness level. Additionally, it is found that there is a positive correlation between pay and career at 0,01 level, while no correlation could be found among work satisfaction and performance.
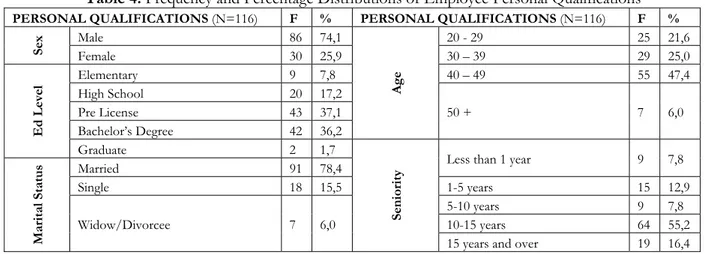
7.3. Demographic Characteristics, Anova and T-Tests: Percentage and frequency methods are used in order to determine the demographic characteristics of the employees parting in the research. To make a comparison between the governorship employees in work satisfaction, pay, career and performance level according to their sexes this is followed by a t-test. A one-way anova test is performed to determine the data concerning the comparison of the variable based levels of employees with their education levels, marital status and seniority.
Table 4. Frequency and Percentage Distributions of Employee Personal Qualifications
PERSONAL QUALIFICATIONS (N=116) F % PERSONAL QUALIFICATIONS (N=116) F %
Se x Male 86 74,1 Age 20 - 29 25 21,6 Female 30 25,9 30 – 39 29 25,0 Ed Level Elementary 9 7,8 40 – 49 55 47,4 High School 20 17,2 50 + 7 6,0 Pre License 43 37,1 Bachelor’s Degree 42 36,2 Graduate 2 1,7 Se niority
Less than 1 year 9 7,8
Marital Sta tus Married 91 78,4 Single 18 15,5 1-5 years 15 12,9 Widow/Divorcee 7 6,0 5-10 years 9 7,8 10-15 years 64 55,2
15 years and over 19 16,4 Table 4 indicates an evaluation of the demographic specifications of employees parting the research. Results show that the 74% (n=86) of employees are male while 25,9% (n=30) are female. When education levels of participants are evaluated within the same table these figures are 7,8% (n=9) for the elementary grade, 17,2% (n=20) for the high school grade, 37,1% (n=43) for the pre license, 36,2% (n=42) for the bachelor’s degree, and finally 1,7% (n=2) for the graduate degrees.
While 78,4% of the participants are married, 15,5% are single, and 6,0% are divorcees and widows. According to the same table seniorities of employees are in percentages are 7,8% (n=9) for those less than a year, 12,9% (n=15) for those between 1-5 years, 7,8% (n=9) for those between 5-10 years, 55,2% (n=64) for those between 10-15 years and 16,4% (n=19) for those between 15 years and over. Finally according to age as an other demographic quality 21,6% of these are between 20-29, 25% between 30-39, 47,4% between 40-49, and 6% 50 years and over.
Evaluation regarding to demographic qualifications indicates that in general employees according to sex consist mostly of males, in education basis consist mostly of university graduates, and over ten years of seniority depending on their time at work. This shows that the employees are both experienced and educated people.
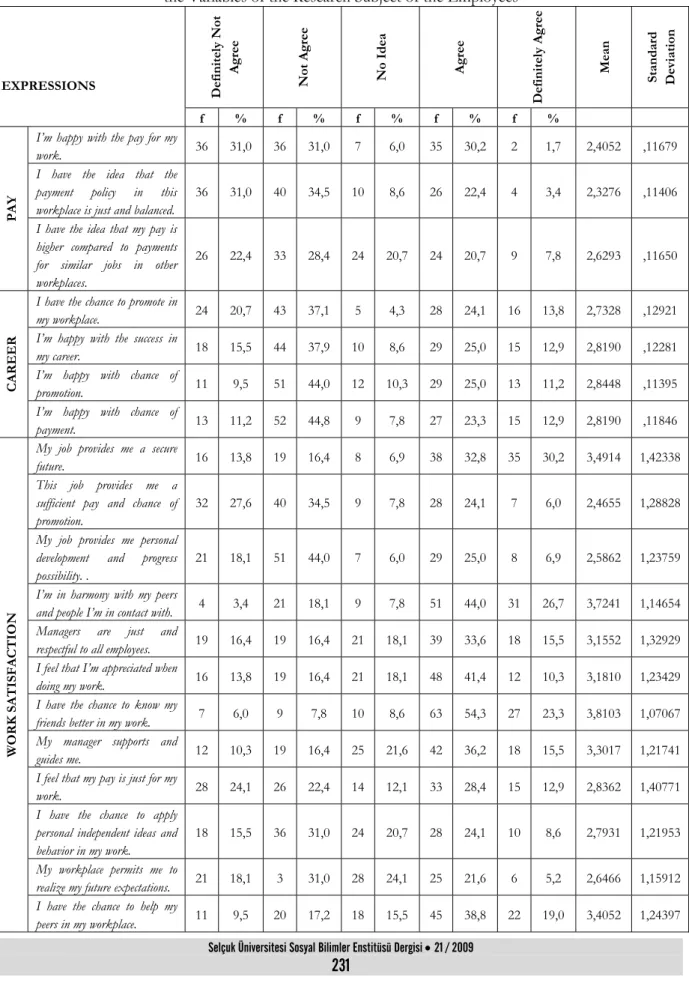
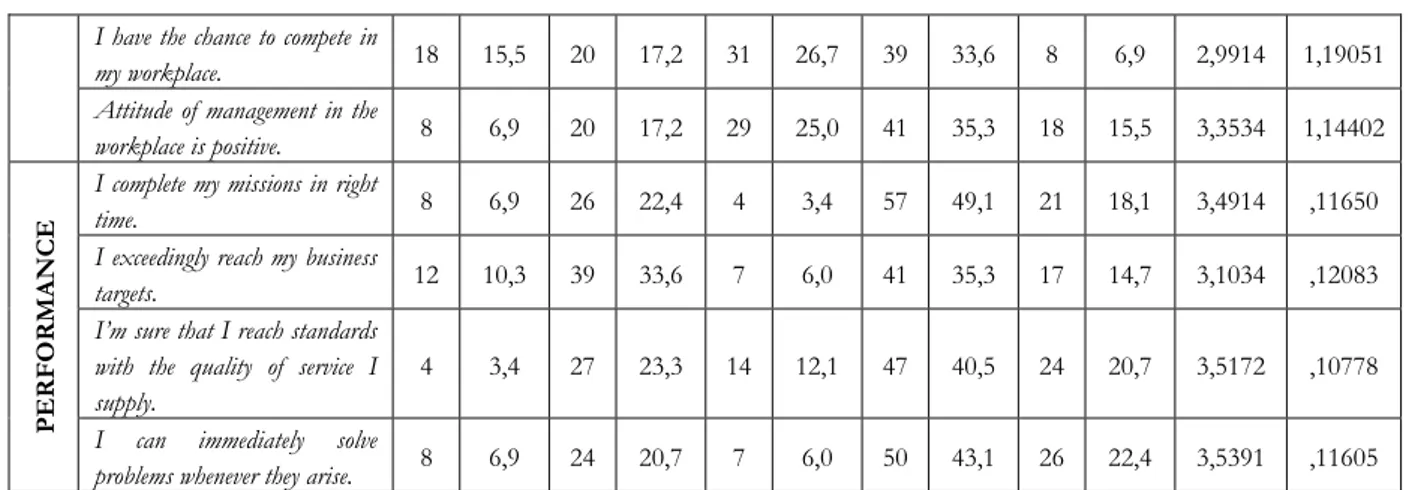
Values relating to percentages, frequency distributions, arithmetical averages and standard deviations supplied from the questionnaires relating to payment, career, job satisfaction and performance variables of employees of the governorship participated in survey are given in Table 5.
Table 5. Percentages, Frequency Distributions, Arithmetic Means and Standard Deviation Relating to the Variables of the Research Subject of the Employees
EXPRESSIONS Definitel y Not Agr ee Not A gree No I dea Agr ee Definitel y Agre e Me an Standa rd Deviation f % f % f % f % f % PAY
I’m happy with the pay for my
work. 36 31,0 36 31,0 7 6,0 35 30,2 2 1,7 2,4052 ,11679
I have the idea that the payment policy in this workplace is just and balanced.
36 31,0 40 34,5 10 8,6 26 22,4 4 3,4 2,3276 ,11406 I have the idea that my pay is
higher compared to payments for similar jobs in other workplaces.
26 22,4 33 28,4 24 20,7 24 20,7 9 7,8 2,6293 ,11650
CAREER
I have the chance to promote in
my workplace. 24 20,7 43 37,1 5 4,3 28 24,1 16 13,8 2,7328 ,12921
I’m happy with the success in
my career. 18 15,5 44 37,9 10 8,6 29 25,0 15 12,9 2,8190 ,12281
I’m happy with chance of
promotion. 11 9,5 51 44,0 12 10,3 29 25,0 13 11,2 2,8448 ,11395
I’m happy with chance of
payment. 13 11,2 52 44,8 9 7,8 27 23,3 15 12,9 2,8190 ,11846 W O RK SA TI SFA C TI ON
My job provides me a secure
future. 16 13,8 19 16,4 8 6,9 38 32,8 35 30,2 3,4914 1,42338
This job provides me a sufficient pay and chance of promotion.
32 27,6 40 34,5 9 7,8 28 24,1 7 6,0 2,4655 1,28828 My job provides me personal
development and progress possibility. .
21 18,1 51 44,0 7 6,0 29 25,0 8 6,9 2,5862 1,23759 I’m in harmony with my peers
and people I’m in contact with. 4 3,4 21 18,1 9 7,8 51 44,0 31 26,7 3,7241 1,14654
Managers are just and
respectful to all employees. 19 16,4 19 16,4 21 18,1 39 33,6 18 15,5 3,1552 1,32929
I feel that I’m appreciated when
doing my work. 16 13,8 19 16,4 21 18,1 48 41,4 12 10,3 3,1810 1,23429
I have the chance to know my
friends better in my work. 7 6,0 9 7,8 10 8,6 63 54,3 27 23,3 3,8103 1,07067
My manager supports and
guides me. 12 10,3 19 16,4 25 21,6 42 36,2 18 15,5 3,3017 1,21741
I feel that my pay is just for my
work. 28 24,1 26 22,4 14 12,1 33 28,4 15 12,9 2,8362 1,40771
I have the chance to apply personal independent ideas and behavior in my work.
18 15,5 36 31,0 24 20,7 28 24,1 10 8,6 2,7931 1,21953 My workplace permits me to
realize my future expectations. 21 18,1 3 31,0 28 24,1 25 21,6 6 5,2 2,6466 1,15912
I have the chance to help my
I have the chance to compete in
my workplace. 18 15,5 20 17,2 31 26,7 39 33,6 8 6,9 2,9914 1,19051
Attitude of management in the
workplace is positive. 8 6,9 20 17,2 29 25,0 41 35,3 18 15,5 3,3534 1,14402
PERFORMANCE
I complete my missions in right
time. 8 6,9 26 22,4 4 3,4 57 49,1 21 18,1 3,4914 ,11650
I exceedingly reach my business
targets. 12 10,3 39 33,6 7 6,0 41 35,3 17 14,7 3,1034 ,12083
I’m sure that I reach standards with the quality of service I supply.
4 3,4 27 23,3 14 12,1 47 40,5 24 20,7 3,5172 ,10778 I can immediately solve
problems whenever they arise. 8 6,9 24 20,7 7 6,0 50 43,1 26 22,4 3,5391 ,11605
According to the table, depending on the averages of replies relating to the satisfaction with levels of payments, it is possible to say that employees are not satisfied with their pay. Results of the evaluation also indicate that 50% of the employees are not satisfied with the career opportunities as another variable. Table 5 additionally indicates that the job satisfaction and performance levels of the participants are considerably high.
Table 6. Comparison of the Views of Employees in Levels of Payment, Career, Job Satisfaction and Performance According to Sex
Dimensions Relating to Research Scale
Sex n Ave. ( ) s.d. t Sig (p)
JOB SATISFACTION Female 30 3,1095 0,66525 -,143 0,892
Male 86 3,1296 0,66236 -,142 CAREER Female 30 2,8583 1,19569 ,300 0,328 Male 86 2,7849 1,14028 ,293 PAY Female 30 2,3111 1,04289 -,834 0,628 Male 86 2,5039 1,10583 -,858 PERFORMANCE Female 30 3,2917 1,00448 -,768 0,849 Male 86 3,4574 1,02276 -,774
T-test results of variables in research scale relating to the comparison of males and females are given in Table 6. Job satisfaction, career, payment and performance dimensions are respectively p=892; p=328; p=628 and p=849 as shown in the table. These values indicate that there is no meaningful difference at p>0,05 level. Such findings point out that depending on sex there are no significant differences in dimensions of replies of the employees participating in the survey.
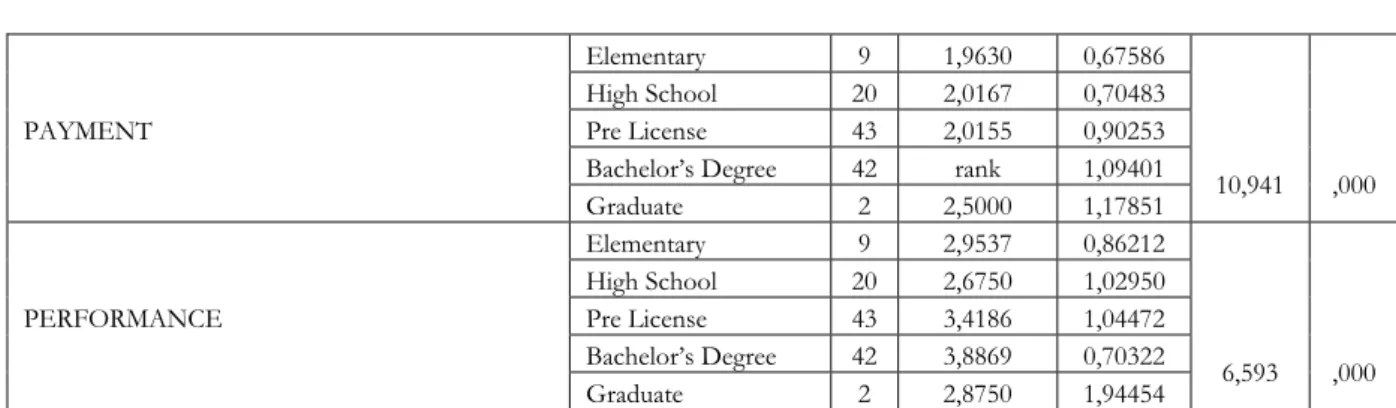
Table 7. Anova Test Results Relating to Comparison of Employees’ Education Levels with that of Payment, Career, Job Satisfaction and Performance
Dimensions Relating to Research Scale Education Level n Ave. ( ) s.d. F p
JOB SATISFACTION Elementary 9 3,2619 0,55558 5,741 ,000 High School 20 2,6536 0,71251 Pre License 43 3,2425 0,64439 Bachelor’s Degree 42 3,2534 0,52375 Graduate 2 1,9643 0,85863 CAREER Elementary 9 1,9444 0,55590 18,937 ,000 High School 20 2,2250 0,83862 Pre License 43 2,3081 0,91586 Bachelor’s Degree 42 3,7440 0,94754 Graduate 2 3,3750 1,59099
PAYMENT
Elementary 9 1,9630 0,67586
10,941 ,000 High School 20 2,0167 0,70483
Pre License 43 2,0155 0,90253 Bachelor’s Degree 42 rank 1,09401
Graduate 2 2,5000 1,17851 PERFORMANCE Elementary 9 2,9537 0,86212 6,593 ,000 High School 20 2,6750 1,02950 Pre License 43 3,4186 1,04472 Bachelor’s Degree 42 3,8869 0,70322 Graduate 2 2,8750 1,94454
Due to the outcome of Table 7 indicating the differences in pay, career, job satisfaction and performance levels of governorship employees according to their ranks of education based on Anova test results, meaningful differences are found between the criteria dimensions (job satisfaction F=5,741; p<0,05, career F=18,937; p<0,05, pay F=10,941; p<0,05 and performance F=6,593; p<0,05) in the education levels of employees. Accordingly it will be right to say that the satisfaction employees get from their pay levels and career possibilities differ according to their education levels.
Table 8. Anova test Results Relating to the Comparison of Employees Pay, Career, Job Satisfaction and Performance Levels According to their Seniority
Research Criteria Dimensions Education Levels n Ave. ( ) s.d. F p
JOB SATISFACTION
Less than 1 year 9 2,9921 0,73057
1,000 ,411
1-5 15 3,4238 0,52173
5-10 9 3,1587 0,73260
10-15 64 3,0647 0,67712
More than 15 years 19 3,1353 0,62944
CAREER
Less than 1 year 9 2,1944 0,90810
1,449 ,223
1-5 15 3,1667 1,34519
5-10 9 2,3333 1,01550
10-15 64 2,8447 1,14661
More than 15 years 19 2,8816 1,09408
PAY
Less than 1 year 9 2,3333 1,11803
1,125 ,349
1-5 15 2,9778 1,13015
5-10 9 2,1481 1,06863
10-15 64 2,3958 1,04210
More than 15 years 19 2,4386 1,19181
PERFORMANCE
Less than 1 year 9 3,3333 1,08972
1,418 ,233
1-5 15 3,5333 0,93478
5-10 9 3,2500 1,21192
10-15 64 3,2826 1,04544
More than 15 years 19 3,8816 0,76966
Due to the Anova test results relating to the comparison of employees in pay, career, job satisfaction and performance levels according to their seniorities, no meaningful differences (job satisfaction F=1,000; p>0,05, career F=1,449; p>0,05 pay F=1,125; p>0,05, performance F=1,418; p>0,05) are found between their seniority and dimensions in the survey. Consequently, there are no differences among the seniority of employees and dimensions mentioned above.
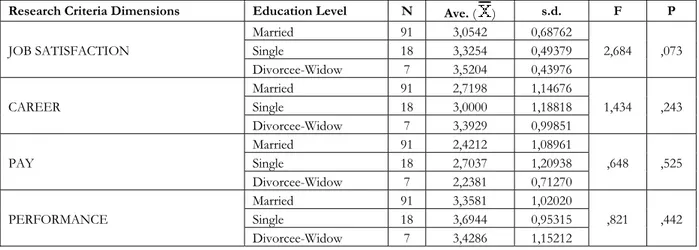
Table 9. Anova test Results Relating to the Comparison of Employees Pay, Career, Job Satisfaction and Performance Levels According to their Marital Status
Research Criteria Dimensions Education Level N Ave. ( ) s.d. F P
JOB SATISFACTION Married 91 3,0542 0,68762 2,684 ,073 Single 18 3,3254 0,49379 Divorcee-Widow 7 3,5204 0,43976 CAREER Married 91 2,7198 1,14676 1,434 ,243 Single 18 3,0000 1,18818 Divorcee-Widow 7 3,3929 0,99851 PAY Married 91 2,4212 1,08961 ,648 ,525 Single 18 2,7037 1,20938 Divorcee-Widow 7 2,2381 0,71270 PERFORMANCE Married 91 3,3581 1,02020 ,821 ,442 Single 18 3,6944 0,95315 Divorcee-Widow 7 3,4286 1,15212
Table 9 indicates the Anova test results relating to the comparison of pay, career, job satisfaction and performance levels of employees according to their marital status. No meaningful differences are found between the marital status of employees and variables subject to research. Accordingly, there are no meaningful differences between the marital status of employees (whether being a married, single, divorcee or widow) and dimensions given above.
Table 10. Anova test Results Relating to the Comparison of Employees Pay, Career, Job Satisfaction and Performance Levels According to their Age
Research Criteria Dimensions Age n Ave. ( ) s.d. F p
JOB SATISFACTION 20-29 25 3,2829 0,64631 1,175 ,323 30-39 29 3,0739 0,65978 40-49 55 3,0455 0,67894 50 + 7 3,3878 0,49976 CAREER 20-29 25 2,6000 1,17038 ,472 ,702 30-39 29 2,9741 1,23445 40-49 55 2,8000 1,12155 50 + 7 2,8571 1,05926 PAY 20-29 25 2,4267 1,13252 ,105 ,957 30-39 29 2,5287 1,13570 40-49 55 2,4485 1,08339 50 + 7 2,2857 0,97046 PERFORMANCE 20-29 25 3,5000 1,04083 ,711 ,548 30-39 29 3,4397 1,00146 40-49 55 3,3061 1,02741 50 + 7 3,8571 0,95587
According to the Anova test results in Table 10 no meaningful differences (job satisfaction F=1,175; p>0,05, career F=,472; p>0,05, pay F=,105; p>0,05, performance F=,711; p>0,05) are found between the age levels of employees and dimensions in survey. Consequently, no differences are found between the age differences of employees (whether these are young, middle aged or aged) and their pay, career, job satisfaction and performance levels.
7.4. Regression Analyses: Three regression models are built to test the hypothesis and analyse the relations between the variables three regression models are formed. In the first model relations between the pay and career, and job satisfaction is analysed where no meaningful relation is found among these.
Table 11. Results of Regression Analyses between Pay and Career, and Job Satisfaction INDEPENDENT VARIABLE DEPENDENT VARIABLE Job Satisfaction β T P (Sig.) Pay -,076 1,188 ,237 Career ,180 -,501 ,617 F ,955 R2 ,017 dzltR2 -,001
Second regression model relates to correlation between pay, career, and performance. F value in Table 12 is an indicator of the meaningfulness of the model. F value being 23,566 shows that the model is meaningful at 0,01 level. As shown in the regression analyses below R2 value is ,294 (certainty or defining coefficient) and corrected R2 value is ,282. These values is a measure indicating the level of definition of the dependent variables by the independent others.
There is a positive and meaningful correlation between the career and performance as independent variables in the model. The p value of this variable is found to be ,001. There is no correlation between the other variable, pay, and the performance.
Table 12. Results of Regression Analyses between the Pay and Career, and Performance INDEPENDENT VARIABLE DEPENDENT VARIABLE Performance β T P (Sig.) Pay ,102 ,796 ,427 Career ,458 3,569** ,001 F 23,566** R2 ,294 dzltR2 ,282 **meaningful at p < 0.01 level
Relations between the job satisfaction and performance are analyzed in the third model. A positive and meaningful connection between the two is found. Table 13 indicates that such relation is at p<0,05 level (,049).
Table 13. Results of Regression Analyses between Job Satisfaction and Performance INDEPENDENT VARIABLES DEPENDENT VARIABLE Performance β T P (Sig.) Job Satisfaction ,317 1,785* ,049 F 13,628* R2 ,218 dzltR2 ,186 *meaningful at p < 0.05 level
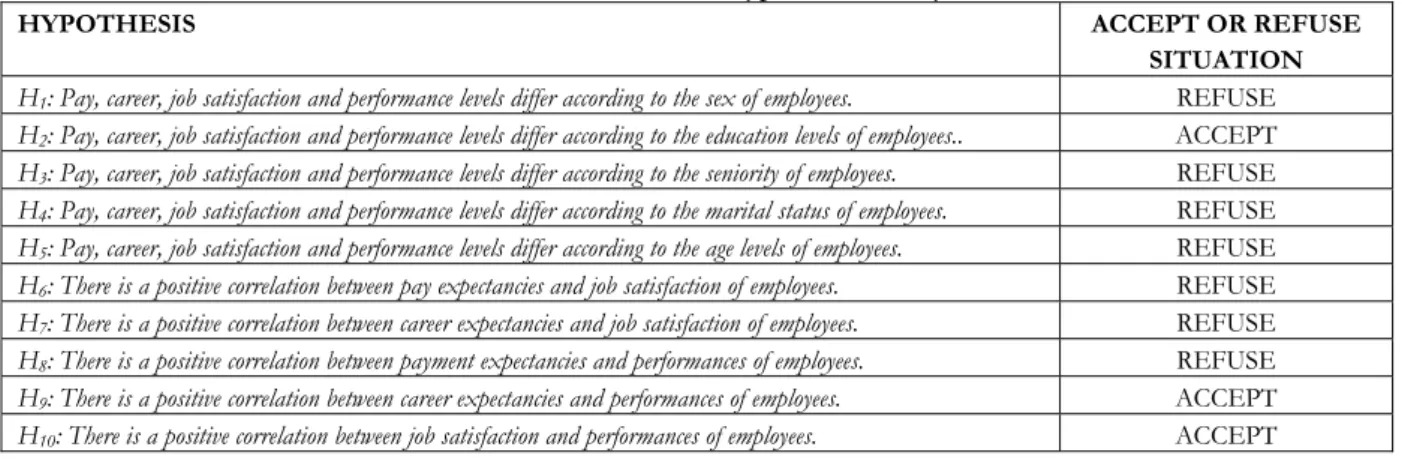
Table 14 below indicates the acceptance and refusal situation of all hypotheses according to results of regression analyses above.
Table 14. Results of Hypothesis Analyzes
HYPOTHESIS ACCEPT OR REFUSE
SITUATION
H1: Pay, career, job satisfaction and performance levels differ according to the sex of employees. REFUSE
H2: Pay, career, job satisfaction and performance levels differ according to the education levels of employees.. ACCEPT
H3: Pay, career, job satisfaction and performance levels differ according to the seniority of employees. REFUSE
H4: Pay, career, job satisfaction and performance levels differ according to the marital status of employees. REFUSE
H5: Pay, career, job satisfaction and performance levels differ according to the age levels of employees. REFUSE
H6: There is a positive correlation between pay expectancies and job satisfaction of employees. REFUSE
H7: There is a positive correlation between career expectancies and job satisfaction of employees. REFUSE
H8: There is a positive correlation between payment expectancies and performances of employees. REFUSE
H9: There is a positive correlation between career expectancies and performances of employees. ACCEPT
H10: There is a positive correlation between job satisfaction and performances of employees. ACCEPT 8. RESULTS AND EVALUATION
Today the most effective tool of organizations to cope with rivals in international competition is their manpower. Accordingly 21st century represents an age that the importance of human factor is understood once again. Increases in job satisfaction levels of the employees through their positive feelings towards the workplace and their work became an important factor in benefiting from the human resources in an effective and productive manner. The reason is that it spontaneously leads to positive results such as the customer satisfaction, service quality and success of the organization.
This study examines:
• Relations between the sex, marital status, education level, age and seniorities of employees and pay, career, job satisfaction and performance,
• Relations between pay and career, and job satisfaction, • Relations between pay and career, and performance, • Relations between job satisfaction and performance.
Study indicates that merely the education level as a single demographic characteristic differentiates the pay, career, job satisfaction, and performance levels of employees, where it stands to be indifferent in that of the sex, age, marital status and seniority.
Contrary to the literature relating to job satisfaction this study conducted in the Karaman governorship concludes that there is no meaningful relation between pay expectations and career possibilities, and job satisfaction. Yet the same study indicates a positive relation between career and performance parallel to that in literature. Separately, it also justifies the same in case of job satisfaction and performance.
Resultantly, the measurement of the views of employees in public sector in regard to their working conditions such as pay, career, job satisfaction and performance is submitting important data both to academicians, and managers. Through such data they will have the chance to revalue and reshape the management models.
REFERENCES
Agho, A., Mueller, C. and J. Price (1993), “Determinants of Employee Job Satisfaction: An Empirical Test of a Causal Model”, Human Relations, 46 (8): 1007-1027.
Akıncı, Z. (2002), “Turizm Sektöründe İşgören İş Tatminini Etkileyen Faktörler: Beş Yıldızlı Konaklama İşletmelerinde Bir Uygulama”, Akdeniz Üniversitesi İ.İ.B.F. Dergisi, 4: 1-25.
Ardıç, Kadir, “The Impact of Age on the Job Satisfaction of Turkish Academicians”, www.bilgiyonetimi.org/crm, 15.03.2008.
Bakan, İsmail ve Tuğba Büyükbeşe (2004), “Örgütsel İletişim ile İş Tatmini Unsurları Arasındaki İlişkiler: Akademik Örgütler İçin Bir Alan Araştırması”, Akdeniz İ.İ.B.F. Dergisi, 7: 1-30.
Baysal, A.C. ve E. Tekarslan (1996), Davranış Bilimleri, 2. Bası, İstanbul. Bingöl, Dursun (1997), Personel Yönetimi, Beta Basımevi, İstanbul.
Bowen, C. F., Radhakrishna, R. and R. Keyser (1994), “Job Satisfaction and Commitment of 4-H Agents”, Extension Journal.
Bozkurt, Ö. ve İ. Bozkurt (2008), “İş Tatminini Etkileyen İşletme İçi Faktörlerin Eğitim Sektörü Açısından Değerlendirilmesine Yönelik Bir Alan Araştırması”, Doğuş Üniversitesi Dergisi, 9 (1): 1-18.
Burnard, P., Morrison, P. and C. Phillips (1999), “Job Satisfaction amongst Nurses in an Interim Secure Forensic Unit in Wales”, Australian and New Zealand Journal of Mental Health Nursing, 8: 9-18.
Chusmir, L. H. ve B. Parker (2001), “Success Strivings and Their Relationship to Affective Work Behaviors: Gender Differences”, The Journal of Social Psychology, 132 (1): 87-99.
Çağlar, İ. (2005), “KOBİ’lerde İş Tatmininin Sektörler İtibariyle Karşılaştırılmalı Analizi ve Çorum Örneği”, Süleyman Demirel Üniversitesi İ.İ.B.F. Dergisi, 10 (2): 153-164.
Çarıkçı, İ. H. ve A. OKSAY (2004), “Örgütsel Yapı ve Meslek Farklılıklarının İş Tatmini Üzerindeki Etkileri: Hastane Çalışanları Üzerinde Bir Araştırma”, Süleyman Demirel Üniversitesi İ.İ.B.F. Dergisi, 9 (2): 157-172.
Çöl, Güner (2008), “Algılanan Güçlendirmenin İşgören Performansı Üzerine Etkileri”, Doğuş Üniversitesi Dergisi, 9 (1): 35-46.
Dodson, T. A. and L. D. Borders (2006), “Men in Traditional and Nontraditional Careers: Gender Role Attitudes, Gender Role Conflict, and Job Satisfaction”, The Career Development Quarterly, Alexandria: Jun 2006, 54 (4).
Emmert, M. A. ve W. A. TAHER (1992), “Public Sector Professionals: The Effects of Public Sector Jobs on Motivation, Job satisfaction and Work Involvement”, American Review of Public Administration, 22: 37-48.
Erdoğan, İ. (1999), İşletme Yönetiminde Örgütsel Davranış, İstanbul Üniversitesi, İşletme Fakültesi, İşletme İktisadı Enstitüsü, Araştırma ve Yardım Vakfı, Yayın No:5, İstanbul.
Eroğlu, F. (2000), Davranış Bilimleri, 5. Baskı, Beta Yayınları, İstanbul.
Gordon, J. R. (1999), Organizational Behavior: A Diagnostic Approach, Sixth Edition, New Jersey, 569s.
Güven, M., Bakan, İ. ve S. Yeşil (2005), “Çalışanların İş ve Ücret Tatmini Boyutlarıyla Demografik Özellikler Arasındaki İlişkiler: Bir Alan Çalışması”, Yönetim ve Ekonomi, 12 (1): 127-151.
İmamoğlu, S. Z., Keskin, H. ve S. Erat (2004), “Ücret, Kariyer ve Yaratıcılık İle İş Tatmini Arasındaki İlişkiler: Tekstil Sektöründe Bir Uygulama”, Yönetim ve Ekonomi Dergisi, 11 (1): 167-176.
Keser, A., “Akademisyenlerin Çalışan Tatmini-Yaşam Tatmini Araştırması”, http://www.paradoks.org/makale/yil2_sayi1/calisan_tatmini.pdf., 16.03.2008.
Lam, S. S. K. (1995), “Quality Management and Job Satisfaction”, International Journal of Quality & Reliability Management, 12 (4): 72-78.
Lum, L., Kervin, J., Clark, K., Reid, F. and W. Sirola (1998), “Explaining Nursing Turnover Intent: Job Satisfaction, Pay Satisfaction, or Organizational Commitment?”, Journal of Organizational Behavior, 19: 305-320.
Luthans, F., (1995), Organizational Behaviour, McGraw Hill, Inc.
Oshagbemi, T. (2000), “Satisfaction with Co-Workers’ Behavioour”, Employee Relations, 22 (1): 88-106.
Örücü, E., Yumuşak, S. ve Y. Bozkır (2006), “Kalite Yönetimi Çerçevesinde Bankalarda Çalışan Personelin İş Tatmini ve İş Tatminini Etkileyen Faktörlerin İncelenmesine Yönelik Bir Araştırma”, Yönetim ve Ekonomi, 13 (1): 39-51.
Özgen, H., Öztürk, A. ve A. Yalçın (2001), İnsan Kaynakları Yönetimi, Nobel Kitabevi, Adana, 331-332.
Paksoy, H. M. (2007), “Üniversitelerde Akademik Personelin İş Memnuniyeti: Harran Üniversitesi Örneği”, Selçuk Üniversitesi Karaman İ.İ.B.F. Dergisi, 12 (9): 138-151.
Querstein, V., McAffe, R. B. and M. Glassman (1992), “The Situational Occurences Theory of Job Satisfaction”, Human Relations, 45 (8): 859-873.
Samad, S. (2006), “Predicting Turnover Intentions: The Case of Malaysian Government Doctors”, The Journal of American Academy of Business, Cambridge, 8 (2): 113-119.
Savery, L. K. (1996), “The Congruence between the Importence of Job Satisfaction and the Perceived Level of Achiement”, Journal of Management Development, 15 (6): 18-27.
Scott, A., Gavelle, H., Simoens, S., Bojke, C. and B. Sıbbald (2006), “Job Satisfaction and Quitting Intentions: A Structural Model of British General Practitioners”, British Journal of Industrial Relations, 44 (3): 519-540.
Serinkan, C. ve A. Bardakçı (2007), “Pamukkale Üniversitesi’nde Çalışan Öğretim Elemanlarının İş Tatminlerine İlişkin Bir Araştırma”, Selçuk Üniversitesi Karaman İ.İ.B.F. Dergisi, 12 (9): 152-163.
Sigler, T. H. ve c. M. Pearson (2000), “Creating an Empowering Culture: Examining the Relationship between Organizational Culture and Perceptions of Empowerment”, Journal of Quality Management, 5: 27-52.
Şimşek, Ş., Akgemci, T. ve A. Çelik (2001), Davranış Bilimlerine Giriş ve Örgütsel Davranış, Nobel Yayınları, Ankara.
Türk, M. S., Aydoğan, E. ve N. Kansu (2003), “İçsel Motivasyonun İş Tatmini Üzerindeki Etkisi: Türk Tarih Kurumu ve Nurol Matbaasında Yapılan Karşılaştırmalı Bir Araştırma”, 1. Matbaa Teknolojileri Sempozyumu, Ankara.
Tütüncü, Ö. (2000), “Kar Amacı Gütmeyen Yiyecek İçecek İşletmelerinde İş Doyumunun Analizi”, Dokuz Eylül Üniversitesi Sosyal Bilimler Enstitüsü Dergisi, 2 (3).
Weiss, H. M. (2002), “Deconstructing Job Satisfaction Seperating Evaluations, Beliefs and Affective Experiences”, Human Resource Management Review, 12: 173-194.
Yılmaz, İ. ve M. Işık (2004), “Esnek Çalışma Uygulamalarının İşgörenlerin İş Doyumuna Etkileri ve Bir Manisa Örneği”, Celal Bayar Üniversitesi Sosyal Bilimler Dergisi, 2 (2): 95-105.
Yüksel, İ. (2002), “Hemşirelerin İş Doyum Düzeyini Ayırt Edici İş Doyum Öğelerinin Diskriminant Analiziyle Belirlenmesi”, Kocaeli Üniversitesi Sosyal Bilimler Enstitüsü Dergisi, 1: 67-78.
Yüksel, İ. (2005), “İletişimin İş Tatmini Üzerindeki Etkileri: Bir İşletmede Yapılan Görgül Çalışma”, Doğuş Üniversitesi Dergisi, 6 (2): 291-306.