REVISION IN THE UNEMPLOYMENT SERIES
Seyfettin Gürsel*Gökçe Uysaland Ayşenur AcarAbstract
Seasonally adjusted labor market data shows that non-agricultural unemployment rate decreased from 11.1 percent to 11.0 percent in the period of February 2014. We observed strong increases in both non-agricultural labor force and employment in this period. Seasonally adjusted labor market series show that employment increased in all sectors. Employment increases in manufacturing and construction sectors are especially interesting. On the other hand, key revisions in definitions of labor market series made by TurkStat have caused jumps in the series. Hence, in the next few periods, labor market series should be treated with caution.
Revision in labor market series
1Turkstat has made key revisions in labor market series beginning February 2014. These revisions made labor market series compatible with the standards of European Union Statistics. Accordingly, the revisions can be broadly grouped into 5 categories: (i) change in reference week in the Household Labor Survey as each week of the survey year (ii) change in the sampling design (iii) change in rural/urban distribution based on the new
administrative allocation (iv) change in job search process (it was decreased from 3 months to 1 month). Given the revisions, we observe certain breaks in the labor market series. This leads to major changes in especially sectoral employment series. Turkstat states that revisions to these new measurements in the labor market series take time to settle. Hence, short term fluctuations in the labor market should be treated with caution.
Extraordinary increases in non-agricultural labor force and employment
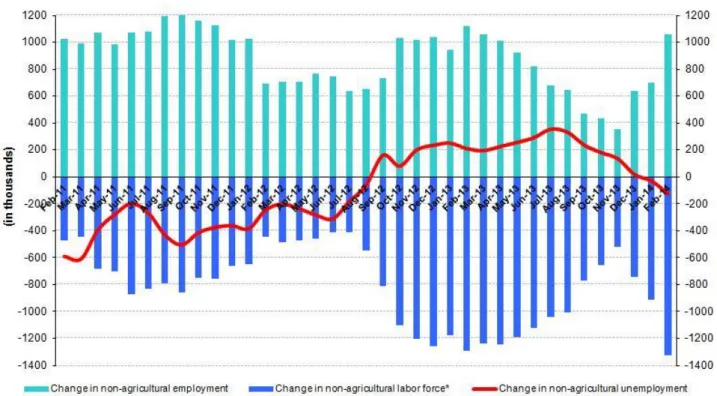
According to the data released by TurkStat, non-agricultural labor force increased by 1 million 324 thousand (6.2 percent) and non-agricultural employment increased by 1 million 57 thousand (5.6 percent) in the period of
February 2014 (Figure 1). Consequently, the number of persons unemployed in non-agricultural sectors decreased by 124 thousand. Increase in non-agricultural labor force is the highest observed during the last few years.
Similarly, non-agricultural employment increased over 1 million.
Labor Market Outlook:
May 2014
www.betam.bahcesehir.edu.tr
2
Figure 1 Year-on-year changes in non-agricultural labor force, employment and unemploymentSource: TurkSTAT,Betam
Non-agricultural unemployment decreased by 0.1 percentage point
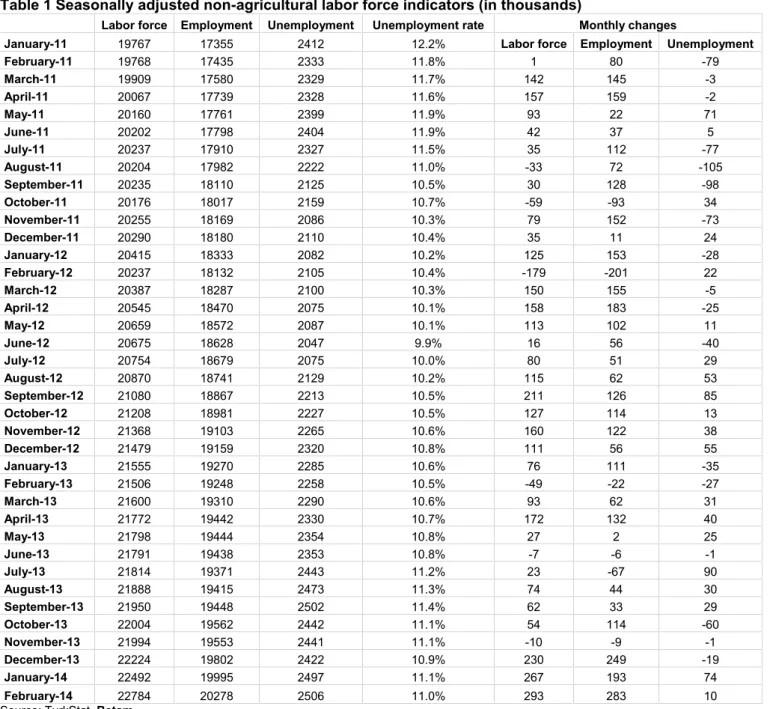
According to seasonally adjusted data, non-agricultural labor force increased by 293 thousand in the period of February 2014 compared to the period of January 2014, and reached 22 million 784 thousand (Figure 2, Table 1). Non-agricultural employment increased by 283 thousand and reached 20 million 278 thousand. Hence, the number of persons unemployed in non-agricultural sectors increased by 10 thousand and non-agricultural unemployment rate decreased from 11.1 percent in the period of January 2014 to 11.0 percent in the period of February 2014.
Figure 2 Seasonally adjusted non-agricultural labor force, employment and unemployment
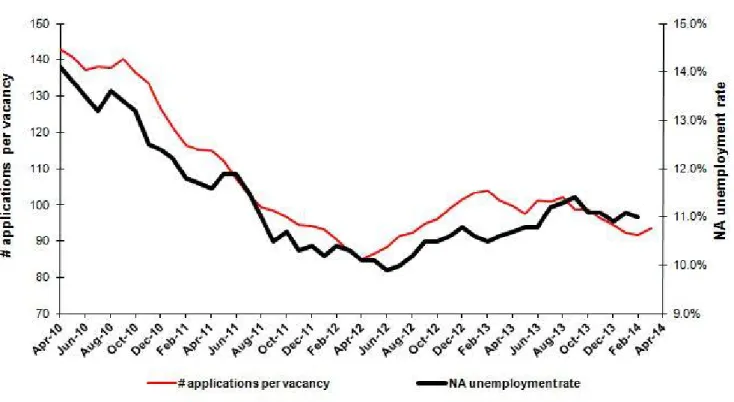
According to Kariyer.net data, non-agricultural unemployment might increase in the next period
Our calculations based on the seasonally adjusted application per vacancy statistics calculated using Kariyer.net series indicate that we accurately predicted the direction of unemployment for the last two periods.2The
Kariyer.net series also indicates that non-agricultural unemployment might slightly increase in the period of March 2014.
Figure 3 Seasonally adjusted non-agricultural unemployment rate and application per vacancy
Source: Kariyer.net, TurkStat,Betam
Strong employment increase in manufacturing sector
Seasonally adjusted labor market series show that employment in manufacturing sector increased by 127 thousand in the period of February 2014 (Table 2, Figure 4).3 Employment in services continues to rise, amounting to 69
thousand in this period. Similarly, employment in construction sector increased consecutively during the last three periods, the rise being 86 thousand in this period.
On the other hand, agricultural employment increased by 347 thousand in the period of January 2014 and
increased by 135 thousand in the period of February 2014. TurkStat states that the revision in rural/urban definition led to major changes in sectoral employment in rural areas.
2 Betam has been calculating application per vacancy using series released by Kariyer.net for a while. Seasonal and calendar adjustment procedure is applied to application per vacancy series. A decrease in applications per vacancy may be caused by an increase in vacancies or by a decrease in the number of applications. An increase in vacancies signals economic growth while decreasing number of applications
www.betam.bahcesehir.edu.tr
4
Figure 4 Employment by sectors (in thousands)4Source: TurkStat,Betam
Table 1 Seasonally adjusted non-agricultural labor force indicators (in thousands)
Labor force Employment Unemployment Unemployment rate Monthly changes
January-11 19767 17355 2412 12.2% Labor force Employment Unemployment
February-11 19768 17435 2333 11.8% 1 80 -79 March-11 19909 17580 2329 11.7% 142 145 -3 April-11 20067 17739 2328 11.6% 157 159 -2 May-11 20160 17761 2399 11.9% 93 22 71 June-11 20202 17798 2404 11.9% 42 37 5 July-11 20237 17910 2327 11.5% 35 112 -77 August-11 20204 17982 2222 11.0% -33 72 -105 September-11 20235 18110 2125 10.5% 30 128 -98 October-11 20176 18017 2159 10.7% -59 -93 34 November-11 20255 18169 2086 10.3% 79 152 -73 December-11 20290 18180 2110 10.4% 35 11 24 January-12 20415 18333 2082 10.2% 125 153 -28 February-12 20237 18132 2105 10.4% -179 -201 22 March-12 20387 18287 2100 10.3% 150 155 -5 April-12 20545 18470 2075 10.1% 158 183 -25 May-12 20659 18572 2087 10.1% 113 102 11 June-12 20675 18628 2047 9.9% 16 56 -40 July-12 20754 18679 2075 10.0% 80 51 29 August-12 20870 18741 2129 10.2% 115 62 53 September-12 21080 18867 2213 10.5% 211 126 85 October-12 21208 18981 2227 10.5% 127 114 13 November-12 21368 19103 2265 10.6% 160 122 38 December-12 21479 19159 2320 10.8% 111 56 55 January-13 21555 19270 2285 10.6% 76 111 -35 February-13 21506 19248 2258 10.5% -49 -22 -27 March-13 21600 19310 2290 10.6% 93 62 31 April-13 21772 19442 2330 10.7% 172 132 40 May-13 21798 19444 2354 10.8% 27 2 25 June-13 21791 19438 2353 10.8% -7 -6 -1 July-13 21814 19371 2443 11.2% 23 -67 90 August-13 21888 19415 2473 11.3% 74 44 30 September-13 21950 19448 2502 11.4% 62 33 29 October-13 22004 19562 2442 11.1% 54 114 -60 November-13 21994 19553 2441 11.1% -10 -9 -1 December-13 22224 19802 2422 10.9% 230 249 -19 January-14 22492 19995 2497 11.1% 267 193 74 February-14 22784 20278 2506 11.0% 293 283 10
6
Table 2 Seasonally adjusted employment by sector (in thousands)Agriculture Manufacturing Construction Service Monthly changes
January-11 5373 4819 1576 10959 Agriculture Manufacturing Construction Service
February-11 5474 4767 1618 11050 101 -52 42 91 March-11 5469 4914 1625 11041 -5 147 7 -9 April-11 5361 4958 1630 11151 -108 44 5 110 May-11 5315 4915 1653 11193 -46 -43 23 42 June-11 5364 4826 1669 11302 49 -89 16 109 July-11 5380 4846 1696 11367 16 20 27 65 August-11 5441 4816 1758 11409 61 -30 62 42 September-11 5373 4866 1763 11481 -68 50 5 72 October-11 5407 4823 1683 11511 34 -43 -80 30 November-11 5401 4870 1676 11623 -6 47 -7 112 December-11 5326 4873 1648 11660 -75 3 -28 37 January-12 5332 4864 1723 11745 6 -9 75 85 February-12 5278 4808 1578 11746 -54 -56 -145 1 March-12 5243 4850 1584 11854 -35 42 6 108 April-12 5263 4930 1649 11890 20 80 65 36 May-12 5310 4908 1713 11952 47 -22 64 62 June-12 5252 4900 1725 12002 -58 -8 12 50 July-12 5249 4926 1711 12042 -3 26 -14 40 August-12 5240 4892 1751 12098 -9 -34 40 56 September-12 5305 4911 1776 12179 65 19 25 81 October-12 5347 4917 1789 12275 42 6 13 96 November-12 5357 5003 1810 12290 10 86 21 15 December-12 5341 5051 1798 12310 -16 48 -12 20 January-13 5329 5073 1847 12350 -12 22 49 40 February-13 5300 5023 1842 12383 -29 -50 -5 33 March-13 5312 5083 1806 12421 12 60 -36 38 April-13 5292 5176 1807 12459 -20 93 1 38 May-13 5234 5200 1728 12516 -58 24 -79 57 June-13 5184 5163 1746 12529 -50 -37 18 13 July-13 5178 5146 1684 12541 -6 -17 -62 12 August-13 5192 5117 1727 12571 14 -29 43 30 September-13 5187 5096 1765 12586 -5 -21 38 15 October-13 5102 5090 1856 12616 -85 -6 91 30 November-13 5063 5064 1809 12680 -39 -26 -47 64 December-13 5051 5131 1927 12744 -12 67 118 64 January-14 5398 5232 2004 12759 347 101 77 15 February-14 5533 5359 2090 12828 135 127 86 69