Web Bilgi Sistemlerinde Performans Değerlendirmesi
Yaşar TontaHacettepe University, Department of Information Management, Ankara, Turkey. [email protected] İrem Soydal
Hacettepe University, Department of Information Management, Ankara, Turkey. [email protected]
Abstract: The quality of web information systems is closely related with their users’ expectations. In order to create
good quality systems, web designers should understand how users perceive service quality of various performance attributes such as security, usability and information quality, and which ones they value the most. In this study, users’ service quality perceptions of two different web sites were investigated. Data were obtained from 1,900 users of web sites of a for-profit online bookstore and a not-for-profit national information center through the E-Qual Index that was administered online. Users were asked to rate to what extent each web site satisfied the 22 performance attributes included in the E-Qual Index along with the importance they attached thereto. Quadrant analysis and gap analysis were used to analyze the data to find out the strengths and weaknesses of the web sites investigated. Moreover, performance attributes that need to be improved or that were “undervalued” by the users were identified. Findings indicate that each web site satisfied more than half the performance attributes listed in the E-Qual Index. Users attached more importance to performance attributes such as ease of use, provision of timely and relevant information and safety. Findings can be used to remedy the shortcomings of each web site and improve the web service quality.
Keywords: Web service quality, E-Qual Index, quadrant analysis, gap analysis, usability, information quality Öz: Web bilgi sistemlerinin kalitesi büyük ölçüde kullanıcıların beklentileri ile ilgilidir. Web tasarımcıları, kaliteli
sistemler yaratabilmek için güvenlik, kullanılabilirlik ve bilginin niteliği gibi çeşitli performans özelliklerinin kullanıcılar tarafından nasıl algıladığını ve bunların hangilerinin daha fazla önemsendiğini anlamalıdırlar. Bu çalışmada, iki farklı web sitesi kullanıcılarının algıladığı hizmet kalitesi incelenmiştir. Veriler, biri kâr amacı güden kitap satış sitesi, diğeri kâr amacı gütmeyen ulusal bilgi merkezi olmak üzere iki web sitesinin 1900 kullanıcısına çevrimiçi bir anket ile uygulanan E-Qual İndeksi aracılığı ile toplanmıştır. Her iki web sitesinin kullanıcısından, sitenin E-Qual İndeksi’nin test ettiği 22 performans özelliğinin kendilerini ne düzeyde memnun ettiğine dair puan vermeleri, ayrıca bu 22 özelliğin onlar için ne derece önemli olduğunu puanlamaları istenmiştir. İncelenen web sitelerinin zayıf ve güçlü yönlerini ortaya çıkarmak için elde edilen verilere quadrant analizi ve fark analizi uygulanmıştır. Analiz sonucunda geliştirilmesi gereken ya da kullanıcılar tarafından önemsenmeyen performans özellikleri belirlenmiştir. Bulgulara göre, her iki web sitesinde de E-Qual İndeksi’nde yer alan performans özelliklerinin yarısından fazlası kullanıcıları memnun etmektedir. Kullanıcılar, kullanım kolaylığı, zamanında ve ihtiyaçlarla ilgili bilgi sunulması ve güvenlik gibi performans özelliklerine daha fazla önem atfetmiştir. Bu çalışmanın bulguları, her iki web sitesinin eksikliklerinin giderilmesi ve web hizmet kalitesinin iyileştirilmesi için kullanılabilir.
Anahtar sözcükler: Web hizmet kalitesi, E-Qual İndeksi, quadrant analizi, fark analizi, kullanılabilirlik, bilginin
niteliği
Introduction
Web sites presenting information about a specific subject that appeal to a specific user group are called web information systems. These systems may have commercial, information sharing or information presenting purposes, and they need to be designed taking into consideration user satisfaction. The level of user satisfaction is determined by the extent to which users’ expectations are met. Users often think that the quality of web information systems is closely related with the quality of information provided and the quality of system design (Shih, 2004a; 2004b; Negash, Ryanb, & Igbaria, 2003). Users’ expectations increase as web functionality does. Users become more demanding as they experience new web services and technologies (Piccoli, Brohman, Watson, & Parasuraman, 2004). This shows that users’ expectations can change as fast as the Web itself does. Measuring service quality in the Web environment is important in terms of increasing the usage rate of systems. If web service quality is perceived
positively by the users, it significantly affects the users’ overall satisfaction, their eagerness to suggest the system to others and their tendencies to purchase/repurchase (Zeithaml, 2000).
This study attempts to measure the perceived service quality of web information systems by means of the E-Qual Index. It aims to understand users’ differing approaches to web service quality attributes by comparing two web sites as examples. Comprised of 22 Likert-type questions, the E-Qual Index tests the concepts of web site usability, information quality and interaction quality, in general. The E-Qual Index was used to evaluate the users’ perceived service quality of one for-profit web site (Idefix, an online shopping site, www.idefix.com.tr) and one not-for-profit web site (the National Academic Network and Information Center, ULAKBIM, www.ulakbim.gov.tr). Findings were compared to see if users’ perceptions of web service quality differed in terms of types of web sites. Strengths and weaknesses of each web site were also identified.
Literature Review
The concept of “traditional” service quality started to attract attention in the 1980s (Parasuraman, Zeithaml, & Berry, 1985). The SERVQUAL Index with 22 questions and five different dimensions (Tangibles, Reliability, Responsiveness, Assurance, and Empathy) emerged as a tool to measure the traditional service quality. The dimensions measured by the SERVQUAL Index have since changed as more services and products have increasingly been offered via the Web. Still, most studies measured web service quality by using dimensions of the SERVQUAL Index (Van Iwaarden, Van der Wiele, Ball, & Millen, 2004; Caruana, Ewing, & Ramaseshan, 2000; Cook & Thompson, 2000; Negash, Ryan, & Igbaria, 2003).
Several studies have been carried out on web service quality (Lindgaard & Dudek, 2003; Muylle, Moenaert, & Despontin, 2004; Shih, 2004b; Yang, Cai, Zhou, & Zhou, 2005; Garrity, Glassberg, Kim, Sanders, & Shin, 2005). Factor analysis was used to identify the new web service quality dimensions. Among them are: usability, usefulness of content, the adequacy of information, accessibility, and interaction (Yang et al., 2005); responsiveness, competence, quality of information, empathy, web assistance, and callback systems (Li, Tan, & Xie, 2002); and, effectiveness, system availability, fulfillment, compensation, and contact (Parasuraman Zeithaml, & Malhotra, 2005). Also, the quality of information, the features of perceived usability and the ease of use are significant measures from the users’ point of view to evaluate the success of information systems (Shih, 2004a; 2004b).
The E-Qual Index was developed at the beginning of the 2000s in order to measure web service quality. It was based on the literature of information systems, marketing and human-computer interaction (Barnes & Vidgen, 2002). First versions of E-Qual Index (named “WebQual Index” before 2003) were used to evaluate web sites of various universities (Barnes & Vidgen, 2000), online auction web sites (Barnes & Vidgen, 2001), web sites of online bookstores (Barnes & Vidgen, 2002), government institutions providing electronic services (Barnes & Vidgen, 2003b; 2005) and an online bookstore and a national information center (Soydal, 2008; Tonta & Soydal, 2009). These studies show that E-Qual Index is a kind of “built-in scale” and reveals a consistent methodology and some harmonious results. Using factor analysis on data, dimensions of perceived service quality were usually identified as Usability, Design, Information Quality, Trust and Empathy. In one of these studies, the information presenting website of OECD’s Forum on Strategic Management Knowledge Exchange (FSMK) was explored by removing the questions on Trust (Barnes & Vidgen, 2003a). Results of the study were similar except for the Trust dimension. Users’ views on Usability and Design dimensions changed positively after the web site was redesigned. A similar study was carried out using the official website of the UK Inland Revenue Service in which users’ perceptions of service quality were compared. Users who utilized the web site to carry out “interactive online transactions” attached more importance to the Usability dimension than those who used it to “gather information” (Barnes & Vidgen, 2003b; 2005). Another study investigated the differences of perceived service quality of a for-profit and a not-for-profit web site (Soydal, 2008; Tonta & Soydal, 2009). Factor analysis results showed that the dimensions Usability, Design and Empathy came up almost the same for both web sites. However, the not-for-profit web site users perceived the “Trust” issues merged with the “Information Quality” and thought that this consolidated dimension was the most important service quality component. On the other hand, the for-profit web site users comprehend Trust and Information Quality as different dimensions and thought the Trust dimension more important.
Methodology
Research questions addressed in this study are as follows:
How do users perceive the service quality of for-profit and not-for-profit web sites in terms of various performance attributes such as information quality, usability and service interaction quality?
Which performance attributes do users value most as part of the web service quality?
What are the strengths and weaknesses of for-profit and not-for-profit web sites in terms of design?
Are there any performance attributes that can be improved?
The Web sites of Idefix, a for-profit online bookstore, and ULAKBIM, a not-for-profit national information center, were used to collect data using the E-Qual Index (www.webqual.co.uk/instrument.htm). An online questionnaire with 22 questions was sent to all the registered users of both web sites via e-mail. Questions addressed the aspects of usability (e.g., “I find the website easy to learn to operate”), information quality (e.g., “The web site provides accurate/timely/believable information”) and service interaction (e.g., “My personal information feels secure”) of each web site. Users were asked to rate to what extent they were pleased with the service quality delivered by each web site for each performance attribute (e.g., their perceived satisfaction level) and how much importance they would attach thereto. They marked their ratings of satisfaction and importance for each question on a 5-point Likert scale (1: “I’m not pleased at all” / “It is not important for me at all” - 5: “I’m very pleased” / “It is very important for me”). The perceived satisfaction scores reveal the users’ evaluation of each web site while the importance scores reveal their levels of expectations for performance attributes tested in terms of web service quality.
Analyses were based on 1,782 and 118 questionnaires filled out by Idefix and ULAKBIM web site users, respectively. Findings were summarized in tables and quadrant graphs.
Quadrant analysis . . . is a graphic correlation technique that produces data easy to visualize . . . The technique plots data about service attributes into four quadrants defined by two dimensions: one reflects the importance to service excellence that customers give service attributes, while the other indicates the extent to which customers think a particular service has the attributes. The first dimension is plotted along the horizontal axis as the ideal expectation for excellent service quality, and the second dimension is plotted along the vertical axis as the perceived . . . performance. (Hernon & Calvert, 2005, p. 384)
This type of importance-performance analysis lets the system designers or managers identify their action plans to increase the overall satisfaction level of systems’ users (Vavra, 1997, p. 313).
In this study, quadrant graphs were used to plot the 22 performance attributes of each web site by users’ ratings of importance and satisfaction. Mean scores of importance and satisfaction for each attribute were plotted on a quadrant graph.
A quadrant graph has four partitions, each with its own specific interpretation. The upper right quadrant (Quadrant 1) contains performance attributes of “high importance-high satisfaction” levels representing the strengths of the web site (so called “winners”). These attributes need to be retained by system designers.
The upper left quadrant (Quadrant 2) represents the “low importance-high satisfaction” performance attributes, so called “undervalued” ones (What, n.d.). System designers should rethink the resources allocated to these services or they should figure out how they can improve the images of these performance attributes so that users think that they are important (like the ones in Quadrant 1) (Hernon & Calvert, 2005, pp. 384-385).
The lower left quadrant (Quadrant 3) denotes the “low importance-low satisfaction” performance attributes. These are relatively less important performance attributes in the eyes of users with relatively lower satisfaction levels attained (i.e., “unimportant weaknesses” that can be ignored). The investment that has been made in them should be re-examined and resources perhaps be transferred to improve other performance attributes that are perceived as more important by the users (Hernon & Calvert, 2005, pp. 384-385).
Performance attributes with “high importance-low satisfaction” levels are located in the lower right quadrant (Quadrant 4). The attributes falling into Quadrant 4 are also very important for users but they do not think the system has an outstanding performance in terms of these attributes. Performance attributes in Quadrant 4 (“Opportunity quadrant”) are candidates for immediate attention of web site designers to improve service quality so that users’ expectations can be met more successfully (What, n.d.).
Gaps that exist between importance and satisfaction were identified by gap analysis. “Large gaps between importance and satisfaction rating usually draw attention to problems that must be corrected. Small gaps signify strengths.” (National, n.d.)
We present the findings of our study on a gap analysis graph and quadrant charts to identify strengths and weaknesses of web sites as well as to find out the “undervalued” or “overdone” performance attributes. Based on the outcome of quadrant analysis and gap analysis, it is possible to identify performance attributes that should be retained, improved, revisited or simply ignored.
Findings and Discussion
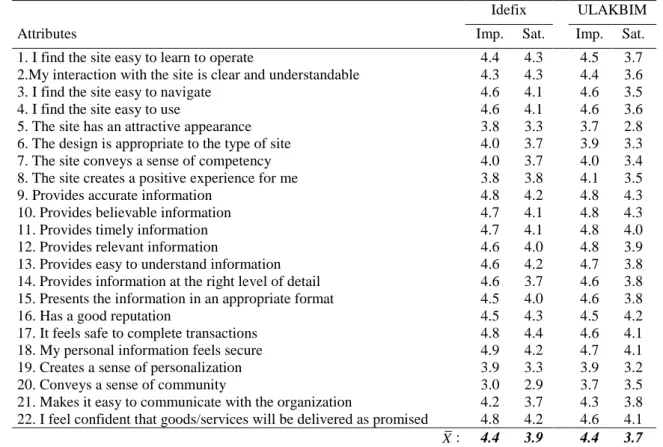
Mean importance and satisfaction scores for each performance attribute for both the Idefix and ULAKBIM web sites are given in Table 1.
On a five-point scale ranging from 1 (“not important at all”) to 5 (“very important”), performance attributes that received the highest mean scores of importance from Idefix users were as follows (the average of means was 4.4):
“18. My personal information feels secure” (mean 4.9);
“9. Provides accurate information” (mean 4.8);
“17. It feels safe to complete transactions” (mean 4.8);
“22. I feel confident that goods/services will be delivered as promised” (mean 4.8);
“10. [The web site] Provides believable information” (mean 4.7);
“11. [The web site] Provides timely information” (mean 4.7).
Performance attributes that received the highest mean scores of importance from ULAKBIM users were as follows (the average of means was 4.4):
“9. [The web site] Provides accurate information” (mean 4.8);
“10. [The web site] Provides believable information” (mean 4.8);
“11. [The web site] Provides timely information” (mean 4.8);
“12. [The web site] Provides relevant information” (mean 4.8);
“13. [The web site] Provides easy to understand information” (mean 4.7); “18. My personal information feels secure” (mean 4.7).
Table 1. Mean importance and satisfaction scores
Idefix ULAKBIM
Attributes Imp. Sat. Imp. Sat.
1. I find the site easy to learn to operate 4.4 4.3 4.5 3.7
2.My interaction with the site is clear and understandable 4.3 4.3 4.4 3.6
3. I find the site easy to navigate 4.6 4.1 4.6 3.5
4. I find the site easy to use 4.6 4.1 4.6 3.6
5. The site has an attractive appearance 3.8 3.3 3.7 2.8
6. The design is appropriate to the type of site 4.0 3.7 3.9 3.3
7. The site conveys a sense of competency 4.0 3.7 4.0 3.4
8. The site creates a positive experience for me 3.8 3.8 4.1 3.5
9. Provides accurate information 4.8 4.2 4.8 4.3
10. Provides believable information 4.7 4.1 4.8 4.3
11. Provides timely information 4.7 4.1 4.8 4.0
12. Provides relevant information 4.6 4.0 4.8 3.9
13. Provides easy to understand information 4.6 4.2 4.7 3.8
14. Provides information at the right level of detail 4.6 3.7 4.6 3.8 15. Presents the information in an appropriate format 4.5 4.0 4.6 3.8
16. Has a good reputation 4.5 4.3 4.5 4.2
17. It feels safe to complete transactions 4.8 4.4 4.6 4.1
18. My personal information feels secure 4.9 4.2 4.7 4.1
19. Creates a sense of personalization 3.9 3.3 3.9 3.2
20. Conveys a sense of community 3.0 2.9 3.7 3.5
21. Makes it easy to communicate with the organization 4.2 3.7 4.3 3.8 22. I feel confident that goods/services will be delivered as promised 4.8 4.2 4.6 4.1
X: 4.4 3.9 4.4 3.7 Note: “Imp.” and “Sat.” stands for mean importance and mean satisfaction scores. X represents the average of mean scores. It is clear that web site users of the for-profit online bookstore (Idefix) attached tremendous importance to security, safety and confidence issues as well as to receiving believable and timely information. Receiving accurate, believable, timely, relevant and easy to understand information were also the most important performance attributes for web site users of the not-for-profit information center (ULAKBIM). They were also concerned with the security of their personal information held by the information center.
Statements that received the lowest mean scores of importance from Idefix and ULAKBIM users were very similar to each other, although the order of importance for ULAKBIM was slightly different (the order of number 6 and 7 was reversed and number 8 was not among the lowest mean scores of ULAKBIM):
“6. The design is appropriate to the type of site” (Idefix mean: 4.0; ULAKBIM mean: 3.9);
“7. The site conveys a sense of competency” (Idefix mean: 4.0; ULAKBIM mean: 4.0);
“19. Creates a sense of personalization” (Idefix mean: 3.9; ULAKBIM mean: 3.9);
“5. The site has an attractive appearance” (Idefix mean: 3.8; ULAKBIM mean: 3.7);
“8. The site creates a positive experience for me” (Idefix mean: 3.8);
Users of both the for-profit and not-for-profit web sites attached much less importance to such usability and interaction quality issues as attractive appearance of the web site or the availability of personalization features. As indicated earlier, users were also asked to rate their perceived satisfaction levels for each performance attribute of the web site that they used (e.g., Idefix’s or ULAKBIM’s web site). The highest mean scores of perceived satisfaction for Idefix users were as follows (average of means was 3.9):
“17. It feels safe to complete transactions” (mean 4.4);
“1. I find the site easy to learn to operate” (mean 4.3);
“2. My interaction with the site is clear and understandable” (mean 4.3);
“16. [The web site] Has a good reputation” (mean 4.3);
“9. [The web site] Provides accurate information” (mean 4.2);
“13. [The web site] Provides easy to understand information” (mean 4.2);
“18. My personal information feels secure” (mean 4.2);
“22. I feel confident that goods/services will be delivered as promised” (mean 4.2).
Corresponding highest mean scores of perceived satisfaction for ULAKBIM users were as follows (average of means was 3.7):
“9. [The web site] Provides accurate information” (mean 4.3);
“10. [The web site] Provides believable information” (mean 4.3);
“16. [The web site] Has a good reputation” (mean 4.2);
“17. It feels safe to complete transactions” (mean 4.1);
“18. My personal information feels secure” (mean 4.1);
“22. I feel confident that goods/services will be delivered as promised” (mean 4.1).
Users of both web sites found systems’ reputation, safety and security most satisfactory. They highly trusted the accuracy of information provided. ULAKBIM web site users perceived it very easy to communicate with ULAKBIM while Idefix users highly appreciated the ease of operation and their straightforward interaction with the web site.
Two out of three performance attributes that were rated as the least satisfactory by users of these web sites were in common (numbers represent Idefix’s order of importance along with the lowest mean scores for both web sites):
“5. The site has an attractive appearance” (Idefix mean: 3.3; ULAKBIM mean: 2.8);
“19. [The web site] Creates a sense of personalization” (Idefix mean: 3.3; ULAKBIM mean: 3.2);
“20. [The web site] Conveys a sense of community” (Idefix mean: 2.9; ULAKBIM mean: 3.5).
Users did not find the web sites attractive at all and they thought that the personalization features available on the web sites were quite unsatisfactory.
It appears that all performance attributes included in the E-Qual Index were important to users and the mean of means of importance for both Idefix (X=4.4, SD=0.8) and ULAKBIM (X=4.4, SD=0.7) were higher than those of satisfaction (Idefix: X=3.9, SD=1.0; ULAKBIM: X=3.7, SD=1.2).
No statistically significant correlation was observed between the ranks of importance and ranks of satisfaction scores of Idefix and ULAKBIM web site users. (Spearman’s correlation coefficient was greater than .05 in each case.) That is to say, users of each web site attached importance to relatively different performance attributes. Similarly, there was no statistically significant correlation between the ranks of each web site’s importance and satisfaction scores. Users were not necessarily satisfied with the performance attributes that they rated highly important and vice versa.
As both Idefix and ULAKBIM data were not normally distributed (p values for Kolmogorov-Smirnov tests were below .05), a nonparametric (Wilcoxon signed rank) test was applied. Differences between the mean scores of importance and satisfaction for both ULAKBIM and Idefix web sites users were statistically significant for all but three performance attributes (question numbers 8, 16 and 20). The following statements did not elicit statistically significant differences between importance and satisfaction mean scores:
“20. [The web site] Conveys a sense of community” (Idefix and ULAKBIM);
“8. The site creates a positive experience for me” (Idefix); and
“16. [The web site] Has a good reputation for me” (ULAKBIM).
Minimum and maximum distances from the mean scores of importance and satisfaction for performance attributes seemed to vary for Idefix and ULAKBIM users. For instance, security (question no. 18) was considered the most important performance attribute by Idefix users (4.9 points out of 5.0, the average being 4.4) while accurate, believable, timely and relevant information (question nos. 9, 10, 11 and 12) were the most important attributes for ULAKBIM users (4.8 out of 5, average being 4.4). The web site conveying a sense of community (question no. 20) was considered the least important attribute for both Idefix and ULAKBIM users (3.0 and 3.7 points, respectively).
The attractive appearance of a web site (question no. 5) was also considered equally least important by ULAKBIM users (3.7). Idefix users were highly satisfied (4.4, average being 3.9) with the safety of Idefix web site (question no. 17) whereas ULAKBIM users found accurate and believable information (question nos. 9 and 10) furnished by ULAKBIM web site quite satisfactory (4.3, average being 3.7). Idefix users found the Idefix web site’s conveyance of a sense of community (question no. 20) much less satisfactory (2.9) and ULAKBIM users reckoned ULAKBIM’s web site much less attractive (average 2.8, question no. 5).
Quadrant Analysis
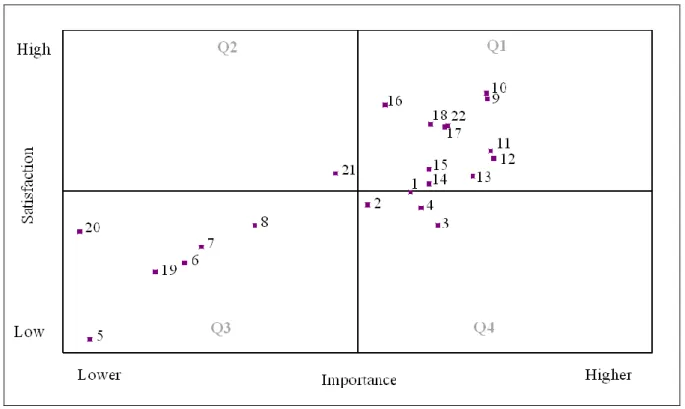
Distances from the mean scores of importance and satisfaction for each performance attribute were plotted on a quadrant graph for the Idefix web site (Figure 1).
Figure 1. Quadrant graph of performance evaluation of Idefix web site (■’s correspond to mean scores of the attribute numbers in Table 1)
Quadrant 1 (Q1) contains performance attributes which Idefix users rated highly important and that they were highly satisfied with. To put it differently, performance attributes in Q1 denote the strengths of the Idefix web site. These attributes were as follows (numbers correspond to question numbers in Table 1):
“1. I find the site easy to learn to operate”; “3. I find the site easy to navigate”; “4. I find the site easy to use”;
“9. The site creates a positive experience for me”; “10. [The web site] Provides believable information”; “11. [The web site] Provides timely information”; “12. [The web site] Provides relevant information”;
“13. [The web site] Provides easy to understand information”; “15. [The web site] Presents the information in an appropriate format”; “16. [The web site] Has a good reputation”;
“17. It feels safe to complete transactions”; “18. My personal information feels secure”;
“22. I feel confident that goods/services will be delivered as promised”.
As the list suggests, the Idefix web site has some strong performance attributes related with usability (nos. 1, 3-4), information quality (nos. 9-13, 15) and interaction quality (nos. 16-18, 22).
Quadrant 2 (Q2) represents “low importance-high satisfaction” performance attributes and the Idefix web site has only one performance attribute pertaining to usability in Q2 (no. 2: “My interaction with the site is clear and
understandable”). It seems that users “undervalued” this performance attribute (What, n.d.). To put it differently, efforts expended by Idefix web site designers exceeded users’ expectations (i.e., “overkill”) (National, n.d.).
Quadrant 3 (Q3) represents “low importance-low satisfaction” performance attributes of Idefix web site. These were as follows:
“5. The site has an attractive appearance”; “6. The design is appropriate to the type of site”; “7. The site conveys a sense of competency”; “8. The site creates a positive experience for me”; “19. [The web site] Creates a sense of personalization”; “20. [The web site] Conveys a sense of community”;
“21. [The web site] Makes it easy to communicate with the organization”.
Performance attributes in Q3 were seen as relatively unimportant by Idefix users. It is interesting to note that performance attributes of personalization, sense of community and easy communication with the organization (nos. 19-21) were not seen as very important by Idefix users but they were not terribly impressed by what the Idefix web site delivered in this respect.
Quadrant 4 (Q4) represents “high importance-low satisfaction” performance attributes. Idefix has one performance attribute related with information quality in Q4 (no. 14: “[The web site] Provides information at the right level of detail”). Idefix users did not seem to be satisfied with the level of detail that Idefix web site provided. Designers can benefit from users’ feedback to improve the level of satisfaction for this performance attribute.
Figure 2 provides the quadrant graph for the ULAKBIM web site.
Performance attributes of the ULAKBIM web site contained in Q1 are similar to those of the Idefix web site (nos. 1, 9-13, 15-18, 22) with the exceptions that the ULAKBIM graph (a) lacks performance attributes pertaining to usability such as ease of navigation and ease of use (nos. 3-4) in Q1; and (b) has an additional performance attribute of information quality (no. 14).
Q2 has one performance attribute (no. 21: “[The web site] Makes it easy to communicate with the organization”) that represents low importance but high satisfaction. ULAKBIM’s efforts to improve performance for this attribute seem to have been “undervalued” by its users.
Q3 has six performance attributes representing both usability (nos. 5-8) and service interaction (nos. 19-20): “5. The site has an attractive appearance”;
“6. The design is appropriate to the type of site”; “7. The site conveys a sense of competency”;
“8. [The web site] Creates a positive experience for me”; “19. [The web site] Creates a sense of personalization”; “20. [The web site] Conveys a sense of community”.
ULAKBIM users seem not to have minded the weaknesses of these attributes.
Q4 has three performance attributes related with usability (nos. 2-4) of ULAKBIM web sites: “2. My interaction with the site is clear and understandable”;
“3. I find the site easy to navigate”; “4. I find the site easy to use”.
In users’ eyes, these attributes carry high importance but users did not think it was easy to navigate or use the web site. Thus, the immediate attention of ULAKBIM’s web site designers is needed.
Results of quadrant analysis suggest that both the Idefix and the ULAKBIM web sites satisfy more than half the performance attributes listed in the E-Qual Index. Both Idefix and ULAKBIM users seem to attach higher importance to attributes such as ease of use, provision of timely and relevant information, and safety. Performance attributes listed in Q1 are the strengths of both web sites.
Clear and understandable interaction that the Idefix web site offers to its users, and the ease with which users can communicate with ULAKBIM through its web site seem not to have been appreciated enough by web site users, as they undervalued these two performance attributes (Q2). It could be that these two attributes of interaction quality and usability are considered as a “given” by users and they tend to expect such performance criteria to be met by all web sites.
It is interesting to note that both Idefix and ULAKBIM users seem to attach less importance to such attributes as attractive appearance of web site, competency, positive experience, personalization, and sense of community. Both web sites delivered a service that was, in their users’ eyes, somewhat below the average for performance attributes in Q3. In other words, users found these weaknesses not terribly important.
As indicated earlier, Q4 contains high importance but low satisfaction performance attributes. Idefix users did not think the web site provided information at the right level of detail while ULAKBIM users did not find the web site easy to navigate and use. Users’ feedback provides an opportunity for Idefix and ULAKBIM web site designers to correct these shortcomings and be appreciated by their users.
Figure 2. Quadrant graph of performance evaluation of ULAKBIM web site (■’s correspond to mean scores of the attribute numbers in Table 1)
Gap Analysis
Quadrant analysis “does not explicitly identify gaps that may exist between importance and satisfaction”. “Even though a performance attribute appeared in the "high importance and high satisfaction" quadrant, a large gap could exist between importance and satisfaction ratings.” (National, n.d.)
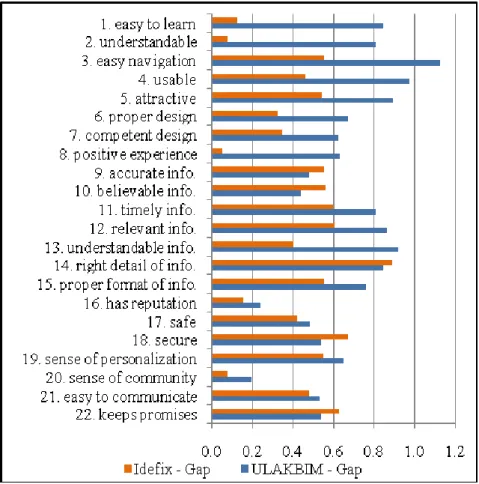
A gap analysis was carried out to identify large gaps (i.e., shortcomings to be fixed), small gaps (i.e., strengths) and negative gaps (i.e., “overkill”). As indicated earlier, users, in general, attached consistently higher importance to performance attributes than their perceived satisfaction levels. Figure 3 illustrates the gaps between importance and satisfaction scores for both Idefix and ULAKBIM web site users.
Gaps between importance and satisfaction scores were, in general, larger for the ULAKBIM web site (X =0.7, SD=0.2) than those of the Idefix web site (X =0.4, SD=0.2), indicating that expectations of Idefix users were met more successfully. The largest gaps between importance and satisfaction scores for the ULAKBIM web site (and therefore the most problematic performance attributes) were as follows: easy navigation, usable, understandable information, attractive and relevant information (questions 3, 4, 13, 5 and 12). The most problematic performance attributes of the Idefix web site were the following: right detail of information, security, keeps promises, timely and relevant information (questions 14, 18, 22, 11 and 12). Performance attributes with the smallest gaps (and thus representing the strengths) were reputation, sense of community and believable information for the ULAKBIM web site (questions 16, 20 and 10), and positive experience, sense of community, understandable, easy to learn and reputation for the Idefix web site (questions 8, 20, 2, 1 and 16). Note that no negative gaps were observed for either web site, indicating that users’ average satisfaction scores were never higher than those of importance scores for any performance attribute.
Results of gap analysis suggest that the ULAKBIM web site has navigation and usability problems, is not attractive and does not offer understandable and relevant information according to its users. The strengths of the web site are that it has reputation, creates a sense of community and offers believable information. The Idefix web site, on the other hand, does not offer timely and relevant information with the right detail, has problems with keeping its promises of delivery of goods and security. Yet, users are satisfied with the positive experience that the Idefix web site offers along with its reputation, understandable and easy to learn user interface.
Figure 3. Gap analysis for Idefix and ULAKBIM
Conclusion
This study was carried out to find out users’ perceptions of service quality for two different web sites, one for-profit (Idefix) and the other not-for-profit (ULAKBIM). It also aimed to investigate the perceived levels of satisfaction of service quality attributes and their importance as rated by the users.
Findings indicate that users’ expectations were not fully met by either web site. Yet users were satisfied with service quality of more than half the performance attributes such as ease of use, provision of timely and relevant information, and safety and security, to which they also attached the greatest importance. For-profit web site users were more concerned about safety and security of the systems they used while not-for-profit users valued accurate, timely and relevant information. Users were much less concerned with attractive appearance of web sites regardless of the type of web site (i.e., for-profit or not-for profit). They were most satisfied with service quality of safety and security offered by web sites but highly dissatisfied with personalization features available (or lack thereof).
ULAKBIM web site users did not find the web site easy to navigate and use, although they thought these performance attributes quite important. Similarly, Idefix users were not pleased with the level of detail of information presented by the web site. These performance attributes should be revisited to meet the service quality expected by the users.
Some performance attributes such as clear and understandable interaction and easy communication seem to have been undervalued by users. They were more forgiving of, and attached relatively less importance to, service quality provided by web sites for performance attributes such as personalization and a web site creating a sense of community.
References
Barnes, S. & Vidgen, R. (2000). WebQual: An exploration of web-site quality. Proceedings of the Eighth European Conference on Information Systems. Retrieved January 20, 2010, from http://is.lse.ac.uk/asp/aspecis/20000052.pdf
Barnes, S. & Vidgen, R. (2001). Assessing the quality of auction web sites. Proceedings of the Hawaii International Conference on Systems Sciences. Retrieved January 20, 2010, from http://www.webqual.co.uk/papers/auction.pdf
Barnes, S. & Vidgen, R. (2002). An integrative approach to the assessment of ecommerce quality. The Journal of Electronic Commerce Research, 3(3), 114-127. Retrieved December 29, 2009, from http://www.webqual.co.uk/papers/bookstore.pdf
Barnes, S. & Vidgen, R. (2003a). Measuring web site quality improvements: a case study of the forum on strategic management knowledge exchange. Industrial Management and Data Systems, 103(5), 297-309. Retrieved December 29, 2009, from http://www.webqual.co.uk/papers/webqualfsmke.pdf
Barnes, S. & Vidgen, R. (2003b). Interactive e-government: evaluating the web site of the UK Inland Revenue. Journal of Electronic Commerce in Organizations, 2(1), 42-63. Retrieved December 29, 2009, from http://www.webqual.co.uk/papers/inlandrevenue.pdf
Barnes, S. & Vidgen, R. (2005). Data triangulation in action: using comment analysis to refine web quality metrics. Proceedings of the 13th European Conference on Information Systems. Retrieved January 20, 2010, from http://www.webqual.co.uk/papers/comment.pdf
Caruana, A., Ewing, M.T., & Ramaseshan, B. (2000). Assessment of the three-column format SERVQUAL: An experimental approach. Journal of Business Research, 49(1), 57-65.
Cook, C. & Thompson, B. (2000). Reliability and validity of SERVQUAL scores used to evaluate perceptions of library service quality. The Journal of Academic Librarianship, 26(4), 248-258.
Garrity, E.J., Glassberg, B., Kim, Y.J., Sanders, G.L., & Shin, S.K. (2005). An experimental investigation of web -based information systems success in the context of electronic commerce. Decision Support Systems, 39, 485-503.
Hernon, P. & Calvert, P. (2005). E-service quality in libraries: Exploring its features and dimensions. Library & Information Science Research 27, 377–404.
Li, Y.N., Tan, K.C., & Xie, M. (2002). Measuring web-based service quality. Total Quality Management, 13(5), 685-700. Lindgaard, G. & Dudek C. (2003). What is this evasive beast we call user satisfaction? Interacting with Computers, 15,
429-452.
Muylle, S., Moenaert, R., & Despontin, M. (2004). The conceptualization and empirical validation of web site user satisfaction. Information & Management, 41, 543-560.
National Survey Research Center. (n.d.). Analyzing customer satisfaction survey results using gap analysis. Retrieved January 20, 2010, from http://www.nsrc.com/services/ac_gap.html
Negash, S., Ryan, T., & Igbaria, M. (2003). Quality and effectiveness in web -based customer support systems. Information & Management, 40, 757-768.
Parasuraman, A., Zeithaml, V.A., & Berry, L.L. (1985). A conceptual model of service quality and its implications for future research. Journal of Marketing, 49(4), 41-50.
Parasuraman, A., Zeithaml, V.A., & Malhotra, A. (2005). E-S-QUAL: A multiple item scale for assessing electronic service quality. Journal of Service Research, 7(3), 213-234.
Piccoli, G., Brohman, M.K., Watson, R.T., & Parasuraman, A. (2004). Net-based customer service systems: Evolution and revolution in website functionalities. Decision Sciences Journal, 35(3), 423-455.
Shih, H.-P. (2004a). An empirical study on predicting user acceptance of e-shopping on the Web. Information & Management, 41, 351-368.
Shih, H.-P. (2004b). Extended technology acceptance model of Internet utilization behavior. Information & Management, 41, 719-729.
Soydal, İ. (2008). Web bilgi sistemlerinde hizmet kalitesi (Service quality of Web information systems).Unpublished doctoral dissertation, Hacettepe University, Ankara.
Tonta, Y. & Soydal, İ. (2009). Service quality of web information systems. QQML2009, Quantitative and Qualitative Methods in Libraries International Conference, 26-29 of May 2009, Chania, Crete, Greece. Retrieved January 20, 2010, from http://yunus.hacettepe.edu.tr/~tonta/yayinlar/tonta-soydal-chania-2009.pdf
Van Iwaarden, J., Van der Wiele, T., Ball, L., & Millen, R. (2004). Perceptions about the quality of web sites: a survey amongst students at Northeastern University and Erasmus University. Information & Management, 41, 947-959.
Vavra, T.G. (1997). Improving your measurement of customer satisfaction: A guide to creating, conducting analyzing, and reporting customer satisfaction measurement programs. Milwaukee: ASQ Quality Press.
What is quadrant analysis? (n.d.). Retrieved November 2, 2009, from http://www.people-first.com/quad.html
Yang, Z., Cai, S., Zhou, Z., & Zhou N. (2005). Development and validation of an instrument to measure user perceived service quality of information presenting web portals. Information & Management, 42, 575-589.
Zeithaml, V.A. (2000). Service quality, profitability, and the economic worth of customers: What we know and what we need to learn. Journal of Academy of Marketing Science, 28, 67-85.