INSTITUTE OF HEALTH SCIENCES
EVALUATING THE CONSISTENCY OF THE TALK TEST
BY COMPARING RESPONSES DURING DIFFERENT
MODES OF EXERCISE
Mohammad HAMADA, PT
Program of Cardiopulmonary Rehabilitation MASTER THESIS
ANKARA 2017
INSTITUTE OF HEALTH SCIENCES
EVALUATING THE CONSISTENCY OF THE TALK TEST BY COMPARING RESPONSES DURING DIFFERENT
MODES OF EXERCISE
Mohammad HAMADA, PT
Program of Cardiopulmonary Rehabilitation MASTER THESIS
ADVISOR OF THESIS Prof. Dr. Deniz INAL INCE
ANKARA 2017
TEŞEKKÜR
Bu çalışmanın her aşamasında tecrübesi, bilgisi ve yardımıyla yanımda olan danışmanım sayın Prof. Dr. Deniz İNAL İNCE’ye
Bu çalışmanın öncesi ve sırasında bilgisi ve fikrini paylaşan sayın Prof. Dr. Hülya ARIKAN’a
Bu çalışma yapılabilmesi için Kardiopulmoner Rehabilitasyon Ünitesi’nde yardımcı olan ve çalışmanın yorumlanmasında değerli katkıları olan jüri üyeleri sayın Doç. Dr. Melda SAĞLAM ve sayın Doç. Dr. Naciye VARDAR YAĞLI’ya
Çalışmanın yorumlanmasında ve başarılı olmasındaki değerli katkıları nedeni ile jüri üyeleri sayın sayın Prof. Dr. Aynur AYŞE KARADUMAN ve Doç. Dr. Neslihan DURUTÜRK’e,
Bu çalışma yapılabilmesi için Kardiopulmoner Rehabilitasyon Ünitesi’nde tüm çalışan araştırma görevlilere teşekkür ederim.
ABSTRACT
Hamada M., Evaluating the consistency of the talk test by comparing responses during different modes of exercise. Hacettepe University, Health Sciences Institute, MSc Thesis in Cardiopulmonary Rehabilitation, Ankara, 2017. Previous studies investigating the consistency of talk test and its relationship with ventilatory threshold used bicycle or treadmill tests and compared the physiological responses of two trials of the same test. No study compared the responses between two different tests, and no study used field testing to detect the consistency of talk test. The purpose of this study was to evaluate the consistency of talk test in healthy subjects by comparing the responses of two different types of exercise. We included 18 healthy subjects (23.44±3.31year, 13 males, 5 females). The subjects’ demographic and physical characteristics were recorded. Bicycle exercise test and the incremental shuttle walk test (ISWT) were used for exercise testing. The talk test was applied during each exercise test, and last positive, equivocal and the first negative stages were determined. Vital signs were recorded, and dyspnea and fatigue using the modified Borg Scale were evaluated before and after each test. Maximal heart rate, the percentage of maximal heart rate, and maximal oxygen consumption during the bicycle exercise test were significantly lower than those of the ISWT (p<0.05) but fatigue levels were similar between the tests (p>0.05). Heart rate and percentage of maximal heart rate in the last positive and equivocal stages of ISWT were significantly higher than those of the bicycle test (p<0.05) but not for the first negative stage (p>0.05). Fatigue and maximum oxygen consumption values were similar in the last positive and equivocal stages of the two tests (p>0.05); however, bicycle test were significantly higher than ISWT in the first negative stage there was a significant difference between the tests (p<0.05). We found that the talk test applied during the two tests was consistent during the first negative level of the talk test. For heart rate, percentage of maximal heart rate, while for fatigue and oxygen consumption, it was consistent in the last positive and equivocal stages, and these stages could be used to prescribe the intensity of exercise of bicycle or walking in respect to the criteria (heart rate, fatigue or maximum oxygen consumption) would be used.
Key Words: talk test, consistency, exercise test, incremental shuttle walk test, health
ÖZET
Hamada M., Sağlıklı bireylerde iki farklı egzersiz tipindeki cevapları karşılaştırmada konuşma testinin tutarlılığının değerlendirilmesi. Hacettepe Üniversitesi, Sağlık Bilimleri Enstitüsü, Kardiopulmoner Rehabilitasyon yüksek lisans tezi. Ankara, 2017. Literatürde konuşma testinin tutarlılığını ve bu testin ventilatuar eşik ile ilişkisini çok sayıda çalışma bisiklet ergometresi ve koşubandını kullanmış ve aynı testin iki farklı denemesinde fizyolojik cevaplar karşılaştırılmıştır. İki test arasında fizyolojik cevapları karşılaştıran ve saha testi kullanan çalışma bulunmamaktadır. Bu çalışmada, iki farklı egzersiz testinin cevaplarını karşılaştırmada konuşma testinin tutarlılığının değerlendirilmesi amaçlandı. Çalışmaya sağlıklı 18 olgu (23.44±3.31yıl, 13 erkek, 5 kadın) dahil edildi. Katılımcıların demografik ve fiziksel özellikleri kaydedildi. Bisiklet ergometresi ve artan hızda mekik yürüme testi ile egzersiz kapasitesi değerlendirildi. Egzersiz testleri sırasında konuşma testi uygulandı ve son pozitif, belirsiz ve birinci negatif basamaklar belirlendi. Test öncesi ve sonrasında vital bulgular, dispne ve yorgunluk algılaması modifiye Borg skalası ile değerlendirildi. Bisiklet testinde ölçülen maksimum kalp hızı, maksimum kalp hızı yüzdesi ve maksimum oksijen tüketimi değerleri mekik testi sırasında ölçülen değerlerden anlamlı olarak daha düşüktü (p<0.05), iki testin yorgunluk değerleri birbirine benzerdi (p>0.05). mekik testi sırasında uygulanan konuşma testinin son pozitif ve belirsiz aşamasındaki kalp hızı ve maksimum kalp hızı yüzdesi değerleri bisiklet testi değerlerinden anlamlı olarak daha yüksekti (p<0.05). Birinci negatif aşaması açısından iki test benzerdi (p>0.05). Konuşma testinin son pozitif ve belirsiz aşamasındaki yorgunluk ve zirve oksijen tüketimi için iki test arasında önemli bir fark yokken (p>0.05) bisiklet testinde kaydedilen birinci negatif aşamasında, mekik testine göre anlamlı olarak daha yüksek bir değere ulaşıldı (p<0.05). Sonuç olarak, test sırasındaki ve konuşma testin birinci negatif aşamasında, kalp hızı ve maksimum kalp hızı yüzdesi için konuşma testi tutarlı olduğu; yorgunluk algılaması ve oksijen tüketimi için son pozitif ve belirsiz aşamalarında tutarlı olduğunu belirlendi. Bu son iki aşama kriterlere göre (kalp hızı, yorgunluk, maksimum oksijen tüketimi) konuşma testi, bisiklet veya yürüme egzersiz şiddetini belirlemek için kullanılabilir.
Anahtar Kelimeler: konuşma testi, egzersiz testi, tutarlılık, artan hızda mekik yürüme testi, sağlıklı.
CONTENTS
APPROVAL PAGE ii
INTELLECTUAL PROPERTY iii
ETHICAL DECLARATION iv
ACKNOWLEDGMENT v
ABSTRACT vi
ÖZET vii
CONTENTS viii
SYMBOLS AND ABBREVIATIONS xi
FIGURES xii
TABLES xiii
1. INTRODUCTON 1
2. REVIEW OF LITERATURE 3
2.1. Exercise testing and its development 3
2.2 Indications for exercise testing 5
2.2.1. Evaluation of exercise intolerance 5 2.2.2 Exercise testing for patients with unexplained dyspnea 5 2.2.3 Evaluation of patients with cardiovascular and respiratory disease 5
2.2.4 Preoperative patient evaluation 6
2.2.5 Exercise prescription for pulmonary and cardiac rehabilitation 6
2.3. Contraindications of exercise testing 7
2.4. Prescription of exercise 7
2.4.1. Elements of exercise prescription 8
2.5 Threshold intensity for improving cardiorespiratory fitness 9 2.6. Translating exercise intensity into practical terms 10
2.7. The talk test 11 2.7.1. The physiologic basis of the talk test 11
2.7.2 Protocol of the talk test 12
2.7.3. Translation of exercise testing to exercise prescription using the talk 12 test
2.7.4. Validation of the talk test 13
2.7.5. Reliability of the talk test 13
2.8. The incremental shuttle walk test 13
2.81. Validity, reliability and responsiveness of the incremental shuttle walk test 14 2.8.2. Incremental shuttle walking test in healthy subjects 15 2.9. Graded exercise test on bicycle ergometer 15 2.9.1. Maximal incremental bicycle ergometer protocols 16
3. MATERIALS AND METHODS 17
3.1. Subjects 17
3.2. Methods 18
3.2.1. Assessments 18
3.2.2. Bicycle ergometer exercise test 18
3.2.3. Incremental shuttle walk test 20
3.2.4 The talk test 22
3.3. Statistical analysis 22
4. RESULTS 24
4.1. Demographical data 24
4.2. Assessment of vital signs during the bicycle test 25 4.3. Assessment of vital signs during the two incremental shuttle walk tests 26 4.4 Comparison of the characteristics of the bicycle test and the incremental shuttle walk test 31 4.5. Comparison of heart rate, general fatigue, and oxygen consumption
shuttle walk tests 31 4.6. Assessment of correlations of maximal heart rate, percentage of maximal heart rate, fatigue, maximal oxygen consumption, and peak work rate between the incremental shuttle walk test and bicycle test 34
5. DISCUSSION 36
6. CONCLUSIONS AND RECOMMENDATIONS 53
7. REFERENCES 55
8. APPENDIX
Appendix-1: Ethics Committee approval
Appendix-2: Publications making from the thesis study 9. RESUME
SYMBOLS AND ABBREVIATIONS
BMI Body Mass Index
COPD Chronic Obstructive Pulmonary Disease DBP Diastolic Blood Pressure
HR Heart Rate
HR max Maximal Heart Rate
ISWT Incremental Shuttle Walk Test IQR Interquartile Range
N Number of Subjects
OMNI Omnibus
P Probability
r Spearman Test
SPSS Statistical Package for Social Sciences SpO2 Oxygen Saturation
SBP Systolic Blood Pressure SD Standard Deviation
Vo2max Maximal Oxygen Consumption
%VO2R Percentage of Reserve Oxygen Consumption
VO2peak Peak of Oxygen Consumption
VO2rest Resting Oxygen Consumption
%HRR Percentage of Heart Rate Reserve
χ2 Friedman Test
FIGURES
Figure Page
3.1. The course for the incremental shuttle walk test 20
TABLES
Table Page 2.1. Advantages and disadvantages of maximal and submaximal exercise 4 2.2. Threshold intensities for increasing maximum oxygen consumption
(VO2max) based on initial fitness 9
2.3. Incremental shuttle walk test levels 14
3.1. The protocol of the bicycle test 19
3.2. The levels of incremental shuttle walk test 21 4.1.1 Physical and demographic characteristics of the subjects 24 4.2.1 Heart rate, systolic and diastolic blood pressure, oxygen saturation,
dyspnea, and fatigue during the bicycle test 25 4.2.2 Results of the binary comparisons of the parameters during the bicycle test 26 4.3.1 Heart rate, systolic and diastolic blood pressure, oxygen saturation,
dyspnea, and fatigue during the first incremental shuttle walk test 27 4.3.2 Results of the binary comparisons of the parameters during the first
incremental shuttle walk test 28
4.3.3 Heart rate, systolic and diastolic blood pressure, oxygen saturation,
dyspnea, and fatigue during the second incremental shuttle walk test 29 4.3.4 Results of binary comparisons of the parameters during the second
incremental shuttle walk test 30
4.3.5 Comparison of the distances between the two incremental shuttle
walk tests 30
4.4.1. Comparison of maximal heart rate, percentage of maximal heart rate, fatigue and maximal oxygen consumption between the shuttle walk test
and the bicycle test 31
4.5.1. Comparison of the heart rate responses in the last positive, equivocal, and the first negative levels between the incremental shuttle walk test and the
4.5.2. Comparison of the percentage of maximal heart rate responses in the last
positive, equivocal, and the first negative levels 33 4.5.3. Comparison of fatigue level in the last positive, equivocal, and the first negative levels between the incremental shuttle walk test and bicycle test 33 4.5.4. Comparison of maximal oxygen consumption in the last positive,
equivocal, and the first negative levels between the incremental shuttle
walk test and the bicycle test 34
4.6.1. Correlations of maximal heart rate, percentage of maximal heart rate, fatigue, and maximal oxygen consumption between the incremental
1. INTRODUCTION
Graded exercise testing was first used for the assessment of various physiological parameters such as heart rate and respiratory rate. Its utilization has evolved in that it is used for detecting myocardial ischemia where electrocardiogram is used and for evaluating its prognosis (1, 2).
Nowadays, graded exercise testing is used to assess cardiorespiratory fitness which constitutes the most important component of physical fitness. Maximal oxygen consumption (VO2max) measured during graded exercise testing is the indicator of physical fitness. The VO2max represents the baseline for both exercise prescription and development of fitness level (3).
Exercise prescription consists of four elements which are intensity, time, frequency, and mode. Using the specificity principle, mode of exercise should be first selected according to desired objective. The number of exercise sessions and the duration of each session define frequency and time of exercise, respectively. Intensity of exercise, level of effort, is expressed relative to subject’s maximum aerobic capacity measured as VO2max. After selecting the appropriate exercise level, the intensity is usually translated into heart rate or subjective level of perceived exertion (3).
For prescribing the intensity of exercise, two steps should be followed. First, enforcement of maximal exercise testing aiming to determine physical fitness that is expressed as VO2max. Second, according physical fitness level, a target intensity range based on percentage of reserve oxygen consumption (%VO2R) or percentage of heart rate reserve (%HRR) should be selected, and translated to heart rate or subjective way (3)
Maximal graded exercise testing requires professional’s experience and necessary technological resources. Therefore, a practical, cheap, and valid approach is needed to prescribe and monitor exercise intensity (4). Recently, the talk test has appeared as a valid and practical tool for designing exercise intensity
in various populations including well trained individuals, sedentary and active healthy adults, and cardiovascular patients. The test has been applied during various modes of exercise such as cycling and walking (5, 6). Several studies have investigated the validity and variability of the talk test. Although the association between the talk test and ventilatory threshold has been studied, the consistency of talk test during different modes of exercise has not been evaluated sufficiently (5, 7, 8). Persinger et al. studied the consistency of the talk test comparing the results between treadmill and cycling, and they found a high reliability of the talk test (7).
In this study, we compared the responses during two different exercise (bicycle ergometer test and incremental shuttle walk test, ISWT) to assess the consistency of talk test. The purpose of this study was to investigate the consistency of talk test in healthy subjects by comparing the responses of two different types of exercise.
The hypotheses of this study were as follows:
H0: The talk test is consistent when comparing the responses of two different types of exercise.
H1: The talk test is inconsistent when comparing the responses of two different types of exercise.
2. REVIEW OF LITERATURE
2.1. Exercise testing and its development
The cardiopulmonary exercise testing is an examination which allows us to study responses of cardiovascular and ventilatory systems to exercise stress. Generally, measurement of gas exchange, heart rate, and blood pressure, electrocardiogram are performed during the test. These parameters show the status of the heart, lungs, and blood vessels in the body (9).
The discovery of ST-segment depression in electrocardiogram in patients with coronary heart disease is the basis of modern stress testing (10). In 1929, the first published paper on an exercise test used only heart rate and blood pressure to assess the patient’s cardiac capacity (10). By 1938, Missal used a maximum stress test when he studied normal individuals by having them run up from three to six of stairs (10).
In 1956, modern stress testing has been described when Bruce reported a work test performed on a treadmill, and developed guidelines for grouping patients into the New York Heart Disease Classifications (11).
Nowadays, graded exercise testing is used to assess cardiorespiratory fitness. The VO2max, or peak oxygen consumption (VO2peak), based on the decision of the end point of the test, measured during graded exercise testing is the indicator of physical fitness. The measured value of VO2max, or VO2peak, during treadmill walking and stationary cycling represents the baseline for both exercise prescription and the development of fitness level (3).
Exercise testing is mainly used as performance exercise testing and clinical exercise testing. The performance exercise testing is performed on healthy population in order to promote health, improve fitness, or train the athletes. The clinical exercise testing is performed on patients with signs or symptoms. Both performance exercise testing and clinical exercise testing can be performed either in the field or in the laboratory. The choice depends on the purpose of the test, the
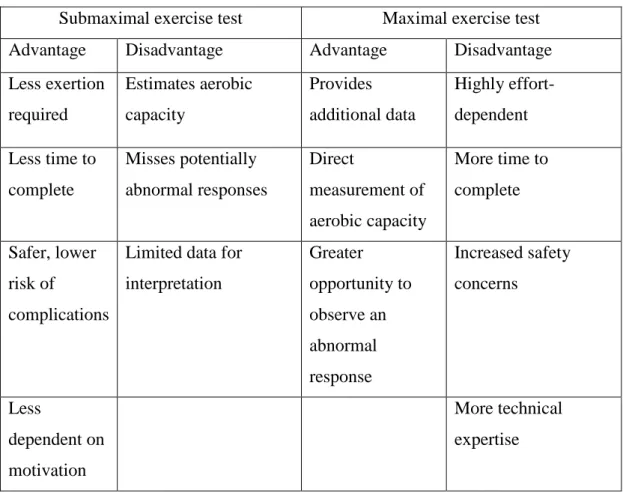
need for precision and accuracy of the variables, and the available instrumentation and staff. The exercise test protocols could be submaximal and maximal. There are several advantages and disadvantages of both submaximal and maximal testing (Table 2.1.1) (12).
Table 2.1. Advantages and disadvantages of maximal and submaximal exercise tests.
Submaximal exercise test Maximal exercise test Advantage Disadvantage Advantage Disadvantage Less exertion required Estimates aerobic capacity Provides additional data Highly effort-dependent Less time to complete Misses potentially abnormal responses Direct measurement of aerobic capacity More time to complete Safer, lower risk of complications
Limited data for interpretation Greater opportunity to observe an abnormal response Increased safety concerns Less dependent on motivation More technical expertise
Maximal graded exercise testing requires professional’s experience and necessary technological resources. Therefore, a practical, cheap, and valid approach is needed to prescribe and monitor exercise intensity (4). Recently, field tests such as ISWT have been used to assess exercise capacity. Fields tests have several advantages in that they are easy to administer, inexpensive, and can be performed wherever a measured distance is available (13).
2.2 Indications for exercise testing
Exercise testing is used for the diagnosis, the assessment of severity and the progression of disease, and responses to treatment (14). The evaluation of exercise tolerance and exercise prescription are also among the main indications for exercise testing.
2.2.1. Evaluation of exercise intolerance
Exercise performance and functional capacity cannot be determined reliably by resting cardiovascular or pulmonary testing especially in individuals with cardiopulmonary disease. In addition, there is a poor correlation between exertional symptoms and resting cardiopulmonary measurements (15, 16). Exercise testing provides objective determination of functional capacity, quantification of factors and pathophysiologic mechanisms limiting exercise, and detection of early disease (17, 18).
2.2.2 Exercise testing for patients with unexplained dyspnea
Exercise testing is considered a useful tool in identifying cardiopulmonary causes, metabolic disorders, and psychological factors (19, 20).
2.2.3 Evaluation of patients with cardiovascular and respiratory disease
Exercise testing is used to assess exercise capacity and response to therapy in patients with cardiopulmonary disorders (21). Exercise testing has a value to detect coronary disease and the evaluation of the prognosis in ischemic and dilated cardiomyopathies (22). High minute ventilation for a given level of metabolism during exercise has been validated as a prognostic marker in severe heart failure (23). For patients with chronic obstructive pulmonary disease
(COPD), exercise testing can determine the exercise capacity in addition to exercise limitations as well as the effects of therapeutic interventions on exercise capacity (24). For patients with interstitial lung disease, exercise testing is used to detection of gas exchange abnormalities which is not revealed by the routine clinical evaluation (25). For patients with cystic fibrosis, the measurement of VO2peak is used as a guide for prognosis and management of disease. The results of exercise testing may provide an optimal exercise prescription affecting pulmonary system (26).
2.2.4 Preoperative patient evaluation
A VO2peak less than 50-60% predicted has been shown to be associated with higher morbidity and mortality after lung resection. The measurement of VO2peak during exercise testing is useful in predicting possible postoperative pulmonary complications after major surgery. Exercise testing is also valuable in assessing disease progression and functional capacity, and quantitating causes of exercise limitations lung or heart transplantation (27-30).
2.2.5 Exercise prescription for pulmonary and cardiac rehabilitation Exercise testing ensures an objective assessment of performance capacity, the determination of anaerobic threshold, the identification of arrhythmia and arterial desaturation (31, 32). Exercise testing can provide important information in the determination of safety, optimizing training intensity, and the documentation of improvement. The exercise-based cardiac rehabilitation is efficient to improve morbidity and mortality risk (33). Cardiac patients are recommended to exercise at moderate- to vigorous-intensity with a minimum of three days in order to prevent myocardial overloading and myocardial ischemia (33).
2.3. Contraindications of exercise testing
Current guidelines separate absolute versus relative contraindications for exercise testing. Absolute contraindications of exercise testing consist of the conditions that could results in potential serious medical consequences such as acute myocardial infarction, unstable angina, uncontrolled cardiac arrhythmia, acute pulmonary embolus, acute myocarditis or pericarditis, and dissecting aortic aneurysm (34). Relative contraindications include the presence of a potential medical issue (left main stenosis, and hypertrophic cardiomyopathy, uncontrolled metabolic disease) and the consideration of concerns regarding the worsening of patient’s condition before the exercise testing (severe arterial hypertension at rest, tachycardia or bradycardia).
2.4. Prescription of exercise
The dose of exercise is considered as an important issue for providing the desired effect. The dose of exercise needed to achieve high-level of running performance is differed from that is required to improve a health related outcome (e.g., lower blood pressure) or fitness (e.g., an increase in VO2max). Usually the intensity, frequency, duration, and type of the activity describe the exercise dose. The intensity of exercise can be specified in terms of the percentage of VO2max, the percentage of maximal heart rate (HRmax), ratings of perceived exertion, and lactate threshold.
The frequency of exercise could include number of days per week and number of times per day while the duration of exercise for each session can be determined as the number of minutes, total kilocalories expended, or total kilocalories expended per kilogram body weight. Whether resistance exercises or cardiovascular endurance exercises are used in the training program specify the types of exercise (35).
2.4.1. Elements of exercise prescription
Prescribing the mode of exercise: For aerobic exercise training, acceptable modes of exercise should use large muscles of the body, and should be aerobic, dynamic and rhythmic in nature, and should be performed in a continuous manner and enjoyable for individual. Walking, jogging, bicycling, swimming, and dancing are commonly used activities in aerobic training (36).
Prescribing the frequency of exercise: Cardiorespiratory fitness progresses with the increased frequency of exercise sessions. The level of fitness stabilizes after three to four sessions per week. Gains in cardiorespiratory fitness with a two-day-per-week program can be obtained with a three-day-per-week program but the intensity of exercise has to be lesser (37-39).
Prescribing the duration of exercise: The duration of exercise is always related to the exercise intensity. The total work of the session (200-300 kcal) is an important variable associated with improvements in exercise capacity once the minimal threshold of intensity is achieved. Generally, if the participants choose to exercise at higher intensities, it would take less time to achieve an energy expenditure goal (31, 37).
Prescribing intensity of exercise: Intensity is the overload needed to bring about a training effect on the cardiovascular system. It has been found that threshold for an improvement in VO2max was 30% of VO2R, defined as the difference between VO2peak and resting oxygen consumption (VO2R = VO2peak - VO2rest) (40), for those with VO2max values less than 40 ml.kg-1.min-1, and 46% VO2Rfor those with a VO2max greater than 40 ml.kg-1.min-1. For the most people, 60% to 80% VO2max is a sufficient range to achieve cardiorespiratory fitness goals (41, 43).
2.5 Threshold intensity for improving cardiorespiratory fitness
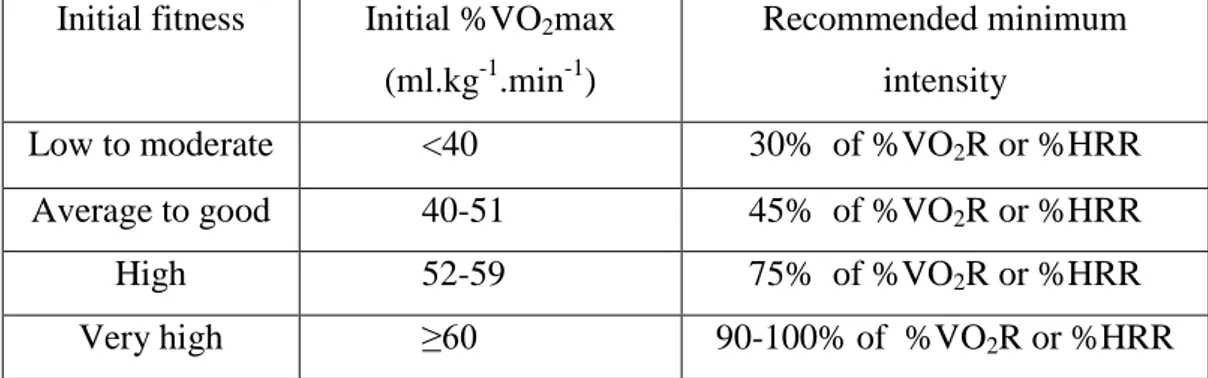
In 1957, Karvonen et al. studied the using of HRR as a means for prescribing intensity. The purpose of their study was to determine if a threshold intensity was required to improve aerobic fitness. Karvonen et al. studied six young adult males and found that an intensity of 60% of %HRR was not sufficient to increase aerobic fitness where an intensity of 71% to 75% of %HRR was required for the fitness to be achieved (43). In its 1998 position stand, American College of Sports Medicine concluded that sedentary individuals need to use an intensity of at least 40% of %VO2R or %HRR whereas more active individuals need an intensity of at least 50% of %VO2R or %HRR. The knowledge of subject’s initial fitness is important to determine an exercise intensity. Individuals with higher initial aerobic capacity requires a higher intensity to further increase that capacity (44).
Table 2.2. Threshold intensities for increasing maximum oxygen consumption (VO2max) based on initial fitness (3)
Initial fitness Initial%VO2max (ml.kg-1.min-1)
Recommended minimum intensity
Low to moderate <40 30% of %VO2R or %HRR
Average to good 40-51 45% of %VO2R or %HRR
High 52-59 75% of %VO2R or %HRR
Very high ≥60 90-100% of %VO2R or %HRR
%VO2R: percentage of reserve oxygen consumption, %HRR: percentage of heart rate reserve, VO2max: maximum oxygen consumption
Most adults should be prescribed intensity within the range of 40% to 89% of %VO2R for exercise of a continuous nature, with 40% to 59% of %VO2R for a moderate intensity and 60% to 89% of %VO2R for a vigorous intensity (45).
2.6. Translating exercise intensity into practical terms
After the assessment, a range of exercise intensity should be chosen depending on the subject’s goals and the current level of fitness. The exercise intensity range must be translated into practical indicators which can be monitored. It is usually performed in one of the following ways:
- Target heart rate, based on either %HRR or %HRmax, - Target workload, calculated from %VO2R or %VO2max, - Subjective rating, based on the talk test or a rating scale.
Target heart rate using %HRR or the percentage of maximal heart rate (HRmax): The use of %HRR is the most accurate way of establishing a target heart rate since it reflects the same percentages of VO2R, and takes into account the resting heart rate which could vary over a wide range (46). Using %HRmax requires a simpler calculation than %HRR. There is no necessity to measure of resting heart rate, and it is convenient to use in group exercise sessions.
Target workload using percentage of oxygen consumption reserve (%VO2R): This method is especially useful for individuals whose heart rate is affected by medications or who find monitoring of heart rate difficult. Using %VO2R, the intensity of exercise can be expressed as an absolute workload, such as a running speed outdoors or a treadmill walking speed (47).
Target workload using percentage of maximum oxygen consumption (VO2max): Using VO2max to target workload has two drawbacks. The VO2max does not translate directly into %HRR units, and does not provide equivalent relative intensities for individuals with different fitness levels (46).
Target intensity using the rate of perceived exertion: Many individuals are able to regulate the intensity of exercise based on how hard it feels. There are two ways: rating of perceived exertion and the talk test. For rating of perceived exertion, the original Borg Scale is widely used. The Borg Scale ranges from 6 to 20 with “6: being at rest” and “20: being at maximal effort” (48). Another common rating of
perceived exertion scale is the OMNI scale which uses pictures illustrating the levels of exertion along with short descriptors and numbers from 0 to 10. It has been used to differentiate feelings of exertion in the legs and chest (49). The talk test requires exercising at or above the ventilatory threshold. The intensity of exercise allows comfortable speaking in complete sentences despite an increased sensation of breathing (50).
2.7. The talk test
Prescribing intensity has been considered as the most difficult element in the process of exercise prescription, particularly when the determination of maximal aerobic capacity is required with a maximal exercise test. Therefore, the exercise testing may be complicated because of the cost and required sophisticated technological resources. A valid, practical, and inexpensive approach to prescribe an exercise intensity is needed (51). Several studies have shown that the talk test is a valid self-reported tool to determine the exercise intensity in well trained, healthy active adults, sedentary individuals, and patients with cardiovascular disease (52, 53).
2.7.1. The physiologic basis of the talk test
During incremental graded exercise, ventilation increases proportionally to exercise intensity up to 50% to 75% VO2max where ventilation begins to rise exponentially, and this inflection point is the ventilatory threshold (54). At the point of ventilatory threshold, lactate and carbon dioxide increase, and the ventilation begins to be faster than ever to remove excess carbon dioxide. After the point of ventilatory threshold, a competition between ventilatory requirements of the speech and the physiological need for gas exchange occurs. Therefore, ventilatory rate should be increased. During vigorous exercise, when more gas exchange is required, comfortable speech becomes impossible (55, 57).
2.7.2 Protocol of the talk test
Talk test is the reciting of a standard paragraph loudly (31 words), this paragraph is often taken from a well-known text for subjects like the national anthem where participants could recite it easily without reading. The test requires 10 to 15 seconds during the last 30 seconds of each stage of an incremental exercise test. After reciting the paragraph, subject is asked if he can talk comfortably and then the answers are recorded. A positive result (an answer of “yes”) allows subject to continue onto the next stage. Equivocal result (an answer of “not sure’” allows subject to continue onto the next stage. Negative result (an answer of “no”) determines the endpoint of the test. The last stage at which subject answers “yes” is referred to as the last positive stage (4).
2.7.3. Translation of exercise testing to exercise prescription using the talk test
The exercise intensity is determined from the talk test may represent an intensity below (last positive), at (equivocal) or above (first negative) the ventilatory threshold. A moderate exercise intensity means an exercise intensity below the ventilatory threshold allows a comfortable speech. When the exercise intensity is above the ventilatory threshold, it is stated that the speech is not comfortable, and the exercise is vigorous (56). Some adjustment is required according to the characteristics of an individual. For the sedentary healthy individuals there is a need for a 10% or at least one stage downregulation may be required. For example, if the equivocal stage is assumed to approximate the ventilatory threshold, the downregulation required to keep the training intensity below ventilatory threshold should be two stages (last positive LP-1) (57, 58).
2.7.4. Validation of the talk test
An exercise intensity less than 61% of VO2max is found to be below the ventilatory threshold whereas ≥61% of VO2max corresponds to the ventilatory threshold (uncomfortable speech) healthy young adults (8). For moderately active individuals, exercise intensity may be below ventilatory threshold and they may have a comfortable speech when exercising an intensity of 69-78% of VO2max. When the exercise intensity exceeded their ventilatory threshold (89% of VO2max), a comfortable speech may not be obtained (7).
2.7.5. Reliability of the talk test
The talk test has been shown as valid to surrogate of gas exchange thresholds in moderately active young adults (7). The VO2peak measured at the ventilatory threshold was similar to the VO2peak at the last positive and\or equivocal stages of the talk test. However, it was less than the VO2peak measured at the first negative level of the talk test both for the treadmill and the bicycle ergometer (7).
2.8. The incremental shuttle walk test (ISWT)
The ISWT was developed to ensure a standardized, externally paced, incremental and progressive field walking test to assess functional capacity in chronic lung disease (59). The ISWT is a standardized incremental field walking test ensuring a symptom-limited maximal exercise performance (60). The ISWT has been used to assess exercise capacity in cardiovascular and pulmonary disorders, critical illness and in healthy individuals of different ages (61-66, 79).
The original ISWT is a 12-level test (one minute in each level) and usually used imposing an incremental acceleration as the subject walks up and down a 10 m course. The walking speed is dictated by an audio signal so that the speed starts
at 0.50 m/s and is increased each minute by 0.17 m/s until a final speed (level 12) of 2.37 m/s (Table 2.3) (67,68).
Table. 2.3. Incremental shuttle walk test (ISWT) levels.
Speed Number of shuttles
per level m/s mph 0.50 1.12 3 0.67 1.50 4 0.84 1.88 5 1.01 2.26 6 1.18 2.64 7 1.35 3.02 8 1.52 3.40 9 1.69 3.78 10 1.86 4.16 11 2.03 4.54 12 2.20 4.92 13 2.37 5.30 14
2.81. Validity, reliability and responsiveness of the incremental shuttle walk test
Many studies assessed the validity of ISWT in individuals with chronic lung and heart disease. Some studies compared ISWT distance and VO2peak during a treadmill or bicycle ergometer, and observed strong correlations between distance walked and VO2peak achieved (r≥0.70). Several studies showed that the distance covered in the both the ISWT and the six minute walk test are strongly correlated (69-73). The ISWT has good test-retest reliability for distances between test repetitions (74, 75). The ISWT is responsive to pulmonary rehabilitation, medical and pharmacologic treatment (76-78)
2.8.2. The incremental shuttle walk test in healthy subjects
The original (12-level) is appropriate to be used in subjects with chronic airways obstruction. Many studies have used the test as an assessment tool in patients with a variety of conditions (61-63). The use of ISWT in healthy subjects is less common (79, 80). Studies using healthy subjects showed that ISWT is associated with anthropometric and demographic variables (78). In another study, the ISWT has been shown to be required maximal effort in healthy subjects of different ages (79). In healthy subjects, 15-level ISWT test has been developed since majority of the healthy subjects and the individuals with minimal disability may exceed the 12th level of the ISWT when eliciting maximal effort during the test (79, 80).
2.9.Graded exercise test on bicycle ergometer
Bicycle ergometers used in exercise tests may be a mechanically braked or electrically braked ergometer. With the mechanically braked type of bicycle ergometer, resistance is applied by a heat-resistant friction apparatus (typically a band surrounding a weighted metal flywheel). The resistance is increased or decreased by tightening or loosening the friction apparatus. The pedal rate can increase or decrease the work rate. In order to maintain the pedal rate, a source of feedback (Visual Analogue Scale or digital display of the rate per minute, rpm) should be provided. When the subject pedals, an electrical current results in a braking action. The load or braking force is inversely proportional to pedaling rate at any chosen work rate (12).
2.9.1. Maximal incremental bicycle ergometer protocols
Exercise test protocols is designed to achieve a rapid gaining of diagnostic data, and used a progressively increasing work rates. A protocol with a constant
increasing work rate or a ramp protocol may be used. At the initial stage of a bicycle exercise test, unloaded pedaling rather than the rest is preferred. The incremental phase of exercise test consists of 5 to 25 watts increase per minute in workload until reaching the exhaustion or termination the test (81). In the computer-controlled bicycle ergometer protocols, work rate can be increased continuously every 1 to 2 seconds in a ramp like fashion (82). In newer exponential exercise protocols, the work rate increases exponentially (15% of the previous work load) every minute of the exercise (83).
According to the literature review, exercise intensity is frequently determined using VO2max and HRmax based on the results of a standardized exercise test. This type of test is required sophisticated laboratory conditions and experienced staff. Monitorization of exercise intensity at least required to monitor heart rate of the exercising individuals during exercise. The talk test is a simple and reliable method to monitor exercise intensity, and is based on standardized exercise tests. The applicability of the talk test during a field test has not been investigated. Therefore, in this study, the consistency of the talk test in healthy subjects was investigated by comparing the responses of two different types of exercise, bicycle ergometer and ISWT.
3. MATERIALS AND METHODS
Investigation the consistency of the talk test using two different exercise tests was our aim of this study which used a randomized methodologic research. The study was performed at Hacettepe University, Faculty of Health Sciences, Department of Physiotherapy and Rehabilitation, Cardiopulmonary Rehabilitation Unit.
3.1. Subjects
Eighteen volunteers participated in this study. Subjects of this study were healthy, non-athlete university students or young adults with similar age. Thirteen (72.2%) were males and five (27.7%) were females. The ethical approval has been obtained for the study from the Committee of Hacettepe University has been for this study, the ethical committee report number is GO 15/193 (Appendix 1). After informing them about the study participants gave the consent to participate in the study.
Inclusion criteria were: - being a healthy individual, - aged over 18 years old.
Exclusion criteria were:
- having any orthopedic or neurologic problem which may affect functional capacity during running and walking,
- having any chronic cardiovascular or pulmonary problem, - having pneumonia or any acute infection.
3.2. Methods
The subjects performed three maximal exercise tests, a bicycle ergometer test and two ISWT where the order of tests was chosen randomly with QUICKCALCS program (GraphPad Software, La Jolla, CA, USA) to assign the subjects to groups (84). After performing the first test, several days were given as a rest until the other test was performed. Two ISWT were performed at the same day with at least 30 min rest between the two tests.
3.2.1. Assessments
For the initial assessment, all subjects underwent general assessment by the same physiotherapist in order to ensure their suitability to participate in the study. Each subject was interviewed by the physiotherapist and has filled in a health status questionnaire containing personal information such as name, age, gender, height, weight, body mass index, the status of education, present medical conditions, and medications as well as present or prior complaints during exercise. Other questions were about subject’s sport interests, and eating and smoking habits, and the level of physical activity where one of four levels was recorded: sedentary, mild, moderate, or vigorously active. General evaluation was intended to check the presence of any possible problems or pathologies, and to ensure that the subjects were healthy before inclusion to the study.
3.2.2. Bicycle ergometer exercise test
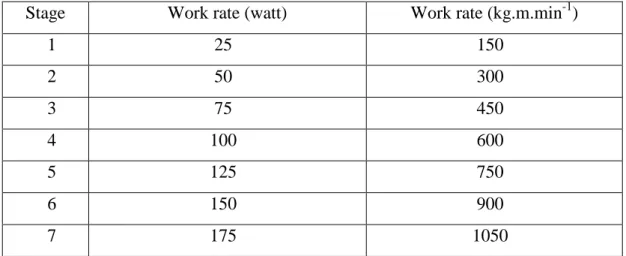
The test was performed by using a bicycle ergometer (Enraf Nonius 955, Monark, Sweden) using a standardized protocol. The protocol consisted of seven levels. Work rate in the first level was 25 watt (150 kg.m.min-1), and this rate increased by 25 watt in every stage until 175 watt in the last stage with stable time of every stage as two minutes for the stage (85), as illustrated in Table 3.1.
Table 3.1. The protocol of the bicycle test
Stage Work rate (watt) Work rate (kg.m.min-1)
1 25 150 2 50 300 3 75 450 4 100 600 5 125 750 6 150 900 7 175 1050
Before and after the bicycle ergometer exercise test, heart rate (Polar 610, Polar Inc, Polar Electro, Finland), oxygen saturation (Model 2500 Pulse Oximeter, Nonin Medical, Plymouth, USA), systolic and diastolic blood pressure (Erka Perfect Aneroid Sphygmomanometer, Germany), and general and leg fatigue measured by using the modified Borg Scale were recorded (86). The maximum workload achieved was recorded as watt. During the last seconds of each stage of tests, general fatigue and heart rate were recorded. The age predicted HRmax were calculated as “220-Age” (56). The data on the first and the fifth minutes of the recovery period (Recovery 1 and Recovery 5, respectively) were also obtained. The VO2max during the bicycle ergometer has been determined by using the following equation (3): VO2max (ml.kg-1.min-1) = 3.5 + 3.5 + 1.8 x (work load [kg]) / (body weight [kg]). The measure of workload (Watt) was converted to kg (1 watt = 6 kg) to enter the equation. The test was ended when subject could not pedal longer, unaffordable leg fatigue or could not keep the determined value of the watch.
3.2.3. Incremental shuttle walk test
In the exercise hall or enclosed corridor, the ISWT has been performed. The standard instructions were used during of the test. The ISWT was explained first, and the subject was told required procedures, and prepared to perform the test. The course for the ISWT was 10 m in length, and was identified for the subject by two cones with an inset of 0.5 m from either end to avoid abrupt changes in directions as showed in Figure 3.1.
Figure 3.1. The course for the incremental shuttle walk test.
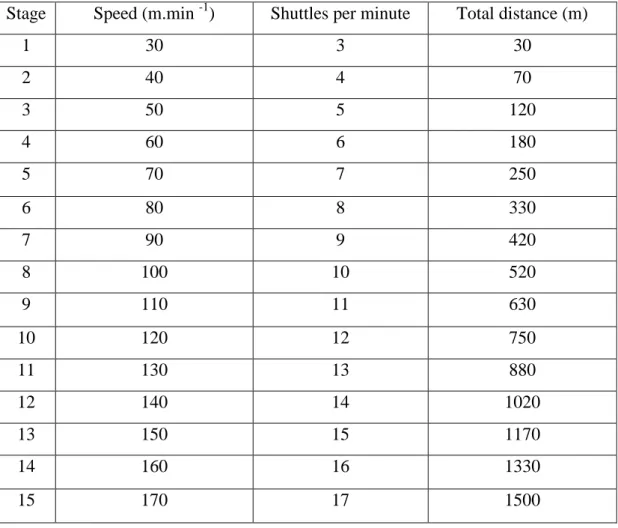
According to the pace of each level that specified by audio signals, the test might require walking or running. This is related to the physical capacity of the subject at incremental speeds on a 10-m course. The ISWT consisted of 15 levels so that the speed of walking increased by 10-m per minute where the subject kept walking speed according to audio signals which determined the number of shuttles of every level in that the signal number incremented one tone during every next level (59) as shown in Table 3.3.
Table 3.2. The levels of incremental shuttle walk test.
Stage Speed (m.min -1) Shuttles per minute Total distance (m)
1 30 3 30 2 40 4 70 3 50 5 120 4 60 6 180 5 70 7 250 6 80 8 330 7 90 9 420 8 100 10 520 9 110 11 630 10 120 12 750 11 130 13 880 12 140 14 1020 13 150 15 1170 14 160 16 1330 15 170 17 1500
During the test, the physiotherapist recorded the shuttles completed by the subjects. A standardized verbal encouragement was offered to the subjects during the test. The participant was encouraged to continue until becoming unable to catch the audio signals. When subjects were fail to keep the required speeds, fail to complete a shuttle on time, reaching age-predicted HRmax, and exhausted the test was completed.
Before and after the ISWT, heart rate (Polar 610, Polar Inc., Polar Electro, Finland), oxygen saturation (Model 2500 Pulse Oximeter, Nonin Medical, Plymouth, USA), systolic and diastolic blood pressure (Erka Perfect Aneroid Sphygmomanometer, Germany), general fatigue and leg fatigue, measured using
the modified Borg Scale (86) were recorded. The data on the first and the fifth minutes of the recovery period (Recovery 1 and Recovery 5, respectively) were also obtained.
During the last seconds of each stage of tests general fatigue and heart rate were recorded. The distance completed during the test was recorded as meters.
The VO2max during the ISWT was calculated using the following formula (70): VO2max (ml.kg-1.min-1) = 4.19 +0.025 x distance. The test was ended in case of exhaustion or missing two conies respectively and reaching age-predicted HRmax.
3.2.4 The Talk Test
During performing the tests a standard paragraph consisting of (31 words which were taken from the first paragraph of Turkish National Anthem) was cited by subjects loudly where citing required 10-15 second during the last 30 seconds of each stage of the test. The subjects recited the paragraph and then they were asked if he could talk comfortably. One of three predicted answers were recorded: “yes” (positive talk test), “not sure” (equivocal talk test), or “no” (negative talk test), during the first levels the “yes” response is expected from the subjects, but with progressing test the “equivocal” and then “no” responses arise when ventilatory threshold is reached (4).
3.3. Statistical analysis
Statistical analyses were performed using Windows-based SPSS 18.0 statistical analysis program (SPSS Inc., Chicago, USA). The sample size was calculated to answer the primary aim of the study and it was based on heart rate (7 unit mean difference with 8 units of standard deviations) using a two-sided alpha=0.05 and a power of 90%, the estimated number of subjects necessary to complete the present study was 16. Considering a drop-out rate of 10%, the final
sample size was 18 subjects. The variables were expressed as frequencies, percentages, and the mean±standard deviation, as appropriate. Friedman analysis of variance was performed for the comparisons. Wilcoxon signed rank test was used to perform Post-hoc comparisons. Spearman correlation analysis was used to investigate the relationship between the variables. The descriptive level of significance was set at p<0.05.
4. RESULTS
4.1. Demographical Data
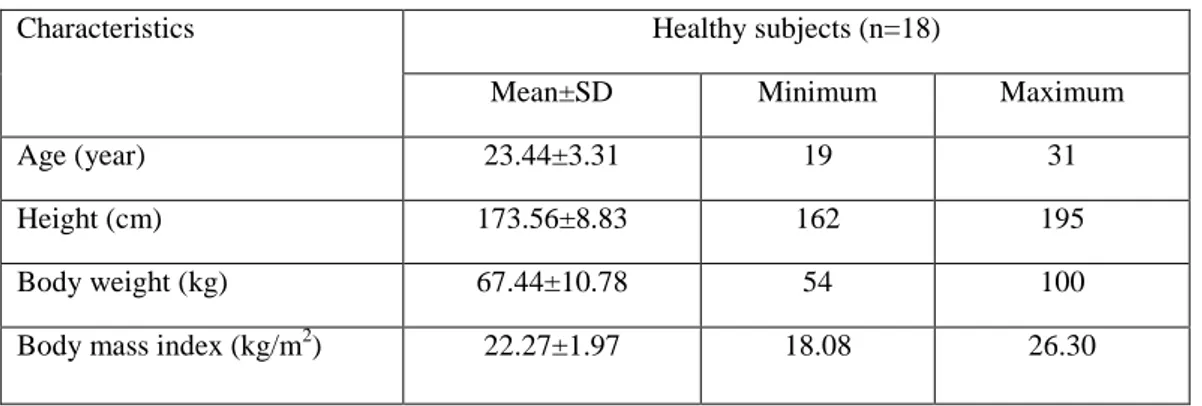
Eighteen healthy individuals participated in this study. Thirteen of them (72.2%) were males, and five of them (27.8%) were females. Their mean age was 23.44±3.31 years, the mean weight was 67.44±10.78 kg, and the mean height was 173.56±8.83 cm. Their mean body mass index was calculated as 22.27±1.97 kg/m2. The physical characteristics of the participants are presented in Table 4.1.1.
Table 4.1.1. Physical and demographic characteristics of the subjects
Characteristics Healthy subjects (n=18)
Mean±SD Minimum Maximum
Age (year) 23.44±3.31 19 31
Height (cm) 173.56±8.83 162 195
Body weight (kg) 67.44±10.78 54 100
Body mass index (kg/m2) 22.27±1.97 18.08 26.30
Seven subjects (38.9%) were participating in regular physical activity, and only one subject (5.6%) was a current smoker. One subject (5.6%) was inactive/sedentary, in terms of professional. Three subjects (16.7%) were mildly active, 14 subjects (77.8%) were moderately active, and no subject were vigorously active in terms of their professional activity. None of the subjects were performing regular physical activity for <15 min/day or 15-30 min/day. Four subjects (22.2%) were performing regular physical activity for 31-60 min/day, and one subject (5.6%) was performing regular physical activity for >60 min/day. Four subjects (22.2%) were continued their regular physical activity for <3
months, and one subject (5.6%) was continued his regular physical activity for >1 years.
4.2. Assessment of Vital Signs during the Bicycle Test
The mean power reached at the end of the bicycle test was 130.56 watt. There was a significant change in heart rate, systolic and diastolic blood pressure, oxygen saturation, dyspnea, and fatigue among periods (Start, End, Recovery 1, and Recovery 5) during the bicycle test (p<0.05, Table 4.2.1).
Table 4.2.1. Heart rate, systolic and diastolic blood pressure, oxygen saturation, dyspnea, and fatigue during the bicycle test
Variables Bicycle test χ2 p Start Mean±SD End Mean±SD Recovery 1 Mean±SD Recovery 5 Mean±SD HR (bpm) 74.11±7.71 171.89±17.70 127.78±19.11 101.83±16.79 54.000 <0.001* SpO2 (%) 97.11±0.90 95.44±1.50 96.72±1.32 96.44±1.04 27.022 <0.001* SBP (mmHg) 106.39±10.96 150.56±17.65 135.00±19.17 112.22±12.03 49.175 <0.001* DBP (mmHg) 71.94±5.72 58.06±12.85 59.44±14.44 68.89±11.06 23.571 <0.001* Dyspnea (Borg, 0-10) 0.00±0.00 4.14±1.97 2.22±1.78 0.44±0.57 50.049 <0.001* General fatigue (Borg, 0-10) 0.06±0.16 5.75±1.97 3.36±1.59 1.03±0.92 52.680 <0.001* Leg fatigue (Borg, 0-10) 0.03±0.12 6.50±2.23 3.83±2.04 1.58±1.15 53.102 <0.001* *
p<0.05, Friedman test, HR: heart rate, SpO2: oxygen saturation, SBP: systolic blood pressure, DBP: diastolic blood pressure
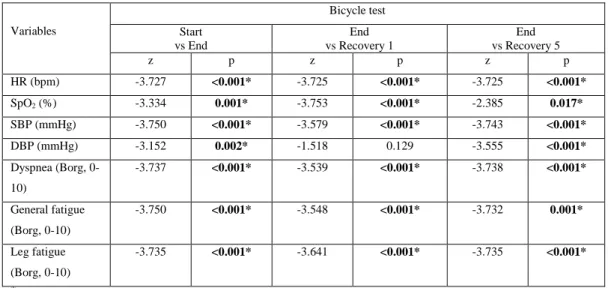
After presenting the binary comparisons of parameters we found that all comparisons (Start, End, Recovery 1, and Recovery 5) of heart rate, oxygen saturation, systolic blood pressure, dyspnea, general fatigue, and leg fatigue were significant (p<0.05, Table 4.2.2) while only Start versus Recovery 5 comparison
of diastolic blood pressure and Start versus Recovery 1 of oxygen saturation were not statistically significant (p>0.05, Table 4.2.2).
Table 4.2.2. Results of the binary comparisons of the parameters during the bicycle test Variables Bicycle test Start vs End End vs Recovery 1 End vs Recovery 5 z p z p z p HR (bpm) -3.727 <0.001* -3.725 <0.001* -3.725 <0.001* SpO2 (%) -3.334 0.001* -3.753 <0.001* -2.385 0.017* SBP (mmHg) -3.750 <0.001* -3.579 <0.001* -3.743 <0.001* DBP (mmHg) -3.152 0.002* -1.518 0.129 -3.555 <0.001* Dyspnea (Borg, 0-10) -3.737 <0.001* -3.539 <0.001* -3.738 <0.001* General fatigue (Borg, 0-10) -3.750 <0.001* -3.548 <0.001* -3.732 0.001* Leg fatigue (Borg, 0-10) -3.735 <0.001* -3.641 <0.001* -3.735 <0.001* *
p<0.05, z: Wilcoxon signed rank test, HR: heart rate, SpO2: oxygen saturation, SBP: systolic blood pressure, DBP: diastolic blood pressure
4.3. Assessment of Vital Signs during The Two Incremental Shuttle Walk Tests
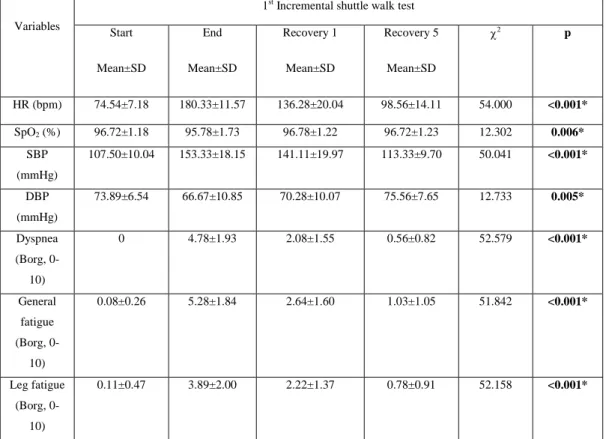
According to the vital signs measured before, after, and during recovery of the first ISWT, there was a significant change in heart rate, systolic and diastolic blood pressure, oxygen saturation, dyspnea, and fatigue among periods (Start, End, Recovery 1, and Recovery 5) (p<0.05, Table 4.3.1).
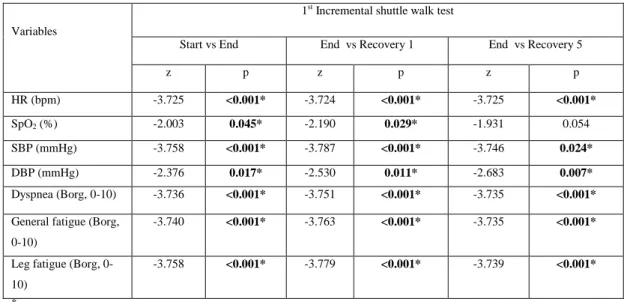
The binary comparisons of parameters showed that all comparisons (Start versus End, Start versus Recovery 1, Start versus Recovery 5) of heart rate, systolic blood pressure, dyspnea, general fatigue, and leg fatigue were significant in the ISWT (p<0.05, Table 4.3.2) while only Start versus Recovery 1 and Start
versus Recovery 5 comparisons of oxygen saturation and diastolic blood pressure were statistically significant (p<0.05, Table 4.3.2).
Table 4.3.1. Heart rate, systolic and diastolic blood pressure, oxygen saturation, dyspnea, and fatigue during the first incremental shuttle walk test
Variables
1st Incremental shuttle walk test Start Mean±SD End Mean±SD Recovery 1 Mean±SD Recovery 5 Mean±SD χ2 p HR (bpm) 74.54±7.18 180.33±11.57 136.28±20.04 98.56±14.11 54.000 <0.001* SpO2 (%) 96.72±1.18 95.78±1.73 96.78±1.22 96.72±1.23 12.302 0.006* SBP (mmHg) 107.50±10.04 153.33±18.15 141.11±19.97 113.33±9.70 50.041 <0.001* DBP (mmHg) 73.89±6.54 66.67±10.85 70.28±10.07 75.56±7.65 12.733 0.005* Dyspnea (Borg, 0-10) 0 4.78±1.93 2.08±1.55 0.56±0.82 52.579 <0.001* General fatigue (Borg, 0-10) 0.08±0.26 5.28±1.84 2.64±1.60 1.03±1.05 51.842 <0.001* Leg fatigue (Borg, 0-10) 0.11±0.47 3.89±2.00 2.22±1.37 0.78±0.91 52.158 <0.001* *p<0.05, χ2
: Friedman test, HR: heart rate, SpO2: oxygen saturation, SBP: systolic blood pressure, DBP: diastolic blood pressure.
Table 4.3.2. Results of the binary comparisons of the parameters during the first incremental shuttle walk test
Variables
1st Incremental shuttle walk test
Start vs End End vs Recovery 1 End vs Recovery 5
z p z p z p HR (bpm) -3.725 <0.001* -3.724 <0.001* -3.725 <0.001* SpO2 (%) -2.003 0.045* -2.190 0.029* -1.931 0.054 SBP (mmHg) -3.758 <0.001* -3.787 <0.001* -3.746 0.024* DBP (mmHg) -2.376 0.017* -2.530 0.011* -2.683 0.007* Dyspnea (Borg, 0-10) -3.736 <0.001* -3.751 <0.001* -3.735 <0.001*
General fatigue (Borg, 0-10)
-3.740 <0.001* -3.763 <0.001* -3.735 <0.001*
Leg fatigue (Borg, 0-10)
-3.758 <0.001* -3.779 <0.001* -3.739 <0.001*
*
p<0.05, z: Wilcoxon signed rank test, HR: heart rate, SpO2: oxygen saturation, SBP: systolic blood pressure, DBP: diastolic blood pressure
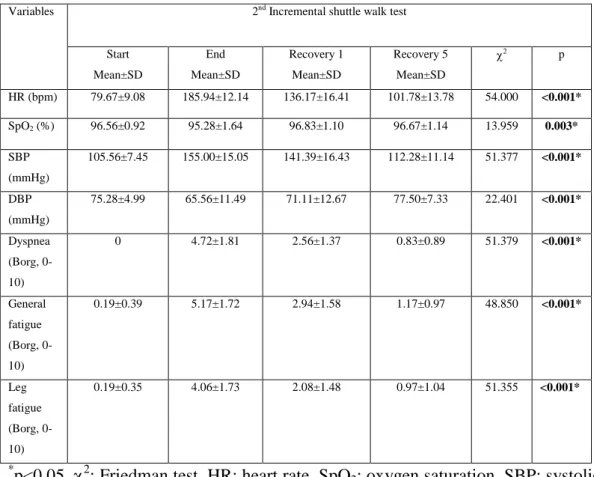
During the second ISWT, a statistically significant change in heart rate, systolic and diastolic blood pressure, oxygen saturation, dyspnea, and fatigue were found among the periods (Start, End, Recovery 1, and Recovery 5) (p<0.05, Table 4.3.3).
Table 4.3.3. Heart rate, systolic and diastolic blood pressure, oxygen saturation, dyspnea, and fatigue during the second incremental shuttle walk test Variables 2nd Incremental shuttle walk test
Start Mean±SD End Mean±SD Recovery 1 Mean±SD Recovery 5 Mean±SD χ2 p HR (bpm) 79.67±9.08 185.94±12.14 136.17±16.41 101.78±13.78 54.000 <0.001* SpO2 (%) 96.56±0.92 95.28±1.64 96.83±1.10 96.67±1.14 13.959 0.003* SBP (mmHg) 105.56±7.45 155.00±15.05 141.39±16.43 112.28±11.14 51.377 <0.001* DBP (mmHg) 75.28±4.99 65.56±11.49 71.11±12.67 77.50±7.33 22.401 <0.001* Dyspnea (Borg, 0-10) 0 4.72±1.81 2.56±1.37 0.83±0.89 51.379 <0.001* General fatigue (Borg, 0-10) 0.19±0.39 5.17±1.72 2.94±1.58 1.17±0.97 48.850 <0.001* Leg fatigue (Borg, 0-10) 0.19±0.35 4.06±1.73 2.08±1.48 0.97±1.04 51.355 <0.001* *p<0.05, χ2
: Friedman test, HR: heart rate, SpO2: oxygen saturation, SBP: systolic blood pressure, DBP: diastolic blood pressure
After presenting the binary comparisons of parameters, we found that all comparisons (Start, End, Recovery 1, and Recovery 5) of heart rate, systolic blood pressure, dyspnea, general fatigue, and leg fatigue were significant (p<0.05) while only Start versus Recovery 1 and Start versus Recovery 5 comparisons of oxygen saturation and diastolic blood pressure were statistically significant (p<0.05, Table 4.3.4).
Table 4.3.4. Results of binary comparisons of the parameters during the second incremental shuttle walk test
Variables
2nd Incremental shuttle walk test
Start vs End End vs Recovery 1 End vs Recovery 5 z p z p z p HR (bpm) -3.727 <0.001* -3.730 <0.001* -3.726 <0.001* SpO2 (%) -2.283 0.022* -3.295 0.001* -2.933 0.003* SBP (mmHg) -3.755 <0.001* -3.866 <0.001* -3.780 <0.001* DBP (mmHg) -2.944 0.003* -3.025 0.002* -3.567 <0.001* Dyspnea (Borg, 0-10) -3.736 <0.001* -3.780 <0.001* -3.732 <0.001* General fatigue (Borg, 0-10) -3.743 <0.001* -3.677 <0.001* -3.084 <0.001* Leg fatigue (Borg, 0-10) -3.744 <0.001* -3.772 <0.001* -3.742 <0.001* *
p<0.05, z: Wilcoxon signed rank test, HR: heart rate, SpO2: oxygen saturation, SBP: systolic blood pressure, DBP: diastolic blood pressure
When the distances covered during two ISWTs were compared, a significant difference was not found (p>0.05, Table 4.3.5).
Table 4.3.5. Comparison of the distances between the two incremental shuttle walk tests Variables 1st ISWT Mean±SD 2nd ISWT Mean±SD z p Distance (m) 1124.44±214.87 1160.00±211.27 -1.080 0.280
4.4 Comparison of The Characteristics of The Bicycle Test and The Incremental Shuttle Walk Test
In binary comparisons of HRmax, percentage of HRmax, and VO2max there was a significant change in maximal heart rate, VO2max and percentage of HRmax (p<0.05, Table 4.4.1). Accordingly, subjects reached significantly higher HRmax and percentage of HRmax in ISWT than those of the bicycle test (p<0.05, Table 4.4.1). Similarly, VO2max in the ISWT was significantly higher as compared with the bicycle test (p<0.05, Table 4.4.1). There was not a significant change in fatigue (p>0.05, Table 4.4.1).
Table 4.4.1. Comparison of maximal heart rate, percentage of maximal heart rate, fatigue and maximal oxygen consumption between the shuttle walk test and the bicycle test
Variables Bicycle test
Mean±SD ISWT Mean±SD z p HRmax (bpm) 171.89±17.70 185.61±11.14 -3.681 <0.001* % of HR max 87.56±8.56 94.39±5.40 -3.660 <0.001* Fatigue (Borg, 0-10) 5.81±2.02 5.39±1.79 -1.256 0.209 VO2max (ml.kg-1.min-1) 28.15±3.93 33.82±5.11 -3.680 <0.001*
*p<0.05, z: Wilcoxon signed rank test, ISWT: Incremental shuttle walk test, HR max: Maximal heart rate VO2max: Maximal oxygen consumption
4.5. Comparison of Heart Rate, General Fatigue, and Oxygen Consumption during the Levels of Talk Testing Between The Bicycle and The Incremental Shuttle Walk Tests
In the comparison of heart rate during the last positive, equivocal, and the first negative levels between ISWT and bicycle test, there was a significant change between the two tests in the last positive and equivocal levels (p<0.05, Table 4.5.1). The increase in heart rate during the last positive and equivocal
levels during the ISWT were significantly higher than those of the bicycle test (p<0.05, Table 4.5.1). However, there were not significant changes in the first negative level (p>0.05, Table 4.5.1).
Table 4.5.1. Comparison of the heart rate responses in the last positive, equivocal, and the first negative levels between the incremental shuttle walk test and the bicycle test
Heart rate (bpm)
ISWT Bicycle test
z p Mean±SD Median (IQR) Mean±SD Median (IQR)
Last positive level 130.00±14.30 133 (114.8-137.8) 121.33±17.88 117 (107-136.8) -2.113 0.035* Equivocal level 150.33±15.51 150 (144-156.3) 141.06±17.86 137 (129.5-157) -2.135 0.033* First negative level 163.67±15.33 161 (157-180) 159.11±19.61 161 (143.8-174) -0.900 0.368 *
p<0.05, z: Wilcoxon signed rank test, SD: standard deviation, IQR: interquartile range. ISWT: incremental shuttle walk test
The comparison of the percentage of HRmax during the last positive, equivocal, and the first negative levels between the ISWT and the bicycle test showed that there was a significant change between the two tests in the last positive and equivocal level (p<0.05, Table 4.5.2). The percentage of HRmax during the last positive and equivocal levels during the ISWT were significantly higher than those of the bicycle test (p<0.05, Table 4.5.1). There was no significant difference in percentage of HRmax during the first negative level between the two tests (p=0.365, Table 4.5.2).
In the comparison of fatigue level during the last positive, equivocal, and the first negative levels between ISWT and bicycle test, a significant change was not found between the two tests in the last positive and equivocal levels (p>0.05, respectively, Table 4.5.3). However, fatigue level in the bicycle test was
significantly higher in the first negative when compared with the ISWT (p<0.05, Table 4.5.3).
Table 4.5.2. Comparison of the percentage of maximal heart rate responses in the last positive, equivocal, and the first negative levels
Maximal heart rate (%)
ISWT Bicycle test
z p Mean±SD Median (IQR) Mean±SD Median (IQR) Last positive level 66.22±7.60 67 (58.5-73) 61.83±9.04 59.50 (55.8-71) -2.013 0.044* Equivocal level 76.67±8.27 77 (72.8-81.3) 71.89±9.10 69.50 (66-81.3) -2.097 0.036* First negative level 83.28±8.13 82 (79-91) 81.06±9.89 80.50 (75.3-90.3) -0.906 0.365 *
p<0.05, z: Wilcoxon signed rank test, SD: standard deviation, IQR: interquartile range. ISWT: incremental shuttle walk test
Table 4.5.3. Comparison of fatigue level in the last positive, equivocal, and the first negative levels between the incremental shuttle walk test and bicycle test
Fatigue
ISWT Bicycle test
z p Mean±SD Median (IQR) Mean±SD Median (IQR)
Last positive level 1.28±0.93 1 (0.5-2) 1.39±1.13 1 (0.5-2) -0.358 0.720
Equivocal level 2.22±1.17 2 (1.8-3) 2.83±1.25 3 (2-3.3) -1.706 0.088 First negative level 3±1.28 3 (2-4) 4.39±1.86 4.5 (3-6) -2.890 0.004*
*
p<0.05, z: Wilcoxon signed rank test, SD: standard deviation, IQR: interquartile range. ISWT: incremental shuttle walk test
In the comparison of VO2max during last positive, equivocal, and first negative levels between the ISWT and the bicycle tests, there was not a significant change between the two tests in the last positive and equivocal levels
(p>0.05, Table 4.5.4) while there was a significant change between the two tests in the first negative level (p<0.05, Table 4.5.4).
Table 4.5.4. Comparison of maximal oxygen consumption in the last positive, Equivocal, and the first negative levels between the incremental shuttle walk test and the bicycle test
VO2max (ml.kg.-1min.-1)
ISWT Bicycle test
z p
Mean±SD Median (IQR) Mean±SD Median (IQR)
Last positive level 16.64±2.79 17.19 (14.7-17.2) 16.02±2.71 15.79 (14.43-17.81) -0.631 0.528 Equivocal level 20.62±3.21 19.94 (19.3-22.9) 20.96±2.68 21.87 (18.38-22.60) -0.719 0.472 First negative level 23.01±2.87 22.94 (22.3-24.9) 25.10±2.80 25.75 (22.26-27.19) -2.461 0.014* *
p<0.05, z: Wilcoxon signed rank test, SD: standard deviation, IQR: interquartile range. ISWT: incremental shuttle walk test. VO2max: maximal oxygen consumption
4.6. Assessment of Correlations Of Maximal Heart Rate, Percentage of Maximal Heart Rate, Fatigue, Maximal Oxygen Consumption, and Peak Work Rate Between The Incremental Shuttle Walk Test and Bicycle Test.
The absolute HRmax and the percentage of HRmax reached during bicycle test were significantly associated with absolute HRmax and the percentage of HRmax reached during the ISWT (p<0.05, Table 4.6.1). There was a significant relationship between fatigue measured during the bicycle test and the ISWT (p<0.05, Table 4.6.1). The VO2max during bicycle test was significantly correlated with VO2max, HRmax, and ISWT distance (p<0.05, Table 4.6.1). Peak power in the bicycle test was significantly related with HRmax, VO2max, and the ISWT distance (p<0.05, Table 4.6.1).
Table 4.6.1. Correlations of maximal heart rate, percentage of maximal heart rate, fatigue, and maximal oxygen consumption between the incremental shuttle walk test and the bicycle test
ISWT
Bicycle test HRmax
(bpm)
%HRmax Fatigue (Borg, 0-10) VO2max (ml.kg -1.min-1) Peak power (watt) r p r p r p r p p p HRmax 0.804 <0.001* 0.769 <0.001* 0.418 0.084 0.563 0.015* 0.596 0.009* %HRmax 0.674 0.002* 0.734 0.001* 0.418 0.084 0.447 0.063 0.444 0.065 Fatigue 0.199 0.428 0.151 0.549 0.605 0.008* 0.305 0.218 0.044 0.863 VO2max 0.388 0.111 0.368 0.133 0.451 0.060 0.582 0.011* 0.612 0.007* Distance 0.388 0.111 0.368 0.133 0.451 0.060 0.582 0.011* 0.612 0.003* *
p<0.05, r: spearman test. HRmax: maximal heart rate VO2max: Maximal oxygen consumption, ISWT: incremental shuttle walking test
5. DISCUSSION
Evaluation of the consistency of the talk test applied during a standardized exercise test and a field exercise test in healthy subjects was the aim of this study. The findings indicated that the talk test applied during a standardized exercise test using bicycle ergometer and a field exercise test was consistent during the first negative level of the talk test for heart rate and percentage of HRmax, nevertheless, this stage was not used to prescribe the exercise intensity. For fatigue perception and VO2max, the talk test was consistent in the last positive and equivocal stages. These stages could be used to prescribe the intensity of exercise for bicycle or walking with respect to the chosen criteria (heart rate, fatigue or VO2max) would be used.
Most of studies in the literature studying the talk test were performed in healthy subjects (7, 8, 58, 87), recreational or competitive athletes (5, 57, 88, 89), and patients with cardiac problems (47, 51, 90, 91). These studies used various modalities for the tests like treadmill (8, 58, 92) or bicycle (5, 88, 93). In one study, physiological responses of treadmill and bicycle were compared (7). However, none of these studies used a field test such as a walking test, and none compared the physiologic responses between a laboratory test and a field test. Therefore, we used bicycle test and the ISWT in healthy subjects, and we investigated physiologic responses and the consistency of the talk test performed during these two different tests. We estimated the oxygen consumption by using specific formula without any apparatus of gas exchange. Therefore, it was better to apply a bicycle exercise test because of the changeability of physiologic measurements during treadmill test, particularly heart rate and oxygen consumption whether the subjects hold onto the treadmill railing (94). Cycle ergometers enable a more accurate quantifying of external work rate with less movement artifact on measurements during a standardized exercise test (95).