New Trends and Issues
Proceedings on Advances in
Pure and Applied Sciences
Issue 8, (2017) 129-134ISSN 2547-880X www.propaas.eu
Selected Paper of 4th World Conference on Health Sciences (H-SCI 2017), 28–30 April 2017 Grand Park Lara Convention Center, Lara, Antalya, Turkey.
Comparison of Diet Quality for Pregnant and Non-pregnant Women
Hande Nur Onur a *, Istanbul Gelisim University, Istanbul 34315, Turkey.Eda Koksal b, Gazi University, Ankara 06500, Turkey.
Suggested Citation:
Onur, H. N. & Koksal, E. (2017). Comparison of diet quality for pregnant and non-pregnant women. New Trends
and Issues Proceedings on Advances in Pure and Applied Sciences.[Online]. 08, pp 129-134. Available from: www.propaas.eu
Selection and peer review under responsibility of Prof. Dr. Afsun Ezel Esatoglu, Faculty of Health Sciences, Ankara University, Turkey.
©2017 SciencePark Research, Organization & Counseling. All rights reserved.
Abstract
A woman’s nutritional status prior to and during pregnancy affects foetal development, the course of the pregnancy and her long-term health. This study aims to determine the diets of pregnant and non-pregnant women using the Healthy Eating Index 2010 (HEI-2010). The study was performed on 43 non-pregnant and 25 pregnant volunteers, who had no chronic diseases, took no diet treatments and had a mean age of 23.0 ± 30.1 years. Their general features were determined through a questionnaire, dietary intake was measured by 24-hour dietary recall method, diet quality was assessed by HEI-2010 and energy and nutrient intake was calculated by the Nutrition Information System programme. The diet quality of 60.3% of the participants was found to be poor, while 39.7% was average. Although pregnant women had a slightly higher HEI-2010 score, the diet quality was low for all; hence, dieticians should provide nutrition education for all child-bearing aged women. Keywords: Diet quality, healthy eating index, pregnancy nutrition.
* ADDRESS FOR CORRESPONDENCE: Hande Nur Onur, Istanbul Gelisim University, Istanbul 34315 , Turkey.
1. Introduction
Women have different biological and psychological stages specific to their gender in all life cycles like menarche, pregnancy, birth and being a mother. Pregnancy is a natural, physiological and anabolic process. The right to benefit from appropriate health services to ensure that the woman goes through the pregnancy period and childbirth in a safe condition is included in the reproductive rights set [1].
Pregnancy is the one of the important periods in the life of a woman. Before and during pregnancy, a woman’s nutritional status affects foetal growth, the development and the course of her pregnancy as well as her long-term health status [2]. The reason for the physiological changes in the mother is to protect her during pregnancy and childbirth, and ensure foetal growth and development [3]. During the weeks following pregnancy, the placenta works as a new endocrinal organ, helping the metabolism of nutrients, anatomical and physiological changes of the mother, foetal growth, providing maternal homeostasis and preparing the mother for lactation [4]. These changes, which occur during pregnancy, return to normal after 6–8 weeks of birth [5]. Failure to meet the increased energy and protein requirements with these metabolic changes leads to maternal weight loss, anaemia, tooth decay and osteomalacia [2].
Nutrition is an action for protection and improvement of human health, promoting life quality in terms of taking nutrients at the proper time and in adequate amounts. In the studies carried out, the minimum amount of nutrients that a person has to take in order to keep as healthy as it is needed throughout his lifetime has been specified as close to 50. It has been demonstrated that if either of these items is deficient in the intake or that the health is impaired, growth and development are prevented [6].
The complexity of nutrition has led to the emergence of many different methods for assessing nutrient consumption [7]. When considering the role of the diet in disease development, researchers have developed new indicators to measure the dietary quality [8]. Nutrients, food groups and other components are handled independently, while nutrition is assessed in the studies. This is because meals consist of a combination of food and nutrients; food and nutrients are not consumed in an isolated manner. Thus, studies have shown that decreased dietary quality, intake of energy, fat, saturated fat and sugar; insufficient fruit, vegetable and fibre consumption, but they do not reflect the total quality of the diet. As a result, nutritional pattern analysis has emerged as an alternative approach when evaluating dietary quality [7].
Previously, nutrition guidelines focused only on the amount of food that needed to be taken to meet the nutritional needs. Towards the end of the 1970s, it was reported that dietary suggestions should be changed to prevent chronic diseases. There has been a need for a food guide to make food intake recommendations for the ‘total diet’ rather than the ‘basic diet’, including the qualification and improvement goals. The first US Department of Agriculture (USDA) nutrition models to describe the total diet were published in nutrition guidelines developed in the mid-1980s. These guidelines include Food Wheel and A Pattern for Daily Food Choices and in 1992, the Food Guide Pyramid was published as a basis for diet quality [9].
Healthy Eating Index (HEI) is a guideline which was published in 1995 in the USA to build a basis for nutrition policy and is a measure of the quality of the diet in terms of compliance with the American Dietary Guidelines, the basis for all federal nutrition guidelines [10]. The USDA has developed an index called the HEI to measure how well the American diet adapts to healthy nutrition. In the first index published by USDA in 1995, the basic recommendation of the food pyramid was total fat, saturated fat, cholesterol and sodium [11].
another example of dietary patterns established in accordance with the Dietary Guidelines. In contrast to typical food consumption patterns in the USA, both the USDA diet patterns and the DASH diet plan contain more vegetables, fruits, whole grains and low-fat dairy products, and less refined grains, saturated fatty acids and added sugars. The HEI-2010 is made up of 12 components, nine adequacy components as whole fruit, total fruit, total vegetable, greens and beans, whole grain, dairy, total protein foods, seafood and plant proteins and three moderation components as fatty acids, refined grains and empty calories [10].
Healthy dietary choices during pregnancy appear to be affected by pre-conception and gestational weight status, as well as by place of residence. Education, income, gravidity and age did not appear to contribute to the HEI. In one study, women who were either underweight or of normal body weight before conception showed a higher gestational HEI compared with overweight women. When gestational weight status was accounted for, the greatest HEI scores were achieved by underweight and normal body weight pregnant women [12].
The aim of this study was to determine the differences between pregnant and non-pregnant women’s diet quality by using HEI-2010.
2. Materials and Methods
This study was carried out on 68 women: 43 (63.2%) non-pregnant and 25 (36.8%) pregnant women volunteers aged between 18 and 30, having no chronic disease, taking no diet treatment and who referred to the family health centre in Istanbul. The general features of the women were determined through a questionnaire that included the age, working status, number of pregnancies, duration of pregnancy, weight before and after pregnancy, first pregnancy age, chronic disease, usage of supplements, nutritional status, appetite status, water consumption, activity status and duration. Dietary intake was measured by a 24-hr dietary recall method and the answers were taken by individual interviews.
Diet quality was assessed by HEI-2010. Energy and nutrient intake was calculated by the Nutrition Information System (BeBiS) programme. Mixed foods were broken into their component ingredients and then assigned to the appropriate HEI-2010 category. HEI-2010 score was calculated as 12 components which are: total fruit (5 points); whole fruit (5 points); total vegetables (5 points); greens and beans (5 points); whole grains (10 points); dairy (10 points); total protein foods (5 points); seafood and plant proteins (5 points); fatty acids (polyunsaturated fatty acid monounsaturated fatty acid to saturated fatty acid ratio) (10 points); refined grains (10 points); sodium (10 points); and empty calories from solid fats, alcoholic beverages and added sugars (20 points). The overall scoring range was from 0 to 100. 0–50 points show that the diet quality is poor, 51–80 is the average, while 81–100 is good [10].
3. Findings and Results
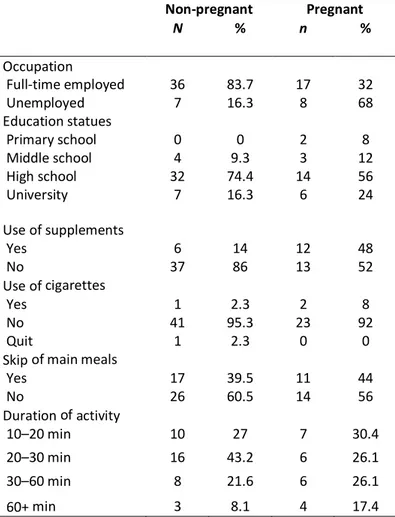
This study was carried out on 68 pregnant and non-pregnant women: 25 (36.8%) of the participants were pregnant and 7 (28%) were in the first trimester, 11 (44%) in the second trimester and 7 (28%) in the third trimester. The non-pregnant participants were 43 (63.2%). Most of the participants were unemployed (78.6%), had finished high school (67.6%) and lived in a nuclear family (89.7%). The demographic characteristics and life behaviours of the participant details are shown in Table 1.
Table 1. Distribution of demographic characteristics and life behaviours of participants Non-pregnant Pregnant N % n % Occupation Full-time employed 36 83.7 17 32 Unemployed 7 16.3 8 68 Education statues Primary school 0 0 2 8 Middle school 4 9.3 3 12 High school 32 74.4 14 56 University 7 16.3 6 24 Use of supplements Yes 6 14 12 48 No 37 86 13 52 Use of cigarettes Yes 1 2.3 2 8 No 41 95.3 23 92 Quit 1 2.3 0 0
Skip of main meals
Yes 17 39.5 11 44 No 26 60.5 14 56 Duration of activity 10–20 min 10 27 7 30.4 20–30 min 16 43.2 6 26.1 30–60 min 8 21.6 6 26.1 60+ min 3 8.1 4 17.4
The average age for non-pregnant is 22.16 ± 2.56; for pregnant it is 25.28 ± 3.18; for all it is 23.31 ± 3.01. First pregnancy age average is 23.0 ± 3.03; only two women’s first pregnancy was under the age of 18. The maximum number of pregnancies for all participants is 3. Usage of supplement is 26% (18). The most used supplement is iron supplement. Herbal support usage is 13.2% (9) and the most used herbal support is herbal tea.
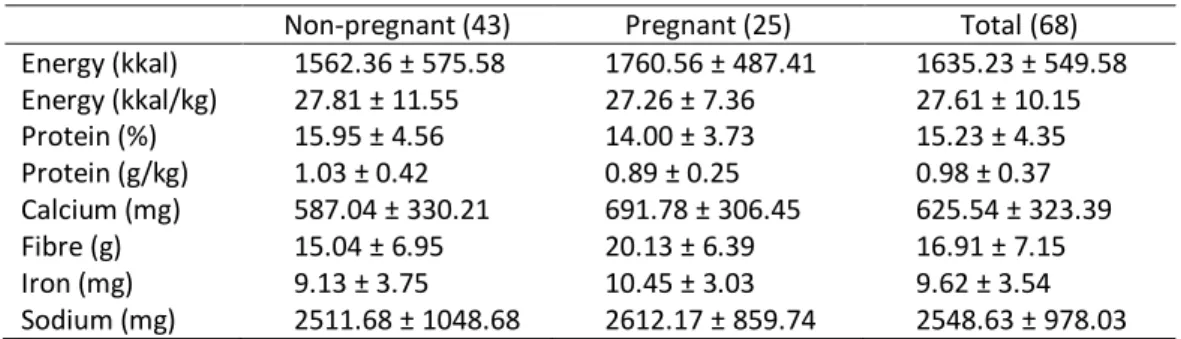
Dietary intake is examined and the results are shown in Table 2. The table shows that pregnant women take less intake of protein in per cents and g/kg than non-pregnant women, but it is still at an acceptable level. Pregnant women have a higher energy intake, but when energy intake per kilogram is examined it was found that it is higher in non-pregnant women. Calcium intake was inadequate in both the groups.
Table 2. Dietary intake examination for non-pregnant and pregnant women Non-pregnant (43) Pregnant (25) Total (68) Energy (kkal) 1562.36 ± 575.58 1760.56 ± 487.41 1635.23 ± 549.58 Energy (kkal/kg) 27.81 ± 11.55 27.26 ± 7.36 27.61 ± 10.15 Protein (%) 15.95 ± 4.56 14.00 ± 3.73 15.23 ± 4.35 Protein (g/kg) 1.03 ± 0.42 0.89 ± 0.25 0.98 ± 0.37 Calcium (mg) 587.04 ± 330.21 691.78 ± 306.45 625.54 ± 323.39 Fibre (g) 15.04 ± 6.95 20.13 ± 6.39 16.91 ± 7.15 Iron (mg) 9.13 ± 3.75 10.45 ± 3.03 9.62 ± 3.54 Sodium (mg) 2511.68 ± 1048.68 2612.17 ± 859.74 2548.63 ± 978.03
According to HEI-2010, diet quality of 60.3% of the participants was poor and 39.7% was average. None could be classified as having a ‘good diet’. The differences between the groups were not statistically significant (p = 0.581) (Table 3). The mean HEI-2010 score for all was 45.4 ± 14.96; for non-pregnant women it was 44.1 ± 15.70 and for non-pregnant women it was 47.8 ± 13.67.
Table 3. Diet quality calculated by HEI-2010
Non-pregnant (43) Pregnant (25) Total (68) p = 0.581
N % n % n %
Poor 27 39.7 14 20.6 41 60.3
Average 16 23.52 11 16.18 27 39.7
Good 0 0 0 0 0 0
Mean ± SD 44.1 ± 15.70 47.8 ± 13.68 45.4 ± 14.96
Examination of the HEI-2010 scores shows that the pregnant women’ scores are slightly higher than non-pregnant participants, except for the total protein, seafood and plant protein and empty calories. The only difference between the groups for total vegetable is statistically significant; the details are given in Table 4.
Table 4. Mean values of components HEI-2010 score
Non-pregnant (43) Pregnant (25) Total (68) *p < 0.05
Mean Range Mean Range Mean Range
Total fruit 1.91 ± 1.81 0–5 2.10 ± 1.87 0–5 1.98 ± 1.81 0–5 0.857 Whole fruit 2.43 ± 2.22 0–5 2.99 ± 2.21 0–5 2.64 ± 2.22 0–5 0.580 Total vegetable 1.74 ± 1.45 0–5 2.65 ± 1.39 0.17–5 2.07 ± 1.48 0–5 0.008* Greens and beans 2.41 ± 1.96 0–5 2.65 ± 1.92 0–5 2.49 ± 1.93 0–5 0.573 Whole grain 2.98 ± 4.06 0–10 3.65 ± 4.44 0–10 3.22 ± 4.18 0–10 0.562 Dairy 4.02 ± 3.06 0.35–10 4.65 ± 3.14 0–10 4.25 ± 3.08 0–10 0.390 Total protein 2.56 ± 0.70 1.08–4.96 2.29 ± 0.62 1.1–3.82 2.46 ± 0.69 1.08–4.96 0.094 Seafood and plant proteins 3.12 ± 1.06 0.99–5 3.11 ± 0.98 0.99–5 3.12 ± 1.02 0.99–5 0.919 Fatty acids 0 ± 0 0–0 0.12 ± 0.61 0–3.09 0.04 ± 0.37 0–3.09 0.190 Refined grains 7.28 ± 3.34 0–10 7.94 ± 2.97 0–10 7.52 ± 3.20 0–10 0.408 Sodium 4.75 ± 3.92 0–10 5.49 ± 3.64 0–10 5.03 ± 3.81 0–10 0.416 Empty calories 10.79 ± 9.22 0–20 10.09 ± 9.33 0–20 10.53 ± 9.21 0–20 0.979 Total score 44.0 ± 15.65 18.56–76.02 47.77 ± 13.67 26.11–68.09 45.39 ± 14.96 18.56–76.02 0.288
4. Conclusions and Recommendations
In this study, we found that pregnant women have a higher HEI-2010 score than non-pregnant women. This may be due to the interest of pregnant women for a healthier diet.
When components of HEI-2010 were examined, all the scores were higher for pregnant women, except the total protein foods, seafood and plant protein and empty calories score. The difference between the groups in the total vegetable was statistically significant (p = 0.008).
The place in which this study was carried out had a low income, as a result, the consumption of protein-rich foods was low. At the beginning stages of pregnancy, sensitivity for odours is high, hence seafood and vegetables that have sulphur may be consumed less. Because of the increased energy needs, pregnant women tend to consume more desserts, sugary food and pastries.
For all women the diet quality was low and dieticians should provide nutrition education for all child-bearing aged women.
References
[1] M. T. Isık, Gebelik surecinde tıbbi aydınlatma. Adana, Turkey: Institute of Health Science, Cukurova University, 2010.
[2] G. Koksal and H. Gokmen, Cocuk hastalıklarında beslenme tedavisi. Ankara, Turkey: Hatiboglu Yayınları, 2000.
[3] M. E. Bakanlıgı and S. Hizmetleri, Gebelik ve fetus fizyolojisi. Ankara, Turkey, 2016.
[4] J. C. King, “Physiology of pregnancy and nutrient metabolism,” Am. J. Clin. Nutr., vol. 71, pp. 1218S–1225S, 2000.
[5] S. Nalbant, “Gebelikte gelisen fizyolojik degisiklikler,” Onuncu Ulusal İc Hastalıklar Kongresi, 2008.
[6] M. A. Sahin, Yetiskin bireylerde diyet kalitesi ile yasam kalitesi arasındaki iliskinin degerlendirilmesi. Ankara, Turkey: Institute of Health Science, Hacettepe University, 2014.
[7] H. F. Ozmen, Adolesan bireylerde diyet kalitesinin saglıklı yeme indeksi ile degerlendirmesi, Istanbul, Turkey: Institute of Health Science, Istanbul Medipol University, 2016.
[8] D. de Assumpcao et al., “Diet quality among adolescents: a population-based study in Campinas, Brazil,”
Rev. Bras. Epidemiol., vol. 15, issue 3, pp. 605–616, 2012.
[9] USDA, “Appendix E-3.1. Adequacy of USDA food patterns: food pattern modelling analysis,” 2010.
[10] P. M. Guenther et al., “Update of the healthy eating index: HEI 2010,” J. Acad. Nutr. Diet, vol. 113, pp. 569– 580, 2013.
[11] USDA Center For Nutrition Policy and Promotion, “The healthy eating index,” 1995.
[12] M. Tsigga et al., “Healthy eating index during pregnancy according to pre-gravid and gravid weight status,”