36 IEEE SIGNAL PROCESSING LETTERS, VOL. 5, NO. 2, FEBRUARY 1998
3-D Motion Estimation of Rigid Objects for
Video Coding Applications Using an Improved
Iterative Version of the E-Matrix Method
A. Aydın Alatan and Levent Onural,
Senior Member, IEEEAbstract— As an alternative to current two-dimensional (2-D) motion models, a robust three-dimensional (3-D) motion esti-mation method is proposed to be utilized in object-based video coding applications. Since the popular E-matrix method is well known for its susceptibility to input errors, a performance in-dicator, which tests the validity of the estimated 3-D motion parameters both explicitly and implicitly, is defined. This indica-tor is utilized within the RANSAC method to obtain a robust set of 2-D motion correspondences which leads to better 3-D motion parameters for each object. The experimental results support the superiority of the proposed method over direct application of the E-matrix method.
Index Terms—E-matrix method, object-based motion analysis, object-based video coding, RANSAC, 3-D motion and structure estimation.
I. INTRODUCTION
T
HREE-DIMENSIONAL (3-D) motion models are alter-natives to their two-dimensional (2-D) counterparts for modeling motions of the objects in the scene between frames. However, most of the 3-D motion estimation algorithms suffer from computational complexity and input errors [1]–[3]. The linear E-matrix method [3] is a fast but noise-susceptible algorithm. In order to improve error immunity, some nonlinear versions are also proposed [1], [2], [4], even though there is a significant increase in computation time.Based on the E-matrix method, we propose a novel algo-rithm that estimates the 3-D motion of the rigid objects in the scene in a robust manner. The aim is to utilize this algorithm in object-based video encoders to estimate and describe the object motions between frames.
II. DESCRIPTION OF THEPROPOSED ALGORITHM
In order to define objects, a segmentation step is necessary prior to 3-D motion estimation. Usually, the segmentation is based on 2-D dense motion vectors. This dense set of 2-D motion vectors for each object usually contains correct 2-D correspondences as well as some outliers, i.e., incorrect matches. Moreover, some irrelevant motion vectors of the neighboring objects might also be included in the object motion vector set due to incorrect segmentation. Hence, rather
Manuscript received December 17, 1996. This work was supported by Research and Development Council of Turkey (T ¨UB˙ITAK) under the COST 211 Project. The associate editor coordinating the review of this manuscript and approving it for publication was Prof. R. Ansari.
The authors are with the Department of Electrical and Electronics Engineering, Bilkent University, TR-06533 Ankara, Turkey (e-mail: [email protected]).
Publisher Item Identifier S 1070-9908(98)01635-6.
than finding robust 2-D correspondences, which are needed for the E-matrix computation, between frames using another algorithm, a robust selection mechanism over the existing 2-D dense motion vectors is proposed. The proposed selection mechanism is iterative and a performance indicator is tried to be maximized by the iterations.
A. The Performance Indicator
Since there are a number of error sources that affect the performance of the E-matrix method, a few parameters are defined to indicate whether the estimated 3-D motion parameters are valid or not. The parameters are defined based on the following reasonings: First of all, the error between the original (input) and projected 2-D motion vectors must approach to zero for a valid 3-D motion estimate set. Second, assuming that the E-matrix method is applied, the eigenvalues of must be equal to [4]. In such a case, the matrix implicitly contain a valid rotation (orthonormal of first kind) matrix and a translation vector. Third, since all the objects are assumed to move in front of the image plane, they should all have positive depths [4]. Taking the above ideas into account, five parameters are defined below to test the performance of the 3-D motion estimates.
1) 2 where
2 is the horizontal component for the 2-D projection
of the estimated 3-D motion and is the horizontal component for the input 2-D motion estimates for the Object
2) 2 where
2 is the vertical component for the 2-D projection
of the estimated 3-D motion and is the vertical component for the input 2-D motion estimates for the Object
3) where is the smallest eigenvalue (usually have zero value) of matrix.
4) where and
are the nonzero eigenvalues of matrix.
5) where and are the number of negative depth values for tested points at time and respectively.
Ideally, all these parameters should be equal to zero for the correct rotation and translation estimates. Consequently, the sum of these five test parameters, which can be denoted as should also approach to zero for valid motion parameters. A new parameter, is defined to be
ALATAN AND ONURAL: 3-D MOTION ESTIMATION OF RIGID OBJECTS FOR VIDEO CODING APPLICATIONS 37
and it should be equal to one for the correct 3-D motion parameters. is chosen as the performance indicator; according to the value of the estimation results can be “trusted” or not.
B. Random Sample Consensus
Random sample consensus (RANSAC) is a paradigm for fitting a model to experimental data [5]. It is capable of inter-preting and smoothing data containing a significant percentage of gross errors. In RANSAC, assuming that a given procedure requires at least data points to determine the model pa-rameters and there are points in the initial experimental data set a random subset of the data points with points is selected to construct a model. For the initial -point data set, the percentage of the -points, which fits to the constructed model within an error tolerance, is checked using a threshold. If the percentage is less than this threshold, then a new random subset is used until the error tolerance is satisfied or the maximum number of iterations is reached.
Application of RANSAC to E-matrix method is straight-forward. The E-matrix method requires at least eight corre-spondences to estimate the E-matrix and there are dense 2-D motion fields for each object. Additionally, the error tolerance can be determined using the test parameters and which test the validity of the model to the data, as it is suggested by the original RANSAC approach [5]. However, RANSAC can further be improved by using the parameter instead. While the test parameters check the fit of the model to all the input data, is necessary to understand whether the randomly selected subset is a “good” choice or not. Data due to incorrect segmentation can be identified using
C. The Algorithm
The overall algorithm can be summarized as below. For each moving object, do the following.
1) Select a random subset from 2-D motion vectors.
2) Find E-matrix, 3-D motion and corresponding P.
3) If (P Threshold for P) exit with current 3-D motion else,
If (P maximum P so far) save P and 3-D motion.
If maximum # of iterations has reached exit with saved 3-D motion. goto step 1.
Hence, using the algorithm above, a rotation matrix and a translation vector are found for each object in a robust manner.
III. EXPERIMENTAL RESULTS A. The Effect of Different Error Sources to the Conventional E-Matrix Method
The simulations on 3-D motion estimation are conducted in three phases. In the first phase, artificial data is used to test performance of the conventional E-matrix method [3]
TABLE I
SIMULATIONS ONE-MATRIXMETHODUSINGARTIFICIALDATA
TABLE II
SIMULATIONS ON3-D MOTIONPARAMETERESTIMATIONUSING THECONVENTIONALE-MATRIXMETHODUSING130TH AND
135THFRAMES OFMOTHER ANDDAUGHTERSEQUENCE
by examining the effect of the image resolution (Step 1.a resolution: 176 144; Step 1.b resolution: 1760 1440), matching errors (Step 2: adding Gaussian noise on top of motion vectors so that they are distorted 10 percent on the average), focal length error (Step 3: distorting the focal length with 10 percent) and combined effect of these three error sources (Step 4). Such an experiment gives an idea about the upper limit of the performance of this algorithm. The results are given in Table I.
The results of Step 1 show that there is some amount of error due to quantization noise, as expected [2]. The utilization of frames with high spatial resolutions might improve the performance of the conventional E-matrix algorithm. Unfor-tunately, in very low bit rate video coding applications it may not be possible to use frames with high resolutions. On the other hand, the E-matrix method is very susceptible to correspondence errors according to the test parameters of Step 2. The focal length should also be selected or estimated carefully, since the distortion on focal length might also degrade the results considerably. As expected, the combined effect of these three error sources is much more severe and such a situation is also highly expected in natural sequences.
B. The Performance of the Conventional E-Matrix Method with Real Data
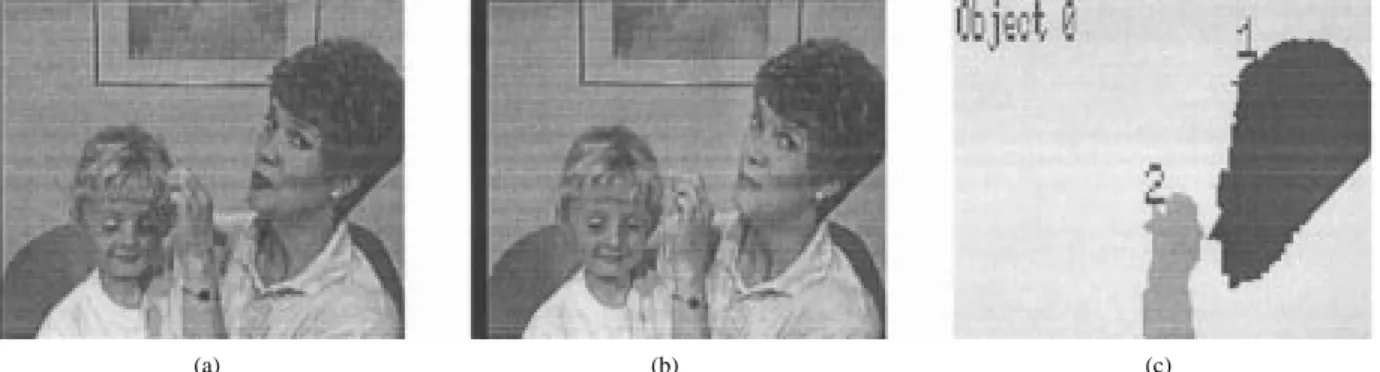
In the second phase of the experiments, the conventional E-matrix method [3] is applied to real data. Some QCIF frames (176 144) from the “mother and daughter” sequence are used. It is assumed that the focal length of the camera is equal to 250 pixels (This approximately corresponds to 50 mm focal length of a 35 mm camera). The optical -axis) axis is assumed to pass through the center of these images and pixels are assumed as squares. The object segmentation and 2-D motion are estimated simultaneously using a Markov random field-based (MRF-based) method [6] and given as inputs to the 3-D motion estimation step. For each object, all the 2-D motion vectors are used to estimate the E-matrix in the least squares sense. The input data for the second phase is shown in Fig. 1. Table II shows that the performance indicator, is quite low, which is an indication of a poor performance. The
projec-38 IEEE SIGNAL PROCESSING LETTERS, VOL. 5, NO. 2, FEBRUARY 1998
(a) (b) (c)
Fig. 1. Original, (a) 130th, and (b) 135th frames of the “mother and daughter” sequence. (c) Input segmentation.
(a) (b) (c)
Fig. 2. Needlegram representations for (a) the input 2-D motion. Projection of the estimated 3-D motion and structure using (b) conventional E-matrix and (c) the proposed method.
tion of estimated 3-D motion and structure parameters, which is observed in Fig. 2(b), supports that the low value of
C. Performance of the Proposed Method with Real Data
In the third phase of the experiments, the inputs, which are shown in Fig. 1, are utilized again. The performance of the proposed algorithm given in Section II-C is tested. The maximum number of iterations is chosen as whereas the threshold for which determines the acceptability of the obtained motion parameters, is selected as 0.5. The test parameters are tabulated in Table III.
There is a significant decrease with respect to the corre-sponding parameters in Table II for each object. The projection of the 3-D motion, which is estimated using the proposed scheme, is shown in Fig. 2(c) and it shows the superiority of the proposed scheme over the conventional method [2].
The computation time of the method based on RANSAC is at most times worse than conventional E-matrix method. However, according to the 2-D motion estimates and the related threshold, this value can be much more smaller, i.e., convergence can be obtained in fewer iterations.
IV. CONCLUSIONS
Compared to the conventional E-matrix method, which uses all the available 2-D motion vectors without any selection, the proposed scheme performs better. Moreover, there is no need to find some feature matches explicitly. As the obtained test parameters and the needlegrams indicate, the estimated 3-D motion parameters are acceptable.
The proposed performance indicator is a good parameter to qualify the performance of the results of the E-matrix method for different inputs. This indicator not only compares the
TABLE III
SIMULATIONS ON3-D MOTIONPARAMETERESTIMATION
USING THEPROPOSEDMETHODUSING130TH AND
135THFRAMES OFMOTHER ANDDAUGHTERSEQUENCE
results with inputs explicitly and it also measures the performance implicitly and
Although the proposed method is superior to the conven-tional E-matrix method, the overall computation time increases while the performance of the 3-D motion estimation step im-proves with this new scheme. Nevertheless, the linear E-matrix method is not a time-consuming algorithm by itself, and the to-tal execution time of the proposed algorithm is still acceptable.
REFERENCES
[1] C. P. Jerian and R. Jain, “Structure from motion—A critical analysis of methods,” IEEE Trans. Syst. Man Cybern., vol. 21, pp. 572–601, May/June 1991.
[2] J. Weng, N. Ahuja, and T. S. Huang, “Optimal motion and structure estimation,” IEEE Trans. Pattern Anal. Machine Intell., vol. 15, pp. 864–884, Sept. 1993.
[3] R. Y. Tsai and T. S. Huang, “Uniqueness and estimation of three-dimensional motion parameters of rigid objects with curved surfaces,” IEEE Trans. Pattern Anal. Machine Intell., vol. PAMI-6, pp. 13–27, Jan. 1984.
[4] J. Philip, “Estimation of three-dimensional motion of rigid objects from noisy observations,” IEEE Trans. Pattern Anal. Machine Intell., vol. 13, pp. 61–66, Jan. 1991.
[5] M. A. Fischler and R. C. Bolles, “Random sample consensus: A paradigm for model fitting,” Commun. ACM, vol. 24, pp. 381–395, June 1981.
[6] A. A. Alatan and L. Onural, “Optimal depth encoding for 3-D object-based video coding,” IEEE Trans. Image Processing, accepted for publication.