R
ecent advances in evaluating and measuring the per-ceived visual quality of three-dimensional (3-D) polygonal models are presented in this article, which analyzes the general process of objective quality assessment metrics and subjective user evaluation methods and presents a taxonomy of existing solutions. Simple geometric error computed directly on the 3-D models does not necessarily reflect the perceived visual quality; therefore, inte-grating perceptual issues for 3-D quality assessment is of great significance. This article discusses existing metrics, including perceptually based ones, computed either on 3-D data or ontwo-dimensional (2-D) projections, and evaluates their perfor-mance for their correlation with existing subjective studies.
INTRODUCTION
Technologies underlying 3-D computer graphics have matured to the point that they are widely used in several mass-market applications, including networked 3-D games, 3-D virtual and immersive worlds, and 3-D visualization applications [1]. Furthermore, emerging products, such as 3-D TVs and 3-D-enabled gaming devices, are opening new avenues of oppor-tunity for an enhanced user experience when interacting with 3-D environments. Thus, 3-D models are emerging as a newly popular form of media [2], usually in the form of 3-D polygonal meshes.
Digital Object Identifier 10.1109/MSP.2011.942466
[
Abdullah Bulbul, Tolga Capin, Guillaume Lavoué, and Marius Preda
]
Date of publication: 1 November 2011
[
Evaluating and discussing
existing metric performance
]
Three-dimensional mesh mod-els are generally composed of a large set of connected vertices and faces required to be rendered and/ or streamed in real time. Using a high number of vertices/faces
enables a more detailed representation of a model and possi-bly increases the visual quality while causing a performance loss because of the increased computations. Therefore, a tradeoff often emerges between the visual quality of the graphical models and processing time, which results in a need to judge the quality of 3-D graphical content. Several operations in 3-D models need quality evaluation. For exam-ple, transmission of 3-D models in network-based applica-tions requires 3-D model compression and streaming, in which a tradeoff must be made between the visual quality and the transmission speed. Several applications require accurate level-of-detail (LOD) simplification of 3-D meshes for fast processing and rendering optimization. Watermarking of 3-D models requires evaluation of quality due to artifacts pro-duced. Indexing and retrieval of 3-D models require metrics for judging the quality of 3-D models that are indexed. Most of these operations cause certain modifications to the 3-D shape (see Figure 1). For example, compression and water-marking schemes may introduce aliasing or even more com-plex artifacts; LOD simplification and denoising result in a kind of smoothing of the input mesh and can also produce unwanted sharp features. To bring 3-D graphics to the mass-es with a high fidelity, different aspects of the quality of the user experience must be understood.
Three-dimensional mesh models, as a form of visual media, potentially benefit from well-established 2-D image and video assessment methods, such as the visible difference predictor (VDP) [3]. Various metrics have thus been proposed that extend the 2-D objective quality assessment techniques to incorporate 3-D graphical mechanisms. Several aspects of 3-D graphics make them a special case, however. Three-dimensional models can be viewed from different viewpoints, thus, depending on the application, dependent or view-independent techniques may be needed. In addition, once the models are created, their appearance does not depend only on the geometry but also on the material properties, the texture, and the lighting [4]. Furthermore, certain operations on the input 3-D model, such as simplification, reduce the number of vertices; and this makes it necessary to handle changes in the input model.
VIEWPOINT-INDEPENDENT QUALITY ASSESSMENT
One category of quality assessment metrics directly works on the 3-D object space. The quality of a processed (simplified, smoothed, watermarked, etc.) model is generally measured in terms of how “similar” it is to a given original mesh. These similarity metrics measure the impact of the operations on the model. Another possible approach to evaluate the 3-D models is to consider 2-D rendered images of them according to
cer-tain viewpoints; however, viewpoint-independent error metrics would be necessary because they provide a unique quality value for a model even if it has been rendered from various viewpoints. Such metrics can be used for comparing compressed models or selecting a level of detail, for example.
GEOMETRIC-DISTANCE-BASED METRICS
The simplest estimation of how similar two meshes are is pro-vided by the root mean square (RMS) difference
RMS1A, B2 5 Å a
n i51
||ai2 bi||2, (1)
where A and B are two meshes with the same connectivity, ai
and bi are the corresponding vertices of A and B, and 7# #7 is the
Euclidean distance between two points. The problem is that this metric is limited to comparing meshes with the same number of vertices and connectivity.
One of the most popular and earliest metrics for compar-ing a pair of models with different connectivities is the Hausdorff distance [5]. This metric calculates the similarity of two point sets by computing sided distances. The one-sided distance D1A, B2 of surface A to surface B is computed as follows:
dist1a, B2 5 minb[B1||a 2 b||2
D1A, B2 5 maxa[A1dist1a, B22. (2)
As this distance is nonsymmetric, the two-sided Hausdorff distance is computed by taking the maximum of D1A, B2 and D1B, A2 (Figure 2)
H1A, B2 5 max1D1A, B2, D1B, A22. (3) The Hausdorff distance has been used to find the geometric error between a pair of 3-D mesh models in the Metro tool by Cignoni et al. [5]. In this approach, the mean distance between a pair of meshes is found by dividing the surface integral of the distance between the two meshes by the area of one of the sur-faces. The computation of this integral on discrete 3-D models
(a) (b) (c)
[FIG1] The bunny model: (a) original, (b) simplified, and (c) smoothed. (Used with permission from the Stanford University Computer Graphics Laboratory.)
SIMPLE GEOMETRIC ERROR COMPUTED
DIRECTLY ON THE 3-D MODEL DOES NOT
NECESSARILY REFLECT THE PERCEIVED
VISUAL QUALITY.
requires a sampling method for fast computation. Aspert et al. [7] also propose a sampling implementation of the Hausdorff distance in the MESH tool.
The Hausdorff distance computes the final distance between two surfaces as the maximum of all pointwise dis-tances. Rather than taking the maximum, extensions have been proposed to provide a better indication of the error across the entire surface. Instead of taking the maximum of the pointwise distances, the average (known as the L1 norm),
the RMS (L2 norm), and combinations have been proposed
[5], [6].
These metrics are well known and widely used; however, even if they can correctly correlate with human judgement in some simple scenarios (see the section “Subjective Evaluation of 3-D Polygonal Models”), they usually fail to reflect the perceived quality because they compute a pure geometric distance between a pair of meshes, ignoring the working principles of the human visual system. Hence, sev-eral other metrics, using different perceptual principles, have been proposed to better estimate the perceived quality of 3-D meshes. These solutions can be categorized as rough-ness-based, structure-based, saliency-based, and strain-ener-gy-based metrics. Since each of these categories focuses on different aspects of perception, it is unlikely for one of them to estimate the perceived visual quality for all scenarios. In this case, blending metrics of several categories may be a possible solution.
ROUGHNESS-BASED METRICS
Several solutions evaluate the quality of processed 3-D models based on their differences from the original model in their surface roughness (or smoothness). These solutions employ the observation that operations on 3-D mesh either introduce a kind of noise related to roughness (e.g., as with quantization or watermarking) or cause smoothing of the surface details (e.g., with LOD simplification for rendering). Roughness is an important perceptual property, as we cannot determine the effect of a small distortion if it is on a rough region of the model, and we can detect defects on smooth surfaces more easily. This perceptual attribute, called the masking effect, states that one visual pattern can hide the visibility of another.
Karni and Gotsman propose such a roughness-based error metric to evaluate their mesh compression approach [9]. This metric calculates the geometric Laplacian (GL) of a vertex vi as
follows: GL1vi2 5 vi2 a j[n1i2 lij21vj a j[n1i2 lij21 , (4)
where n1i2 is the set of neighbors of vertex i, and lij is the
geo-metric distance between vertices i and j. Then the norm of the Laplacian difference between models M1 and M2 is combined
with the norm of the geometric distance between the models as follows (v is the vertex set of M)
|| M12 M2||5 1
2n17 v
12 v27 1 7GL1v12 2 GL1v22 7 2. (5)
One limitation of this metric is that the compared models must have the same connectivity as the RMS error approach.
Wu et al. [10], for driving their simplification algorithm, examine the dihedral angles of the adjacent faces, consider-ing that a rough surface should have greater dihedral angles. Roughness variation has also been used for quality assessment of watermarked meshes; Gelasca et al. [11] and Corsini et al. [12] measure roughness strength by taking the difference between a mesh and its smoothed version. After computing roughness values for the original and water-marked models, the roughness-based difference is calculat-ed as follows:
R1M, Mw2 5 logaR1M2 2 R1M w2
R1M2 1 kb 2 log1k2, (6) where R1M2 is the roughness of the original mesh, R1Mw2 is
the roughness of the watermarked mesh, and k is a constant to stabilize the numerical results. These roughness-based per-ceptual metrics [11], [12] have shown to correlate very well with human judgement, particularly in the context of water-marking distortions.
Lavoué proposes a local roughness measure that is able to efficiently differentiate between the different kinds of regions in a mesh: rough parts, smooth regions, and “edge” features, which define border areas between regions [13] (see Figure 3). The proposed measure is based on a curvature analysis of local windows of the mesh and is independent of its connectivity. This measure does not estimate any distance but provides a local roughness estimation that can be used to hide artifacts and could be useful for the design of future quality metrics.
STRUCTURAL DISTORTION-BASED METRICS
Structural distortion-based metrics consider the assumption that the human visual system is good at extracting the
D (B, A)
D (A, B )
{A {B
[FIG2] The Hausdorff distance between two surfaces. The two-sided Hausdorff distance is H (A, B) 5 max(D(A,B),
structural information of a scene in addition to local prop-erties. Lavoué et al. [14] propose mesh structural distortion mea-sure (MSDM), based on the work of Wang et al. [15],
dedi-cated to 2-D images. Instead of extracting the structural infor-mation using luminance in 2-D images, this metric uses curvature analysis of the mesh geometry. In this work, a local MSDM (LMSDM) on two local windows x and y of the two meshes is calculated as
LMSDM1x, y2 5 Aa 3 L1x, y2a
1 b 3 C1x, y2a1 g 3 S1x,y2a21a, (7)
with a, b, and g selected as 0.4, 0.4, and 0.2, respectively, by the authors and with curvature comparison L, contrast com-parison C, and structure comcom-parison S computed as
L1x, y2 5 7mx2my7 max1mx,my2 , C1x, y2 5 7sx2sy7 max1sx,sy2 , and S1x, y2 5 7sx sy2sxy7 sx,sy , (8) where mx, sx, and sxy are respectively the mean, standard
deviation, and covariance of the curvature on local windows x and y. Then the MSDM is calculated as follows:
MSDM1X, Y2 5 an1 wa nw i51LMSDM1xi , yi2 a b 1 a [ 30, 12, (9) where X and Y are the compared meshes, xi and yi are the
corresponding local windows of the meshes, and nw is the
number of local windows. The value a is selected as three by the authors, for (7) and (9) [14]. This metric has proven to correlate very well with human judgement even in difficult scenarios. The authors propose an improved version of this method in [16].
SALIENCY-BASED METRICS
The metrics described above provide a guar-antee of the maximum geometric distance rather than estimating the perceived distance between the models.
In this group of metrics, the idea is to give more importance to parts of the meshes that gather more human attention. This type of metric is generally used for mesh simplification such that salient parts of a mesh are preserved in the simplification, as suggested by Howlett et al. [17] and Lee et al. [18]. The salient parts of meshes are determined by utilizing an eye-tracker in Howlett et al.’s work, whereas Lee et al.’s
method is more convenient as it computes saliency of a mesh automatically, based on its sur-face curvature.
Similar to the roughness-based and structural distortion-based metrics, saliency uses the perceptual limitation of the human visual system, and its further use for mesh quality assessment is a research area of great interest.
STRAIN-ENERGY-BASED METRICS
Bian et al. [19] propose a solution based on the strain energy on the mesh as a result of elastic deformation. Mesh models are assumed to be elastic objects; as shells composed of tri-angular faces of negligible thickness. The assumption is that triangle faces do not bend, and each triangle is deformed along its plane by ignoring any rigid body motion.
The perceptual distance between the two versions of the input model is defined as the weighted average strain energy (ASE) over all triangles of the mesh, normalized by the total area of the triangular faces
SFEM1A, B2 51
S awi Wi, (10) where wi are weights for which several strategies are tested in
[19] and Wi is the strain energy computed for triangle i.
This model correlates well with human opinion from the subjective experiment conducted by the authors.
ATTRIBUTE-BASED METRICS
Many 3-D mesh models contain per-vertex attributes in addi-tion to the vertex posiaddi-tion, such as color, normal, and texture coordinates. Also, in sharp creases of the models, there may be multiple normals per-vertex, or there may be several color values on the boundaries, causing discontinuities in the attributes.
As described by Luebke et al. [6], correspondence between vertices on two surfaces is important but is a
(a) (b) (c) (d)
[FIG3] Roughness map of a 3-D model. (a) Original model, roughness map; (b) rough regions shown with warmer colors; (c) noise on rough regions; and (d) noise on smooth regions [8].
EMERGING AS A NEWLY POPULAR
FORM OF MEDIA, 3-D MODELS ARE
USUALLY IN THE FORM OF
3-D POLYGONAL MESHES.
difficult issue for meshes with different connectivities; it is difficult to compare attribute values from the original sur-face and a simplified version in a continuous function. Luebke describes an alternative to Hausdorff, called the bijection method. This requires correspondence between vertices in a 2-D parametric domain, such as a texture map. This distance is called a parametric distance. Roy et al. [20] propose a metric called attribute deviation metric, that can be used to compare two meshes according to their geomet-ric and appearance attributes (or any other per-vertex attri-butes). The local deviation of attributes between each point of a mesh and the surface of the reference mesh is calculat-ed using parametric distances.
Pan et al. propose a different approach for quality assess-ment, calculating the quality of a 3-D model according to its wireframe and texture resolutions (11) [21]
Q1 g, t2 5 1 1 m 1 1 M 2 m 2 t1Q 1 m2 1 m 1 1 M 2 m 2 tR112g2 c. (11)
Here, m and M are the minimum and maximum bounds of quality, g and t are graphical and texture components scaled into a 30214 interval, and c is a constant. All coeffi-cients are determined by curve fitting on subjective evalua-tion data. This metric provides a very good estimaevalua-tion of human judgement as demonstrated in the authors’ subjec-tive experiment.
VIEWPOINT-DEPENDENT QUALITY ASSESSMENT
Viewpoint-dependent quality assessment metrics estimate the perceptual quality of a 3-D model as it is shown on the screen; therefore, these metrics are image based. Viewpoint-dependent metrics can be classified as nonper-ceptual metrics and pernonper-ceptually based metrics. The visual system does not matter for nonperceptual approaches; they compute the difference between two images pixel by pixel. Perceptually based metrics rely on the mechanisms of the human visual system and attempt to predict the probability that the human observer will be able to notice differences between images.
NONPERCEPTUAL METRICS
Lindstrom and Turk calculate the RMS image error for mesh simplification [22]. In their work, the meshes are rendered from multiple viewpoints and the quality of the resulting luminance images are measured in terms of their differences from the original image as follows:
dRMS1Y0, Y12 5 Å 1 mn a m i51a n j51Q yij02 yij 1 R2, (12)
where Y0 and Y1 are m by n luminance images. The RMS
met-ric is not a good metmet-ric for image quality assessment and is seldom used because it is highly affected by a shift or scale, and it does not have a perceptual aspect.
Another quality metric for comparing image quality against a reference image consists in calculating the peak sig-nal-to-noise ratio (PSNR). Using the RMS error shown in (12), the PSNR for an image with a highest possible intensity value Imax can be calculated by
PSNR5 20log10a
Imax
dRMSb. (13)
Although PSNR is also widely used for natural images, it is shown to be a poor indicator of image quality [23]. However, according to a report of the Video Quality Experts Group (VQEG), many more complicated image quality metrics are not significantly better than PSNR [24]. The reasons for this are dis-cussed in a study of Wang et al. [25].
PERCEPTUALLY BASED METRICS
Many 2-D metrics incorporate the mechanisms of the human visual system. These metrics generally use the following per-ceptual concepts: contrast sensitivity function (CSF), which indicates the relation between the visible spatial frequency and different contrast values; and masking, which describes the reduction in the visual sensitivity of a signal upon the exis-tence of another signal.
A popular metric in this category is Daly’s VDP [3]. This metric takes two images as inputs, one of which is evaluated relative to the other; and the output is an image of the percep-tual differences between the two images (see Figure 4). The
value of each pixel on the output image indicates the detection probability of the difference. The VDP is shown to be a good indicator of perceptually important areas in 3-D graphics scenes by the psy-chophysical experiment of Longhurst and Chalmers [26].
Another well-known metric is the Sarnoff visual discrimination model (VDM) [27] by Lubin. This metric also predicts the detection probability of the differences between a reference image and the evaluated image, as in VDP. The Sarnoff VDM model works on
[FIG4] (a) Original image, (b) simplified image, and (c) VDP output. (Used with permission from the Stanford University Computer Graphics Laboratory.)
spatial domain whereas VDP works in the frequency domain; VDM works faster but requires more memory. Li et al. [28] compare the two metrics and find that each model has advan-tageous properties.
Bolin and Meyer modify the
Sarnoff VDM model and propose a simpler and faster metric, which incorporates color properties into their 3-D global illu-mination calculations [29]. This metric is preferred for its efficiency. In their subjective experiment with differently simplified 3-D models, Watson et al. [30] show that this met-ric is an effective predictor of fidelity.
Ramasubramanian et al. [31] propose a perceptually based metric that defines a threshold map in which the minimum detectable difference values are stored for each pixel. This met-ric handles luminance and spatial processing separately, which provides efficiency since it enables precomputing of the spatial features.
Ramanarayanan et al. [32] introduce a novel concept, the visual equivalence predictor (VEP), which claims that two images are visually equivalent if they give the same impression even though they have visually different parts. This concept makes more sense for computer-generated imagery in which slightly different illumination techniques lead to different images when analyzed pixelwise although the two images have similar fidelity and information. This model takes 3-D geome-try, material, and illumination properties into account for the equivalency computations. The VEP concept aims to overcome the limitations of the VDP model, which only considers the earliest levels of visual coding, and is therefore too conserva-tive with respect to the kinds of approximations that can be applied in the rendering process.
Visual masking, which describes the reduction in visual sensitivity of a signal upon the existence of another signal, has been used for view-dependent quality assessment of 3-D models. Ferwerda et al. [33] investigate the masking effect for computer graphics and extend the VDP model to include color. In their study, a computational model of the masking effect of the used textures on the artifacts of the 3-D meshes is developed. This masking effect is predicted on the varying contrast, spatial frequency, and orientation features of the texture pattern and on the polygonal tessellation of the model surface.
Three image-quality metrics based on perceptual color dif-ferences are proposed by Albin et al. [34]. These similar metrics find the difference between two images in the LLAB (a modified version of CIELAB) color space. The authors state that these
metrics are not complete but only initial attempts at a perceptu-al quperceptu-ality metric. While the first metric is based on a pixel-by-pixel difference of the images, the second metric gives a single distance value using a Monte-Carlo approach, and the last one is a subdivision-based metric, which gives a rougher difference image compared to the first metric in a shorter time.
SUBJECTIVE EVALUATION OF 3-D POLYGONAL MODELS
While automatic metrics are commonly used to predict per-ceptual quality, relatively few researchers have attempted to measure and predict the visual fidelity of 3-D models through subjective experiments. These experiments could be directly used to predict the perceptual quality of 3-D models as well as to validate the outcomes of automatic metrics described in the previous sections. Generally, the term “quality” is used to judge how two images (one of them original, the other modified) are “similar” to each other.
EXPERIMENTAL MEASURES
Watson et al. study experimental fidelity measures for 3-D graphical models [30] and define three of them:
1) naming time, which measures the time from the appear-ance of an object until the observer names it
2) rating, where observers assign a number within a range and meaning determined by the experimenter
3) forced choice preferences, where observers are shown two or more stimuli, and they choose the stimulus with more of the experimenter-defined quality.
The results of this work show that automatic measures of fideli-ty (e.g., Bolin’s [29], Metro [5], mean squared error (MSE) approaches) are successful at predicting experimental ratings, less successful at predicting preferences, and largely unsuccess-ful at predicting naming times. On the other hand, when the task is based on comparing different models, ranking is stated to be better than rating the models because the given ratings do not necessarily reflect the perceptual distance between the com-pared models [35], [36]. The experimental measures used in several user studies can be found in Table 1.
EXPERIMENTAL DESIGN
The parameters used in an experiment are of great importance because they can bias the results significantly, especially for computer-generated stimuli, where almost everything can be controlled. Effective parameters controlled in several quality assessment studies are shown in Table 2 and listed as follows:
■ Lighting: The position and type of light source is a cru-cial element, with a major effect on the viewing conditions. Rogowitz et al. [35] show that models lit from the front result in different subjective scores compared to the same models lit from above. The human visual system has a prior that light is stationary and comes from a left-above orientation [37].
■ Background: The background may affect the perceived quality by changing the visibility of the boundaries of the model. While a uniform black background is used in several user studies [30], [38], Corsini et al. [12] choose a nonuni-form background that fades from blue to white so as not to overestimate the contours.
THE PARAMETERS
USED IN AN EXPERIMENT ARE
OF GREAT IMPORTANCE BECAUSE
THEY CAN BIAS THE RESULTS
SIGNIFICANTLY, ESPECIALLY FOR
COMPUTER-GENERATED STIMULI.
■ Materials and shading: Today, almost all 3-D models used in applications have material properties (e.g., texture, normals) and associated complex programmable shaders. On the other hand, most of the subjective evaluations for verifying perceptual metrics do not take material proper-ties into account; they use only diffuse and smooth-shaded models, mostly to prevent highlight effects [12]. Textures have only been used in the context of substituting geome-try with texture [21], [38]. On the other hand, as described above, material properties such as textures introduce the masking effect and hide visual artifacts. Researchers often use models without textures or complex material proper-ties to better control the number of variables influencing the outputs.
■ Animation and interaction: To evaluate a 3-D model in a fair way, observers should be able to see the models from different viewpoints. This can be achieved by animating the object or viewpoint as in [21], [35], as well as giving free viewpoint control to the user as in [8], [12], and [36]. Furthermore, animations affect the perception of the mod-els such that, in the study of Rogowitz and Rushmeier [35], artifacts caused by simplification are less visible when the objects are rotating rather than standing still. The sensitiv-ity of the human visual system is dependent on retinal velocity; the eye’s tracking ability is limited to 80 °/s [39], which should be taken into account when an experiment includes animation.
■ Type of objects: There are several concerns to keep in mind when selecting objects for a subjective experiment. Watson et al. [30] state that evaluation results are different for animal models and man-made artifacts. Further, using abstract objects helps avoid semantic interpretation [38]. Also, the complexity and roughness of the models are impor-tant. In a very complex object, simplifications may not be vis-ible and the roughness of a mesh may mask artifacts.
■ Masking: The object’s geometry, roughness, texture, and applied noise or watermarking can mask each other. Lavoue et al. [13] examine the masking effect of noise and roughness; Pan et al. [21] and Rushmeier et al. [38] examine the mask-ing effect of textures on geometry. The maskmask-ing effect should be considered while designing an experiment.
■ Extent: The extent, i.e., the display area of the rendered model in pixels, should be large enough to reflect the details of the model. Showing too many items simultaneously may decrease the visibility of the models. The display extents used in several user studies can be found in Table 2.
■ Levels: When an operation (simplification, watermarking, etc.) on meshes is to be tested, the number of the comparison cases and the strengths of the applied operations for each case should be adjusted carefully. Too few levels (compared cases) may not sufficiently reflect the tested operation, whereas a large number of levels may not be feasible, as they would require too many subjects. For simplification case, there are studies using three [30], [35] to seven [36] levels (including the originals) of simplification.
[T
ABLE 1]
EXPERIMENT METHODOLOGIES OF RECENT SUBJECTIVE EXPERIMENTS ON QUALITY ASSESSMENT
. M A S K IN G T A S K M E A S U R E S L E V E L S P U R P O S E O F T E S T W A TSON01 MESH SIMP . R A TING, PREFERENCE, NAMING TIME 3 (20%, 50%, ORIG) ROGOWITZ01 MESH SIMP . R A TING 3 (25%, 40%, ORIG) TO EV ALUA
TE STILL IMAGES FOR
GEO. MODELS CORSINI07 W A TERMARKING RA TING E1: 4 MOD 3 3 WM LEVELS 3 3 RES. 1 4 ORIG E2: 4 MOD 3 11 WM TYPES 1 4 ORIG TO FIT A METRIC SIL V A08
QUAL. ASSESMENT ON MESH SIMP
. RANKING 4 MODELS 10, 20, 27, 35, 43, 50% TO CALCULA TE QUALITY OF SIMPLIFIED MESHES PAN05 TEXTURE-MESH GEOMETR Y FITTING OF SUBJECT EV AL. RESUL TS TO PERCEPTUAL METRIC RA TING – 5 LEVELS
5 OBJECTS, 6 LEVELS OF MESH RESOLUTION
3 3 LEVELS OF TEXTURE RESOLUTION TO FIT A METRIC LA VOUÉ10 NOISE-ROUGHNESS COMPRESSION, W A TERMARKING, SMOOTHING RA TING E1: ORIG 1 3X NXOISE (0.02, 0.01, 0.005 OF BBOX) E2: 4 ORIG 1 4 3 3 NOISE ON SMOOTH 1 4 3 3 NOISE ON ROUGH E3: 4 ORIG 1 4 3 9 SMOOTH 1 4 3 12 NOISE VERSIONS TO COMP ARE DIFFERENT OBJECTIVE METRICS RUSHMEIER00 TEXTURE-MESH GEOMETR Y SIMPLIFICA TION RA TING: 0 % 100 2 OBJECTS 3 3 GEOMETR
Y LEVELS (FULL; 47X REDUCTION
IN SIZE; 94X REDUCTION IN SIZE)
3 4 TEXTURE LEVELS (NONE, 512 3 512, 256 3 256, 64 3 64)
TO EXAMINE POSSIBILITY OF SUBSTITUTING TEXTURE FOR GEOMETR
■ Stimuli order: In comparison-based experiments, stimuli can be shown to the user simultaneously (e.g., side by side) or in succession (e.g., first the reference, then the tested models). When they are shown in succession, enabling users to turn back to the reference model as in the experiment of Rogowitz and Rushmeier [35], allows for a more detailed comparison. Also, the order and the position of the stimuli should be selected in a way that minimizes the effect of exter-nal variables such as observer movements and room’s ambi-ent light.
■ Duration: The duration of which the tested models are shown to the subjects may also affect the results of evaluation.
STANDARDS FOR SUBJECTIVE EVALUATION
Although no specific recommendation for subjective evaluation of 3-D models exists currently, a number of standards, which define the conditions for subjective experiments for other mul-timedia content (e.g., image and video), could be adapted and used. A well-known standard is the ITU-R BT.500 Recommendation [40], which defines the methodology for the subjective evaluation of image quality. Different experiment methods, such as double-stimulus continuous quality-scale (DSCQS) and simultaneous double stimulus for continuous evaluation (SDSCE) are recommended and grading scales and how to present test materials are outlined. Several of these methods, which may be useful for quality assessment of 3-D meshes, are briefly explained below.
■ The DSCQS method is recommended for measuring the relative q uality of a system against a reference. It has a con-tinuous grade scale that is partitioned into five divisions of equal length, labeled bad, poor, fair, good, and excellent. Subjects can mark the scale in a continuous manner and then the grades are mapped to a zero to 100 inte rval. The ref-erence and test material are shown twice in succession.
■ The SDSCE method is recommended for measuring the fidelity between two impaired video sequences. The stimuli are shown side by side and t he grading is continuous.
■ The ITU-R BT.500 standard also includes recommenda-tions related to the evaluation of the experiments, such as how to eliminate the outlier data.
A related standard, the ITU-T P.910 recommendation [41], describes subjective assessment methods for evaluating the one-way overall quality for multimedia applications. This recommendation addresses test methods and experiment design, including comparison methods; and evaluation pro-cedures, including viewing conditions and the characteristics of the source sequences, such as duration, kind of content, number of sequences, etc. Subjective evaluation of 3-D graphical models as a form of media can benefit from these recommendations.
PERFORMANCE EVALUATION
This section is an attempt to provide a performance comparison between the viewpoint-independent and viewpoint-dependent
metrics. As an indicator of performance, we restrict to the [T
ABLE 2]
EXPERIMENT DESIGN OF RECENT SUBJECTIVE EXPERIMENTS ON QUALITY ASSESSMENT
. L IG H T IN G A N IM A T IO N / I N T E R A C T IO N M A T E R IA L S B A C K G R O U N D O B JE C T E X T E N T O F S T IM U L U S SIMUL T ANE O U S / SUCC E S S IV E W A TSON01 [30] OBLIQUE NO/NO NO BLACK MAN-MADE VS. ANIMAL 591PX IN WIDTH SIMUL TANEOUS ROGOWITZ01 [35] ABOVE, COLOCA TED WITH VIEW ROT A TING OBJECT/NO NO
SIMPLE VS. COMPLEX (VER
TEX COUNT)
SUCCESSIVE, CAN GO BACK
CORSINI07 [12]
WHITE POINT LIGHT
, TOP
CORNER OF OBJ. BBOX
NO/FREE INTERACTION
DIFFUSE ONL
Y
BLUE TO WHITE FADING
600 3 600PX SIL V A08 [36] NO/FREE INTERACTION BLACK HA VE SMALL NUM. OF VER
TICES AND DIFFERENT
NA TURE SIMUL TANEOUS PAN05 [21] FRONT ROT A TION/ADJUST ABLE ROT . SPEED TEXTURED OBJECTS 750PX IN HEIGHT SIMUL TANEOUS LA VOUÉ10 E1, E2 FRONT NO/FREE INTERACTION DIFFUSE ONL Y BLACK
OBJECTS WITH SMOOTH AND ROUGH REGIONS
SIMUL
TANEOUS
LA
VOUÉ10 E3 [8]
WHITE POINT LIGHT
, TOP CORNER OF OBJ. BB. NO/FREE INTERACTION DIFFUSE ONL Y NONUNIFORM
OBJECTS FROM DIFFERENT NA
TURES SUCCESSIVE RUSHMEIER00 [38] ABOVE, COLOCA TED WITH VIEW NO/NO TEXTURED OBJECTS BLACK ABSTRACT OBJECTS 370PX IN HEIGHT
correlation with human judg-ment (Mean opinion scores com-ing from the ratcom-ing of distorted models) captured via the subjec-tive experiments presented in the section “Subjective Evaluation of 3-D Polygonal Models.”
The task of comparison is dif-ficult because most of the
met-rics have been evaluated by a subjective database associated with their own protocols, which sometimes leads to contradic-tory results. For instance, Rogowitz et al. [35] state that image quality metrics are not adequate for measuring the quality of 3-D graphical models because lighting and animation affect the results; on the other hand, based on their experiment with models of varying LODs, Cleju and Saupe [42] claim that image-based metrics are better than metrics working on 3-D geometry.
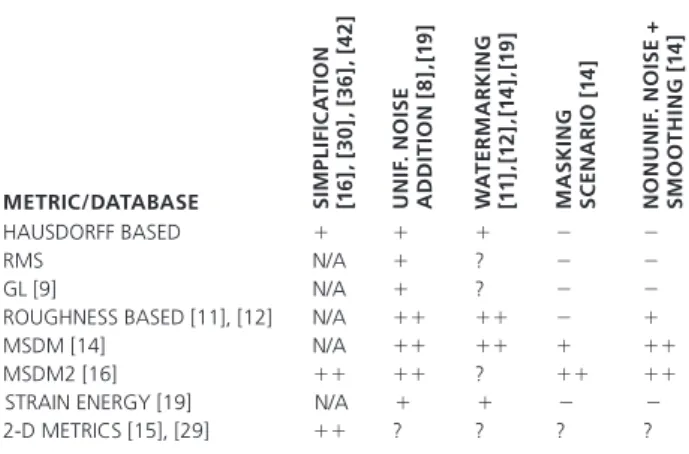
Table 3 presents the performance evaluation for most of the existing metrics according to the difficulty of the data-base; indeed if the stimuli come from the same source of distortion (such as a uniform noise addition) even a simple metric will correlate. On the other hand, if the stimuli come from different types of distortions applied on very different 3-D models, then it becomes much more difficult to corre-late with human judgement. These data from Table 3 come from many different sources; for example, in the simplifica-tion column, we have synthesized results from Cleju and Saupe [42], Watson et al. [30], and Lavoué [16] using a data-base from Silva et al. [36]. Most of these results also come from the recent study of Lavoué and Corsini [8], who made a quantitative comparison of several 3-D perceptual metrics according to several subjective databases. The rating ranges from “–” for a poor correlation to “11” for an excellent one. To indicate that no data is available, “?” is used, and “N/A” stands for “not applicable.”
Several conclusions can be drawn from this table: most metrics are still not applicable for evaluating simplification because they are not able to compare meshes that do not
share the same connectivity [9], [14], [19] or the same sampling density [11], [12].
For simple scenarios (a sin-gle mesh processing method or a single model), even simple metrics (e.g., Hausdorff) are able to correlate well with human judgment. However, for more complex scenarios, the roughness-based and structural approaches [11], [12], [14], [16] largely perform better than these simple approaches.
Two-dimensional metrics seem to perform very well for evaluating simplification, but these metrics have never been tested on other scenarios. Actually, a quantitative perfor-mance comparison of these image-based metrics against recent 3-D perceptually based ones [11], [12], [14], [16] is still missing. This would be a very interesting task involving any parameters: Which 2-D metrics would perform best? How would one choose the 2-D views of the 3-D models to feed these metrics and how would one combine the scores coming from different views into a single one for the whole 3-D model?
DISCUSSION AND CONCLUSION
Three-dimensional graphical models are emerging as a newly popular form of media, and the importance of quality assess-ment of these models is only expected to grow. We have sur-veyed different metrics and approaches for evaluating the visual quality of 3-D polygonal models; however, there are several issues to consider in the future.
It is possible to assess the visual quality of 3-D models through subjective user tests or automatic measures of quality through view-dependent or view-independent met-rics. Regarding the perceived quality directly, subjective evaluation has an advantage over metrics; however, apply-ing user tests is not practical or costly for all applications. In certain applications, such as LOD rendering, quality also has significance for run time; therefore, there is always a need for better automatic metrics for 3-D polygo-nal models.
Objective metrics are categorized as viewpoint-indepen-dent metrics and viewpoint-depenviewpoint-indepen-dent metrics. Most view-point-dependent metrics work on the image space instead of working on the 3-D geometry of the models. Although there are important research findings on this issue, we cannot clearly say that one group of metrics is superior to the other.
The nature of the models also affects the perceived quality. An important finding of Watson et al. [30] is that automatic measures predict the experimental ratings worse for animals (objects with smooth shapes) than man-made artifacts. Also, using familiar objects or abstract objects may change the results due to the semantic inter-pretations of the objects [38]. Furthermore, the usage of
[TABLE 3] PERFORMANCES OF EXISTING METRICS.
METRIC/DATABASE SIMP L IFIC A T ION [1 6 ], [ 3 0 ], [ 3 6 ], [ 4 2 ] UNIF . NOIS E ADDIT ION [ 8 ], [1 9 ] W A T E R M AR KING [1 1 ], [12 ], [14 ], [19 ] MAS KING SC EN A R IO [ 1 4 ] NONUNIF . NOIS E + S M O O T H IN G [ 1 4 ] HAUSDORFF BASED 1 1 1 2 2 RMS N/A 1 ? 2 2 GL [9] N/A 1 ? 2 2
ROUGHNESS BASED [11], [12] N/A 11 11 2 1
MSDM [14] N/A 11 11 1 11
MSDM2 [16] 11 11 ? 11 11
STRAIN ENERGY [19] N/A 1 1 2 2
2-D METRICS [15], [29] 11 ? ? ? ?
THE USAGE OF TEXTURES,
WHICH IS PRESENT IN ALMOST
ALL CURRENT 3-D MODELS, HAS A
GREAT IMPACT ON PERCEIVED
QUALITY SINCE THEY CAN MASK
textures, which is present in almost all current 3-D mod-els, has a great impact on per-ceived quality since they can mask artifacts on the models [21], [38]. Animation also affects the perceived quality of 3-D graphical models [43], [44]. Taking the above factors
into consideration, there is a need for more-comprehen-sive quality metrics that consider these different channels of the 3-D model.
Humans’ visual system characteristics are considered in many of the metrics to better reflect the perceived quality. The adaptation ability of the visual system, the masking effect, and the contrast sensitivity function are the mostly used concepts. In addition to these visibility-related models, attention-oriented metrics, which deal with predicting the highest-attended locations of 3-D models, have the potential for further development. Although attention and saliency concepts are studied for 3-D models and used in several appli-cations such as mesh simplification [17], [18], [45], there is a need for further work on developing attention-based quality metrics.
This article has also surveyed various subjective evaluation approaches for 3-D model quality assessment. The experiment design has a significant effect on the perceived quality because design decisions, such as the location of light sources, free interaction with the model, or the extent of the model on screen, bias the results. Even if the existing subjective studies seem to have produced relevant results with no error or bias in the protocols, there is a critical need for a real standard for test-ing 3-D graphical models.
Finally, we list some online platforms, tools, and reposi-tories related to 3-D model quality assessment. These are generally specialized for a specific application area. For mesh compression, the MPEG 3-D Graphics (3DG) group has initiated an activity on scalable complexity mesh com-pression to merge the theoretical models and the content used in real applications. The group uses an online platform [46] to be able to deal with 3-D graphics objects with various characteristics. For mesh simplification, there are several available tools including QSlim [47] and MeshLab [48]. Another important application area is watermarking as stat-ed by recent studies [11], [12], [14]. Wang et al. [49] have recently presented a benchmarking system for evaluating the 3-D mesh watermarking methods. Several repositories and tools, including PolyMeCo [50] and AIM@SHAPE [51], are constructed to ease the validation process of quality assessment metrics by providing tools and common compar-ison sets. There are also various free, general-purpose tools that provide 3-D model comparison (e.g., using geometric distance) such as Metro [5], MESH [7], and MeshDev [20]. These platforms and repositories can serve as a tool for future research in this field.
ACKNOWLEDGMENT
The authors would like to thank Rana Nelson for proofreading. This work is supported by the Scientific and Technical Re search Council of Turkey (TUBITAK, project number 110E029). The bunny (Figure 1) and the dragon (Figure 4) models were obtained from Stanford University Computer Graphics Laboratory with permission.
AUTHORS
Abdullah Bulbul ([email protected]) received his B.S.
degree from the Department of Computer Engineering, Bilkent University (Ankara, Turkey) in 2007; currently he is a Ph.D. can-didate in the same department. Between 2008 and 2010, he worked as a researcher for the All 3-D Imaging Phone (3-DPhone) project, which is a project funded by the Seventh Framework program of the European Union. His current research interests include the use of perceptual principles in computer graphics and mobile 3-D graphics.
Tolga Capin ([email protected]) is an assistant
professor in the Department of Computer Engineering at Bilkent University. He received his Ph.D. degree from Ecole Polytechnique Federale de Lausanne (EPFL), Switzerland in 1998. He has authored more than 25 journal papers and book chapters, 40 conference papers, and a book. He has three patents and ten pending patent applications. His research interests include networked virtual environments, mobile graphics, computer animation, and human-computer interaction.
Guillaume Lavou´e ([email protected]) received the
engineering degree in signal processing and computer sci-ence from CPE Lyon (2002), the M.Sc. degree in image pro-cessing from the University Jean Monnet, St-Etienne (2002), and the Ph.D. degree in computer science from the University Claude Bernard, Lyon, France (2005). Following a postdoctoral fellowship at the Signal Processing Institute (EPFL) in Switzerland, he has been an associate professor at the French engineering university INSA of Lyon, in the LIRIS Laboratory (UMR 5205 CNRS), since 2006. His research interests include 3-D model analysis and processing including compression, watermarking, perception, and 2-D/3-D recognition.
Marius Preda ([email protected]) received an
engi-neering degree in electronics from University Politehnica (Bucharest, Romania) in 1998, and a Ph.D. degree in mathemat-ics and informatmathemat-ics from University Paris V–René Descartes (Paris, France) in 2001. He is currently an associate professor at Institut Telecom. His research interests include generic virtual character definition and animation, rendering, low bitrate pression and transmission of animation, and multimedia com-position and standardization. He is the chair of the 3-D graphics subgroup of ISO’s Moving Picture Experts Group and is involved
ONE OF THE MOST POPULAR
AND EARLIEST METRICS
FOR COMPARING A PAIR
OF MODELS WITH DIFFERENT
CONNECTIVITIES
IS THE HAUSDORFF DISTANCE.
in several research projects at the institutional, national and European levels.
REFERENCES
[1] J. Cooperstock, “Multimodal telepresence systems,” IEEE Signal Processing
Mag., vol. 28, no. 1, pp. 77–86, Jan. 2011.
[2] L. Daly and D. Brutzman, “X3D: Extensible 3D graphics standard [standards in a nutshell],” IEEE Signal Processing Mag., vol. 24, no. 6, pp. 130–135, Nov. 2007. [3] S. Daly, “The visible differences predictor: an algorithm for the assessment of image fidelity,” in Digital Images and Human Vision, A. B. Watson, Ed. Cam-bridge, MA,: MIT Press, 1993, pp. 179–206.
[4] K. Myszkowski, T. Tawara, H. Akamine, and H.-P. Seidel, “Perception-guided global illumination solution for animation rendering,” in Proc. 28th Annu. Conf.
Computer Graphics and Interactive Techniques (SIGGRAPH’01). New York: ACM,
2001, pp. 221–230.
[5] P. Cignoni, C. Rocchini, and R. Scopigno, “Metro: Measuring error on simpli-fied surfaces,” Comput. Graph. Forum, vol. 17, no. 2, pp. 167–174, 1998. [6] D. Luebke, B. Watson, J. D. Cohen, M. Reddy, and A. Varshney, Level of Detail
for 3D Graphics. New York: Elsevier Science, 2002.
[7] N. Aspert, D. Santa-Cruz, and T. Ebrahimi, “Mesh: Measuring errors between surfaces using the Hausdorff distance,” in Proc. 2002 IEEE Int. Conf. Multimedia
and Expo (ICME ’02), 2002, vol. 1, pp. 705–708.
[8] G. Lavoué and M. Corsini, “A comparison of perceptually based metrics for objective evaluation of geometry processing,” IEEE Trans. Multimedia, vol. 12, no. 7, pp. 636–649, Nov. 2010.
[9] Z. Kar ni and C. Gotsman, “Spectral compression of mesh geometry,” in
Proc. 27th Annu. Conf. Computer Graphics and Interactive Techniques (SIG-GRAPH’00). New York: ACM/Addison-Wesley, 2000, pp. 279–286.
[10] J.-H. Wu, S.-M. Hu, J.-G. Sun, and C.-L. Tai, “An effective feature-preserving mesh simplification scheme based on face constriction,” in Proc. 9th Pacific Conf.
Computer Graphics and Applications (PG’01). Washington, DC: IEEE Comput.
Soc., 2001, pp. 12–21.
[11] E. D. Gelasca, T. Ebrahimi, M. Corsini, and M. Barni, “Objective evaluation of the perceptual quality of 3D watermarking,” in Proc. IEEE Int. Conf. Image
Processing (ICIP), 2005, pp. 241–244.
[12] M. Cor sini, E. D. Gelasca, T. Ebrahimi, and M. Barni, “Watermarked 3D mesh quality assessment,” IEEE Trans. Multimedia, vol. 9, no. 2, pp. 247–256, 2007. [13] G. Lav oué, “A local roughness measure for 3d meshes and its application to visual masking,” ACM Trans. Appl. Percept., vol. 5, pp. 21:1–21:23, Feb. 2009. [14] G. Lavoué, E . D. Gelasca, F. Dupont, A. Baskurt, and T. Ebrahimi, “Perceptu-ally driven 3D distance metrics with application to watermarking,” in Proc. SPIE
Applications of Digital Image Processing XXIX, 2006, vol. 6312, pp. 63120L.1–
63120L.12.
[15] Z. Wang, A. Bovik, H. Sheikh, and E. Simoncelli, “Image quality assessment: From error visibility to structural similarity,” IEEE Trans. Image Processing, vol. 13, no. 4, pp. 600–612, Apr. 2004.
[16] G. Lavoué, “A mult iscale metric for 3D mesh visual quality assessment,” in
Computer Graphics Forum, vol. 30, no. 5, pp. 1427–1437, 2011.
[17] S. Howlett, J. Hamill, a nd C. O’Sullivan, “An experimental approach to predicting saliency for simplified polygonal models,” in Proc. 1st Symp. Applied
Perception in Graphics and Visualization (APGV’04). New York: ACM, 2004,
pp. 57–64.
[18] C. H. Lee, A. Varshney, and D. W. Jacobs, “Mesh saliency,” in Proc. ACM
SIG-GRAPH 2005 Papers (SIGSIG-GRAPH’05). New York: ACM, 2005, pp. 659–666.
[19] Z. Bian, S.-M. Hu, and R . R. Martin, “Evaluation for small visual difference between conforming meshes on strain field,” J. Comput. Sci. Technol., vol. 24, pp. 65–75, Jan. 2009.
[20] M. Roy, S. Foufou, and F . Truchetet, “Mesh comparison using attribute devia-tion metric,” J. Image Graph., vol. 4, no. 1, pp. 1–14, 2004.
[21] Y. Pan, I. Cheng, and A. Basu, “Quality metric for approximating subjective evaluation of 3-D objects,” IEEE Trans. Multimedia, vol. 7, no. 2, pp. 269–279, Apr. 2005.
[22] P. Lindstrom and G. Turk , “Image-driven simplification,” ACM Trans. Graph., vol. 19, pp. 204–241, July 2000.
[23] Z. Wang, H. Sheikh, and A. Bovik, “No-reference perceptual quality assess-ment of jpeg compressed images,” in Proc. IEEE Int. Conf. Image Processing
(ICIP), 2002, vol. 1, pp. 477–480.
[24] A. M. Rohaly, J. Libert, P. Corriveau, and A. Webster, “Final report from the video quality experts group on the validation of objective models of video quality assessment,” Video Quality Experts Group (VQEG), Tech. Rep., Mar. 2000.
[25] Z. Wang, Z. Wang, and A. C. Bovik, “Why is image quality assessment so dif-ficult?” in Proc. IEEE Int. Conf. Acoustics, Speech, and Signal Processing, 2002, pp. 3313–3316.
[26] P. Longhurst and A. Chal mers, “User validation of image quality assessment algorithms,” in Proc. Theory and Practice of Computer Graphics (TPCG’04). Washington, DC: IEEE Comput. Soc., 2004, pp. 196–202.
[27] J. Lubin, A Visual Discr imination Model for Imaging System Design and
Evaluation, E. Peli, Ed. Singapore: World Scientific, 1995.
[28] B. Li, G. W. Meyer, and R. V. Klassen, “A comparison of two image quality models,” in Proc. SPIE Human Vision and Electronic Imaging III, 1998, vol. 3299, pp. 98–109.
[29] M. R. Bolin and G. W. Me yer, “A perceptually based adaptive sampling algo-rithm,” in Proc. 25th Annu. Conf. Computer Graphics and Interactive Techniques
(SIGGRAPH’98). New York: ACM, 1998, pp. 299–309.
[30] B. Watson, A. Friedman, and A. McGaffey, “Measuring and predicting visual fi-delity,” in Proc. 28th Annu. Conf. Computer Graphics and Interactive Techniques
(SIGGRAPH’01). New York: ACM, 2001, pp. 213–220.
[31] M. Ramasubramanian, S. N . Pattanaik, and D. P. Greenberg, “A perceptually based physical error metric for realistic image synthesis,” in Proc. 26th Annu. Conf.
Computer Graphics and Interactive Techniques (SIGGRAPH’99). New York:
ACM/Addison-Wesley, 1999, pp. 73–82.
[32] G. Ramanarayanan, J. Fer werda, B. Walter, and K. Bala, “Visual equivalence: Towards a new standard for image fidelity,” in ACM SIGGRAPH 2007 Papers
(SIG-GRAPH’07). New York: ACM, 2007, pp. 76-1–76-11.
[33] J. A. Ferwerda, P. Shirl ey, S. N. Pattanaik, and D. P. Greenberg, “A model of visual masking for computer graphics,” in Proc. 24th Annu. Conf. Computer
Graphics and Interactive Techniques (SIGGRAPH’97). New York: ACM
/Addison-Wesley, 1997, pp. 143–152.
[34] S. Albin, G. Rougeron, B . Peroche, and A. Tremeau, “Quality image metrics for synthetic images based on perceptual color differences,” IEEE Trans. Image
Processing, vol. 11, no. 9, pp. 961–971, Sept. 2002.
[35] B. E. Rogowitz and H. E. Rushmeier, “Are image quality metrics adequate to evaluate the quality of geometric objects,” in Proc. SPIE Human Vision and
Elec-tronic Imaging VI, San Jose, CA, 2001, pp. 340–348.
[36] S. Silva, B. S. Santos, J. Madeira, and C. Ferreira, “Perceived quality assess-ment of polygonal meshes using observer studies: A new extended protocol,” in
Proc. SPIE Human Vision and Electronic Imaging XIII, 2008, vol. 6806.
[37] I. Howard and B. Rogers, Seeing in Depth. New York: Oxford Univ. Press, 2008. [38] H. E. Rushmeier, B. E. R ogowitz, and C. Piatko, “Perceptual issues in substi-tuting texture for geometry,” in Proc. SPIE Human Vision and Electronic Imaging
V, B. E. Rogowitz and T. N. Pappas, Eds., 2000, vol. 3959, no. 1, pp. 372–383.
[39] S. Daly, “Engineering ob servations from spatiovelocity and spatiotemporal visual models,” in Proc. IS&T/SPIE Conf. Human Vision and Electronic Imaging
III, SPIE, 1998, vol. 3299, pp. 180–191.
[40] ITU Recommendation bt.50 0-10, “Methodology for subjective assessment of the quality of television pictures,” ITU, ITU Recommendation bt.500-10, 2000. [41] ITU Recommendation p.910 , “Subjective video quality assessment methods for multimedia applications,” ITU, ITU Recommendation p.910, 1996.
[42] I. Cleju and D. Saupe, “ Evaluation of supra-threshold perceptual metrics for 3d models,” in Proc. 3rd Symp. Applied Perception in Graphics and Visualization
(APGV’06). New York: ACM, 2006, pp. 41–44.
[43] C. O’Sullivan, J. Dingli ana, T. Giang, and M. K. Kaiser, “Evaluating the visual fidelity of physically based animations,” ACM Trans. Graph., vol. 22, pp. 527–536, July 2003.
[44] K. Myszkowski, “Percepti on-based global illumination, rendering, and anima-tion techniques,” in Proc. 18th Spring Conf. Computer Graphics (SCCG’02). New York: ACM, 2002, pp. 13–24.
[45] A. Bulbul, C. Koca, T. C apin, and U. Güdükbay, “Saliency for animated meshes with material properties,” in Proc. 7th Symp. Applied Perception in Graphics and
Visualization (APGV’10). New York: ACM, 2010, pp. 81–88.
[46] MyMultimediaWorld. [Online]. Ava ilable: http://www.mymultimediaworld. com
[47] M. Garland. (2009). QSlim simplifica tion software. [Online]. Available: http://mgarland.org/software/qslim.html
[48] P. Cignoni et al. (2011). MeshLab. Visual Computing Lab, ISTI, CNR. [On-line]. Available: ht tp://meshlab.sourceforge.net/
[49] K. Wang, G. Lavoué, F. Denis, A. Baskurt, and X. He, “A benchmark for 3D mesh watermarking,” in Proc. IEEE Int. Conf. Shape Modeling and Applications, 2010, pp. 231–235.
[50] S. Silva. (2008). PolyMeCo. [Online]. Available: http:// www.ieeta.pt/ polymeco/index.php/home