ABSTRACT: This study was conducted to determine the seed yield, straw yield and straw quality parameters of forage pea lines and cultivars in the years 2014 and 2015. As the plant material, 14 different forage pea genotypes including 6 lines and 8 cultivars were used. Experiments were conducted in randomized complete blocks design with three replications. Seed yield, straw yield, thousand seed weight, crude ash ratio, crude protein ratio, crude protein yield, acid detergent fiber (ADF), neutral detergent fiber (NDF), digestible dry matter (DDM), dry matter intake (DMI) and relative feed value (RFV) were investigated. Seed yields varied between 33.8-180.2 kg da-1, straw yields between 160.3-887.0 kg da-1, thousand seed weights between 99.1-150.2 g, crude ash ratios between 9.42-11.19%, crude protein ratios between 6.54-11.91%, crude protein yields between 11.9-104.9 kg da-1, ADF ratios between 29.5-39.8%, NDF ratios between 39.1-51.2%, DDM between 57.9-65.9%, DMI between 2.35-3.08% and RFV between 105.5-157.4. In terms of the examined parameters; Gatem, Ürünlü, Gölyazı and Spring Pea 3-638 genotypes were found to be superior over the others under Bingöl ecological conditions.
Keywords: Correlation, forage pea, straw yield, straw quality
ÖZET: Bu çalışma, bazı yem bezelyesi hat ve çeşitlerinin tohum verimi, kes verimi ve kes kalitesini belirlemek amacıyla 2014-2015 yılları arasında iki yıl süreyle yürütülmüştür. Çalışmada materyal olarak 6 adet yem bezelyesi hattı ve 8 adet yem bezelyesi çeşidi olmak üzere toplam 14 genotip kullanılmıştır. Araştırma tesadüf blokları deneme desenine göre üç tekerrürlü olarak kurulmuştur. Araştırmada; tohum verimi, kes verimi, bin tane ağırlığı, keste ham kül, ham protein oranı, ham protein verimi, asit çözücülerde çözünmeyen lif (ADF), nötr çözücülerde çözünmeyen lif (NDF), sindirilebilir kuru madde (SKM), kuru madde tüketimi (KMT) ve nispi yem değerlerine (NYD) ilişkin veriler ele alınmıştır. Araştırma sonucunda; tohum verimi 33.8-180.2 kg da-1, kes verimi 160.3-887.0 kg da-1, bin tane ağırlığı 99.1-150.2 g, ham kül oranı %9.42-11.19, ham protein oranı %6.54-11.91, ham protein verimi 11.9-104.9 kg da-1, ADF %29.5-39.8, NDF %39.1-51.2, SKM %57.9-65.9, KMT %2.35-3.08 ve NYD 105.5-157.4 arasında değişmiştir. İncelenen parametreler açısından; Gatem, Ürünlü, Gölyazı ve Spring Pea 3-638 genotiplerinin Bingöl ekolojik koşullarında üstün özellikler göstererek öne çıktığı tespit edilmiştir.
Anahtar Kelimeler: Kes verimi, kes kalitesi, korelasyon, yem bezelyesi
Evaluation of Some Forage Pea (Pisum sativum ssp. arvense L.)
Lines and Cultivars in Terms of Seed Yield and Straw Quality
Bazı Yem Bezelyesi Hat ve Çeşitlerinin (Pisum sativum ssp. arvense L.)
Tohum Verimi ve Kes Kalitesi Açısından Değerlendirilmesi
Erdal ÇAÇAN1, Mahmut KAPLAN2, Kağan KÖKTEN3, Halit TUTAR4
Iğdır
Üniversitesi Fen Bilimleri Enstitüsü Dergisi
Iğdır University Journal of the Institute of Science and T
echnology
1 Erdal ÇAÇAN (0000-0002-9469-2495), Bingöl Üniversitesi, Genç Meslek Yüksekokulu, Bitkisel ve Hayvansal Üretim Bölümü,
Bingöl, Türkiye
2 Mahmut KAPLAN (0000-0002-6717-4115), Erciyes Üniversitesi, Ziraat Fakültesi, Tarla Bitkileri Bölümü, Kayseri, Türkiye 3 Kağan KÖKTEN (0000-0001-5403-5629), Bingöl Üniversitesi, Ziraat Fakültesi, Tarla Bitkileri Bölümü, Bingöl, Türkiye 4 Halit TUTAR (0000-0002-9341-3503), Bingöl Üniversitesi, Ziraat Fakültesi, Tarla Bitkileri Bölümü, Bingöl, Türkiye
Sorumlu yazar/Corresponding Author: Erdal ÇAÇAN, [email protected]
* Bu çalışma 09-11 Ekim 2017 tarihinde Iğdır-Türkiye’de düzenlenen II. International Iğdır Symposium’unda sunulmuş ve kongre özet kitabında yayınlanmıştır. Cilt/ Volume : 8, Sayı/ Issue : 2, Sayfa/ pp : 275-284, 2018 ISSN: 2146-0574, e-ISSN: 2536-4618 DOI: 10.21597/jist.428996
INTRODUCTION
Forage pea is an annual leguminous forage crop. It is cultivated in various regions of Turkey with the local names of “külür” or “kürül”. It is primarily cultivated for hay and seeds. Forage pea hay is delicious and has quite high nutritional values. It can successfully be used in feeding all farm animals. Seeds are perfect source of protein. They are quite rich in protein and the ground seeds are usually mixed into roughage. Seeds can also be used in feeding of all animals (Açıkgöz, 2001; Açıkgöz, 2013). Forage pea seeds are used as a source of protein in European Union countries as an alternative to soybean. Forage pea seeds contain about 20-30% crude protein (Açıkgöz, 2001; Avcıoğlu ve ark., 2009).
Seed yield of peas varies significantly. Yield levels
drop down to 60-70 kg da-1 in less developed countries.
However, it can reach up to 160 kg da-1 in the USA and
Canada. The average seed yields in Western European
countries are around 400-500 kg da-1. In Turkey, seed
yields are about 100-150 kg under dry conditions. The
yields in coastal regions vary between 150-300 kg da
-1. Forage pea hay contains around 8.4% crude protein
(Açıkgöz 2001; Avcıoğlu ve ark., 2009; Açıkgöz, 2013). In a study carried out by Bilgili ve Açıkgöz (1999), they reported that dry hay yield of forage pea lines
varied between 332-430 kg da-1 and 15-92 kg da-1 for
seed yields. Significant amount of straw is produced during the seed production practices. Forage pea straw is more valuable than cereal straw and it is commonly used in animal feeding (Açıkgöz, 2001; Manga ve ark., 2003; Acar ve Ayan, 2012). In this study, seed yield, straw yield and straw quality parameters of 14 different forage pea lines were investigated.
MATERIAL AND METHOD
Experiments were conducted over the experimental fields of Bingöl University under dry conditions (rain-fed) for two years (2014-2015). As the plant material, 6 different forage pea lines (88 PO38-4-3-683, Spring Pea 3-638, P57B, P51, P101, P104) and 8 forage pea cultivars (Atos, Özkaynak, Retna, Gatem, Spring, Bolero, Ürünlü and Gölyazı) were used.
Field experiments were established in April of both years in randomized blocks design with 3 replications. Experimental plots were 5 m long and each plot had 6 rows with 30 cm row spacing. Sowing was performed
with a hand marker. Sowing rate was 15 kg da-1. Before
sowing, 4 kg da-1 pure nitrogen (N) and 10 kg da-1
phosphorus (P2O5) were applied to experimental plots.
Harvest for seed was performed in the first week of July of both years.
Meteorological data for Bingöl province were supplied from the nearest directorate of meteorology. Long-term (1990-2015) monthly average temperature
of the research site was 12.3 oC, annual total
precipitation was 950.8 mm and average relative humidity was 56.9%. Monthly average temperature of
the experimental years (13.1 oC) and relative humidity
values (54.2%) were close to long-term averages. However, annual precipitation of experimental years (2014-2015) (832.6 mm) was lower than the long-term average of Bingöl province.
Soil samples were taken from 0-30 cm soil profile of 10 different locations and they were mixed together. This representative sample was then analyzed at Soil-Plant analysis laboratory of Bingöl University Agricultural Faculty. Analyses results were assessed through comparisons with the limit values specified in Sezen (1995) and Karaman (2012). Experimental soils were loamy in texture (43.31% saturation), slightly acidic (pH = 6.37), unsaline (0.0066%), low in organic matter (1.26%), loam (0.15%) and potassium (24.45 kg
da-1) and medium in phosphorus (7.91 kg da-1).
Harvested plots were then threshed to get seed and straw yield. From each cultivar, 400 seeds were weighted to get thousand-seed weight. Following the seed harvest, remaining straw was ground in a mill with 1 mm sieve and used in quality analyses. Crude ash content of the samples was determined through ashing
the samples in an ash oven at 550 oC for 8 hours. Nitrogen
(N) content was determined with Kjeldahl method. Resultant nitrogen content was multiplied by 6.25 to get crude protein content (AOAC, 1990). Neutral Detergent Fiber (NDF) and Acid Detergent Fiber (ADF) values were determined with an ANKOM 200 Fiber Analyzer (ANKOM Technology Corp. Fairport, NY, USA) device (Van Soest et al., 1991). Then by using ADF and NDF values, digestible dry matter (DDM=88.9 - (0.779 x ADF%)), dry matter intake (DMI=120 / NDF%) and relative feed value (RFV=(DDM x DMI) / 1.29) were calculated (Morrison, 2003).
Experimental data were subjected to variance analysis (with SAS software) in accordance with randomized blocks design with 3 replications. Significant factor means were compared with Duncan’s
multiple range test. Basic correlation coefficients were calculated to identify the relationships among investigated parameters.
RESULTS AND DISCUSSION Seed and straw yield (kg da-1)
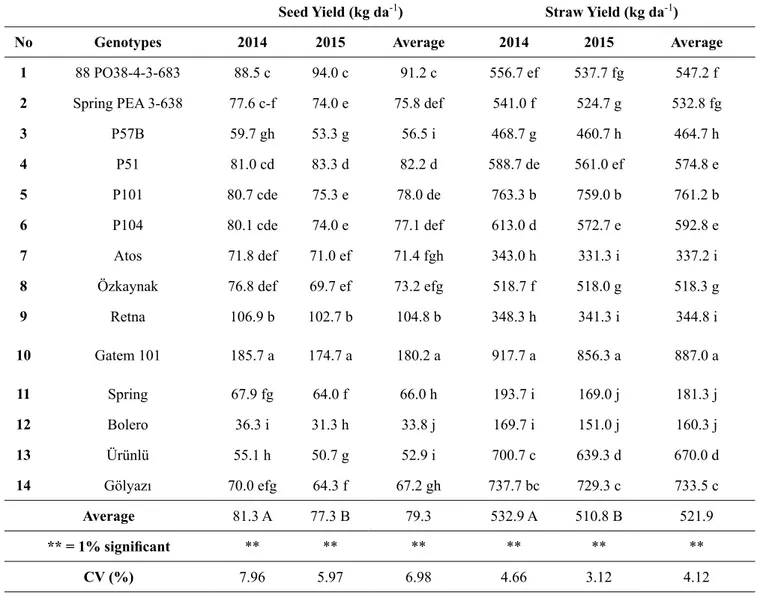
Seed and straw yield of forage pea lines and cultivars and mean values are provided in Table 1. The differences in seed and straw yields of the genotypes and years were found to be significant (p<0.01). The differences within the same year were also found to be significant (p<0.01).
As the average of two years, the highest seed yield
(180.2 kg da-1) was obtained from Gatem cultivar. It
was followed by Retna cultivar (104.8 kg da-1) and
the lowest seed yield (33.8 kg da-1) was obtained from
Bolero cultivar. Considering the seed yields of the years,
the highest average value (81.3 kg da-1) was observed
in 2014 and the lowest average yield (77.3 kg da-1) was
observed in 2015. Two-year average seed yield of the
genotypes was calculated as 79.3 kg da-1.
As the average of two years, the highest straw
yield (887.0 kg da-1) was obtained from Gatem cultivar.
It was followed by P101 genotype (761.2 kg da-1) and
the lowest straw yields were obtained from Bolero (160.3 kg da-1) and Spring (181.3 kg da-1) cultivars. Considering the straw yields of the years, the highest
average straw yield (532.9 kg da-1) was observed in
2014 and the lowest average straw yield (510.8 kg da-1)
was observed in 2015. Two-year average straw yield of
the genotypes was calculated as 521.9 kg da-1 (Table 1).
Table 1. Seed and straw yields of forage pea genotypes
Seed Yield (kg da-1) Straw Yield (kg da-1)
No Genotypes 2014 2015 Average 2014 2015 Average
1 88 PO38-4-3-683 88.5 c 94.0 c 91.2 c 556.7 ef 537.7 fg 547.2 f
2 Spring PEA 3-638 77.6 c-f 74.0 e 75.8 def 541.0 f 524.7 g 532.8 fg
3 P57B 59.7 gh 53.3 g 56.5 i 468.7 g 460.7 h 464.7 h
4 P51 81.0 cd 83.3 d 82.2 d 588.7 de 561.0 ef 574.8 e
5 P101 80.7 cde 75.3 e 78.0 de 763.3 b 759.0 b 761.2 b
6 P104 80.1 cde 74.0 e 77.1 def 613.0 d 572.7 e 592.8 e
7 Atos 71.8 def 71.0 ef 71.4 fgh 343.0 h 331.3 i 337.2 i
8 Özkaynak 76.8 def 69.7 ef 73.2 efg 518.7 f 518.0 g 518.3 g
9 Retna 106.9 b 102.7 b 104.8 b 348.3 h 341.3 i 344.8 i 10 Gatem 101 185.7 a 174.7 a 180.2 a 917.7 a 856.3 a 887.0 a 11 Spring 67.9 fg 64.0 f 66.0 h 193.7 i 169.0 j 181.3 j 12 Bolero 36.3 i 31.3 h 33.8 j 169.7 i 151.0 j 160.3 j 13 Ürünlü 55.1 h 50.7 g 52.9 i 700.7 c 639.3 d 670.0 d 14 Gölyazı 70.0 efg 64.3 f 67.2 gh 737.7 bc 729.3 c 733.5 c Average 81.3 A 77.3 B 79.3 532.9 A 510.8 B 521.9 ** = 1% significant ** ** ** ** ** ** CV (%) 7.96 5.97 6.98 4.66 3.12 4.12
Seed yields of forage pea genotypes were reported
as between 64.0-118.6 kg da-1 by Toğay ve ark. (2006);
as between 71.7-246.3 kg da-1 by Sayar ve Anlarsal
(2008) and as between 8.67-348.7 kg da-1 by Karaköy ve
ark. (2016). Present findings on seed yield comply with those earlier ones. However, seed yields were reported
as between 115.5-210.5 kg da-1 by Sayar ve ark. (2009);
as between 156-190 kg da-1 by Tan et al. (2012); as
between 285.6-316.1 kg da-1 by Uzun ve ark. (2012) and
as between 158-180 kg da-1 by Timurağaoğlu ve ark.
(2004). Present findings were lower than those earlier ones just because of different ecological conditions of growing sites.
Straw yields of the present study were higher than
the values reported by Tan et al. (2012) (377-407 kg da-1).
Present seed yields were lower than the seed yields of that study, therefore straw yields of the present study were higher than the straw yields of that study.
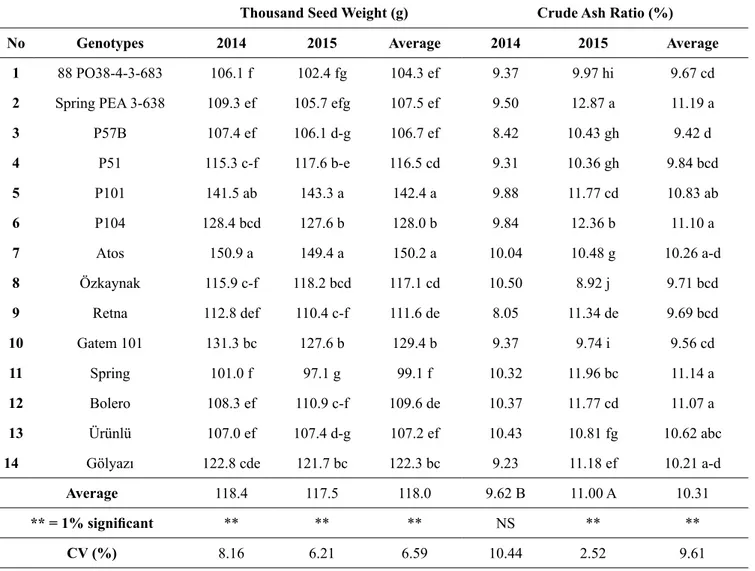
Thousand seed weight (g) and crude ash ratio (%)
Thousand seed weight and crude ash ratios of forage pea genotypes are provided in Table 2. The differences in thousand seed weights of the genotypes and the differences within the same year were found to be significant (p<0.01). The differences in crude ash ratios of the genotypes and the years were found to be significant (p<0.01).
As the average of two years, the highest thousand seed weight (150.2 g) was obtained from Atos cultivar. It was followed by P101 genotype (142.4 g) which was placed in the same statistical group.
There were not significant differences between thousand seed weight of the years and two-year average of thousand seed weight was calculated as 118.0 g.
Table 2. Thousand seed weight and crude ash ratios of forage pea genotypes
Thousand Seed Weight (g) Crude Ash Ratio (%)
No Genotypes 2014 2015 Average 2014 2015 Average
1 88 PO38-4-3-683 106.1 f 102.4 fg 104.3 ef 9.37 9.97 hi 9.67 cd
2 Spring PEA 3-638 109.3 ef 105.7 efg 107.5 ef 9.50 12.87 a 11.19 a
3 P57B 107.4 ef 106.1 d-g 106.7 ef 8.42 10.43 gh 9.42 d 4 P51 115.3 c-f 117.6 b-e 116.5 cd 9.31 10.36 gh 9.84 bcd 5 P101 141.5 ab 143.3 a 142.4 a 9.88 11.77 cd 10.83 ab 6 P104 128.4 bcd 127.6 b 128.0 b 9.84 12.36 b 11.10 a 7 Atos 150.9 a 149.4 a 150.2 a 10.04 10.48 g 10.26 a-d 8 Özkaynak 115.9 c-f 118.2 bcd 117.1 cd 10.50 8.92 j 9.71 bcd 9 Retna 112.8 def 110.4 c-f 111.6 de 8.05 11.34 de 9.69 bcd 10 Gatem 101 131.3 bc 127.6 b 129.4 b 9.37 9.74 i 9.56 cd 11 Spring 101.0 f 97.1 g 99.1 f 10.32 11.96 bc 11.14 a 12 Bolero 108.3 ef 110.9 c-f 109.6 de 10.37 11.77 cd 11.07 a 13 Ürünlü 107.0 ef 107.4 d-g 107.2 ef 10.43 10.81 fg 10.62 abc
14 Gölyazı 122.8 cde 121.7 bc 122.3 bc 9.23 11.18 ef 10.21 a-d
Average 118.4 117.5 118.0 9.62 B 11.00 A 10.31
** = 1% significant ** ** ** NS ** **
As the average of two years, the lowest crude ash ratios were obtained from P57B, Gatem and 88 PO38-4-3-683 genotypes. Considering the crude ash ratios of the years, the highest average value (11.00%) was observed in 2015 and the lowest average value (9.62%) was observed in 2014. Two-year average crude ash ratio of the genotypes was calculated as 10.31%.
Thousand seed weights of forage pea genotypes were reported as between 93.5-234.2 g by Sayar ve Anlarsal (2008); as between 96.8-248.6 g by Sayar ve ark. (2009); as between 84.5-99.3 g by Tan et al. (2012)
and as between 58-299 g by Karaköy ve ark. (2016). Present findings on thousand seed weight comply with those earlier ones.
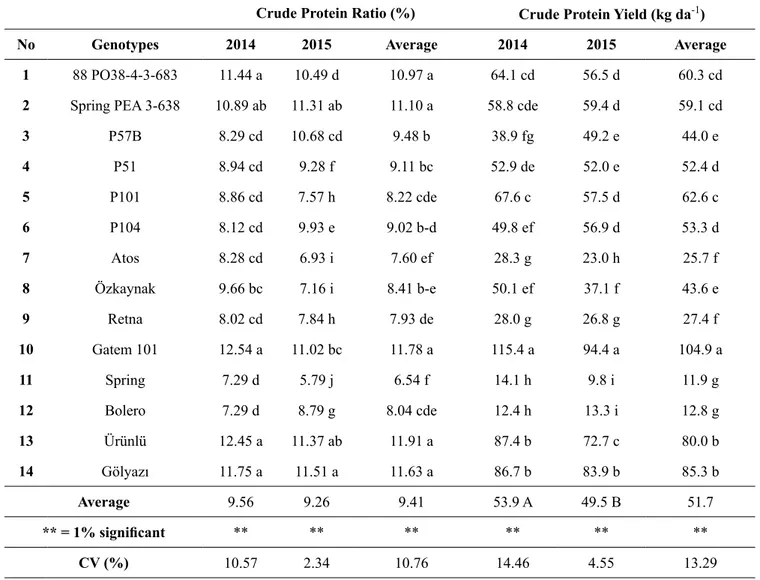
Crude protein ratio (%) and crude protein yield (kg da-1)
Crude protein ratios and yields of forage pea genotypes are provided in Table 3. The differences in crude protein ratios and yields within the same year and the differences among the genotypes were found to be significant (p<0.01).
Table 3. Crude protein ratio and crude protein yields of forage pea genotypes
Crude Protein Ratio (%) Crude Protein Yield (kg da-1)
No Genotypes 2014 2015 Average 2014 2015 Average
1 88 PO38-4-3-683 11.44 a 10.49 d 10.97 a 64.1 cd 56.5 d 60.3 cd
2 Spring PEA 3-638 10.89 ab 11.31 ab 11.10 a 58.8 cde 59.4 d 59.1 cd
3 P57B 8.29 cd 10.68 cd 9.48 b 38.9 fg 49.2 e 44.0 e 4 P51 8.94 cd 9.28 f 9.11 bc 52.9 de 52.0 e 52.4 d 5 P101 8.86 cd 7.57 h 8.22 cde 67.6 c 57.5 d 62.6 c 6 P104 8.12 cd 9.93 e 9.02 b-d 49.8 ef 56.9 d 53.3 d 7 Atos 8.28 cd 6.93 i 7.60 ef 28.3 g 23.0 h 25.7 f 8 Özkaynak 9.66 bc 7.16 i 8.41 b-e 50.1 ef 37.1 f 43.6 e 9 Retna 8.02 cd 7.84 h 7.93 de 28.0 g 26.8 g 27.4 f 10 Gatem 101 12.54 a 11.02 bc 11.78 a 115.4 a 94.4 a 104.9 a 11 Spring 7.29 d 5.79 j 6.54 f 14.1 h 9.8 i 11.9 g 12 Bolero 7.29 d 8.79 g 8.04 cde 12.4 h 13.3 i 12.8 g 13 Ürünlü 12.45 a 11.37 ab 11.91 a 87.4 b 72.7 c 80.0 b 14 Gölyazı 11.75 a 11.51 a 11.63 a 86.7 b 83.9 b 85.3 b Average 9.56 9.26 9.41 53.9 A 49.5 B 51.7 ** = 1% significant ** ** ** ** ** ** CV (%) 10.57 2.34 10.76 14.46 4.55 13.29
As the average of two years, the highest crude protein ratio (11.91%) was obtained from Ürünlü cultivar and it was respectively followed by Gatem (11.78%), Gölyazı (11.635), Spring Pea 3-638 (11.10%) and 88 PO38-4-3-683 (10.97%) genotypes. The lowest
crude protein ratio (6.54%) was obtained from Spring cultivar. There were not any significant differences in crude protein ratios of the years and two-year average crude protein ratio was calculated as 9.41%.
As the average of two years, the highest crude
protein yield (104.9 kg da-1) was obtained from Gatem
cultivar and the lowest crude protein yields were
obtained from Atos (25.7 kg da-1) and Retna (27.4 kg
da-1) cultivars. Considering the crude protein yields of
the years, the highest average value (53.9 kg da-1) was
observed in 2014 and the lowest average value (49.5
kg da-1) was observed in 2015. Two-year average crude
protein yield of the genotypes was calculated as 51.7 kg da-1.
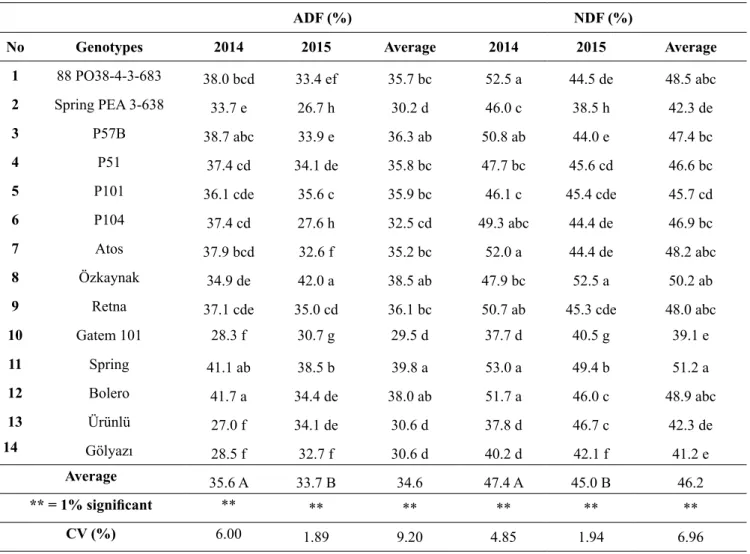
Acid detergent fiber (ADF) and neutral detergent fiber (NDF) ratios (%)
ADF and NDF ratios of the forage pea genotypes are provided in Table 4. The differences in ADF and NDF ratios of the genotypes, years and the differences within the same year were all found to be significant (p<0.01).
As the average of two years, the lowest ADF ratio (29.5%) was obtained from Gatem cultivar and it was
followed by Spring Pea 3-638 (30.2%), Ürünlü and Gölyazı (30.6%) genotypes.
The highest ADF ratio (39.8%) was obtained from Spring cultivar. Considering the ADF ratios of the years, the highest average value (35.6%) was observed in 2014 and the lowest average value (33.7%) was observed in 2015. Two-year average ADF ratio of the genotypes was calculated as 34.6%.
As the average of two years, the lowest NDF ratios were obtained from Gatem (39.1%) and Gölyazı (41.2%) cultivars. They were followed by Ürünlü (42.3%) and Spring Pea 3-638 (42.3%) genotypes which were placed in the same statistical group.
The highest NDF ratio (51.2%) was obtained from Spring cultivar. Considering the NDF ratios of the years, the highest average value (47.4%) was observed in 2014 and the lowest average value (45.0%) was observed in 2015. Two-year average NDF ratio of the genotypes was calculated as 46.2%.
Table 4. ADF and NDF ratios of forage pea genotypes
ADF (%) NDF (%)
No Genotypes 2014 2015 Average 2014 2015 Average
1 88 PO38-4-3-683 38.0 bcd 33.4 ef 35.7 bc 52.5 a 44.5 de 48.5 abc 2 Spring PEA 3-638 33.7 e 26.7 h 30.2 d 46.0 c 38.5 h 42.3 de 3 P57B 38.7 abc 33.9 e 36.3 ab 50.8 ab 44.0 e 47.4 bc 4 P51 37.4 cd 34.1 de 35.8 bc 47.7 bc 45.6 cd 46.6 bc 5 P101 36.1 cde 35.6 c 35.9 bc 46.1 c 45.4 cde 45.7 cd 6 P104 37.4 cd 27.6 h 32.5 cd 49.3 abc 44.4 de 46.9 bc 7 Atos 37.9 bcd 32.6 f 35.2 bc 52.0 a 44.4 de 48.2 abc 8 Özkaynak 34.9 de 42.0 a 38.5 ab 47.9 bc 52.5 a 50.2 ab
9 Retna 37.1 cde 35.0 cd 36.1 bc 50.7 ab 45.3 cde 48.0 abc
10 Gatem 101 28.3 f 30.7 g 29.5 d 37.7 d 40.5 g 39.1 e 11 Spring 41.1 ab 38.5 b 39.8 a 53.0 a 49.4 b 51.2 a 12 Bolero 41.7 a 34.4 de 38.0 ab 51.7 a 46.0 c 48.9 abc 13 Ürünlü 27.0 f 34.1 de 30.6 d 37.8 d 46.7 c 42.3 de 14 Gölyazı 28.5 f 32.7 f 30.6 d 40.2 d 42.1 f 41.2 e Average 35.6 A 33.7 B 34.6 47.4 A 45.0 B 46.2 ** = 1% significant ** ** ** ** ** ** CV (%) 6.00 1.89 9.20 4.85 1.94 6.96
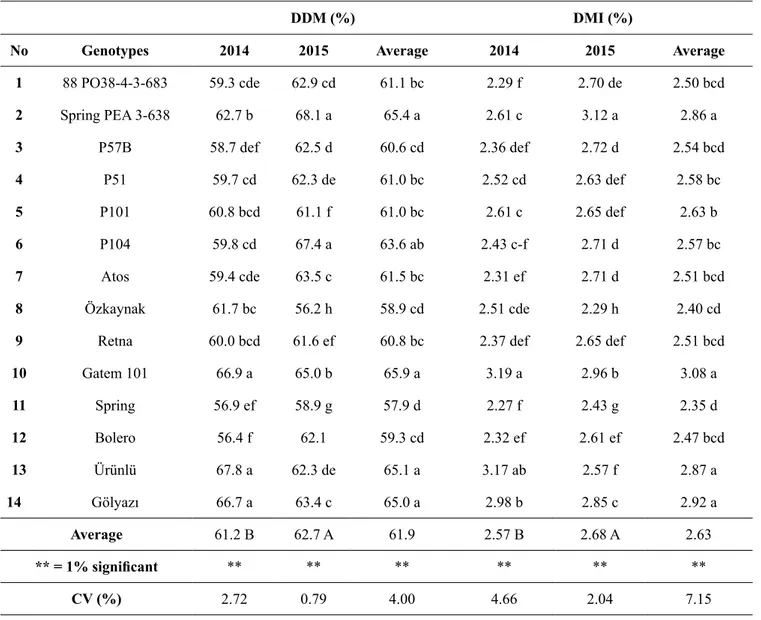
Digestible dry matter and dry matter intake (%) Digestible dry matter (DDM) and dry matter intake (DMI) values of forage pea genotypes are provided in Table 5. The differences in DDM and DMI values of the genotypes and the years and the differences within the same year were all found to be significant (p<0.01).
As the average of two years, the highest DDM ratios were obtained from Gatem (65.9%), Spring Pea
3-638 (65.4%), Ürünlü (65.1%) and Gölyazı (65.0) genotypes. They were followed by P104 (63.6%) genotype which was placed in the same statistical group. The lowest DDM ratio (57.9%) was obtained from Spring cultivar. Considering the DDM ratios of the years, the highest average value (62.7%) was observed in 2015 and the lowest average value (61.2%) was observed in 2014. Two-year average DDM ratio of the forage pea genotypes was calculated as 61.9%.
Table 5. DDM and DMI ratios of forage pea genotypes
DDM (%) DMI (%)
No Genotypes 2014 2015 Average 2014 2015 Average
1 88 PO38-4-3-683 59.3 cde 62.9 cd 61.1 bc 2.29 f 2.70 de 2.50 bcd 2 Spring PEA 3-638 62.7 b 68.1 a 65.4 a 2.61 c 3.12 a 2.86 a 3 P57B 58.7 def 62.5 d 60.6 cd 2.36 def 2.72 d 2.54 bcd 4 P51 59.7 cd 62.3 de 61.0 bc 2.52 cd 2.63 def 2.58 bc 5 P101 60.8 bcd 61.1 f 61.0 bc 2.61 c 2.65 def 2.63 b 6 P104 59.8 cd 67.4 a 63.6 ab 2.43 c-f 2.71 d 2.57 bc 7 Atos 59.4 cde 63.5 c 61.5 bc 2.31 ef 2.71 d 2.51 bcd 8 Özkaynak 61.7 bc 56.2 h 58.9 cd 2.51 cde 2.29 h 2.40 cd
9 Retna 60.0 bcd 61.6 ef 60.8 bc 2.37 def 2.65 def 2.51 bcd
10 Gatem 101 66.9 a 65.0 b 65.9 a 3.19 a 2.96 b 3.08 a 11 Spring 56.9 ef 58.9 g 57.9 d 2.27 f 2.43 g 2.35 d 12 Bolero 56.4 f 62.1 59.3 cd 2.32 ef 2.61 ef 2.47 bcd 13 Ürünlü 67.8 a 62.3 de 65.1 a 3.17 ab 2.57 f 2.87 a 14 Gölyazı 66.7 a 63.4 c 65.0 a 2.98 b 2.85 c 2.92 a Average 61.2 B 62.7 A 61.9 2.57 B 2.68 A 2.63 ** = 1% significant ** ** ** ** ** ** CV (%) 2.72 0.79 4.00 4.66 2.04 7.15
As the average of two years, the highest DMI ratios were obtained from Gatem (3.08%), Gölyazı (2.92%), Ürünlü (2.87%) and Spring Pea 3-638 (2.86%) genotypes. The lowest DMI ratio (2.35%) was obtained from Spring cultivar. Considering
the DMI ratios of the years, the highest average value (2.68%) was observed in 2015 and the lowest average value (2.57%) was observed in 2014. Two-year average DMI value of the forage pea genotypes was calculated as 2.63%.
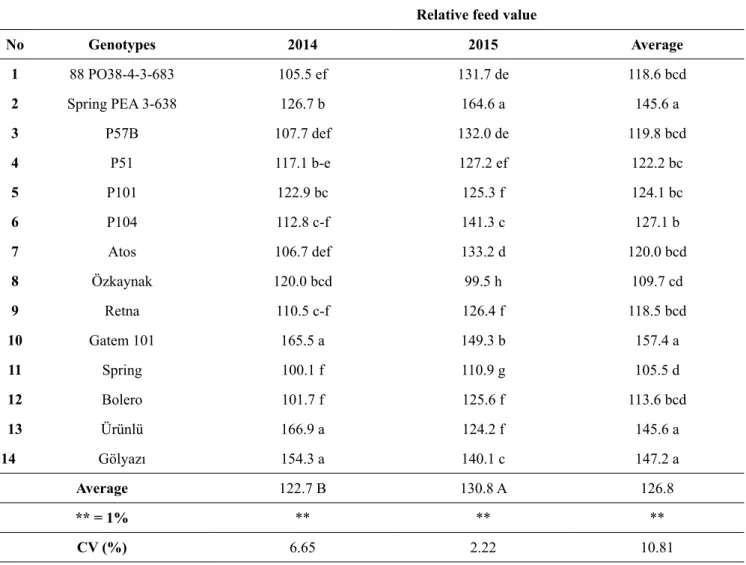
Relative feed value (RFV)
Relative feed values of forage pea genotypes are provided in Table 6. The differences in RFV of the genotypes and the years and the differences within the same year were found to be significant (p<0.01).
The highest RFV was obtained from Gatem (157.4), Gölyazı (147.2), Ürünlü and Spring Pea 3-638 (145.6)
genotypes. The lowest RFV (105.5) was obtained from Spring cultivar.
Considering the RFV of the years, the highest average RFV (130.8) was observed in 2015 and the lowest average RFV (122.7) was observed in 2014. Two-year average RFV of the forage pea genotypes was calculated as 126.8.
Table 6. Relative feed value of forage pea genotypes
Relative feed value
No Genotypes 2014 2015 Average 1 88 PO38-4-3-683 105.5 ef 131.7 de 118.6 bcd 2 Spring PEA 3-638 126.7 b 164.6 a 145.6 a 3 P57B 107.7 def 132.0 de 119.8 bcd 4 P51 117.1 b-e 127.2 ef 122.2 bc 5 P101 122.9 bc 125.3 f 124.1 bc 6 P104 112.8 c-f 141.3 c 127.1 b 7 Atos 106.7 def 133.2 d 120.0 bcd 8 Özkaynak 120.0 bcd 99.5 h 109.7 cd 9 Retna 110.5 c-f 126.4 f 118.5 bcd 10 Gatem 101 165.5 a 149.3 b 157.4 a 11 Spring 100.1 f 110.9 g 105.5 d 12 Bolero 101.7 f 125.6 f 113.6 bcd 13 Ürünlü 166.9 a 124.2 f 145.6 a 14 Gölyazı 154.3 a 140.1 c 147.2 a Average 122.7 B 130.8 A 126.8 ** = 1% ** ** ** CV (%) 6.65 2.22 10.81
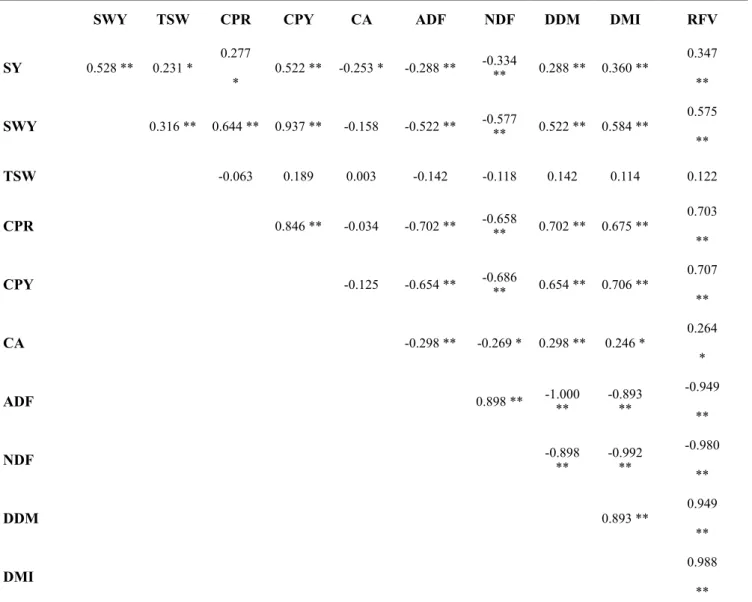
Correlations among the investigated traits Simple correlations identified among the investigated traits of forage pea genotypes are provided in Table 7. As it can be seen from Table 7, seed yield had highly significant positive correlations with straw yield, crude protein yield, DDM, DMI and RFV; significant positive correlations with thousand seed weight and crude protein ratio; significant negative correlations with crude ash and highly significant negative correlations with ADF and NDF.
Straw yield had highly significant positive correlations with thousand seed weight, crude protein ratio, crude protein yield, DDM, DMI and RFV; highly significant negative correlations with ADF and NDF. Crude protein ratio had highly significant positive correlations with crude protein yield, DDM, DMI and RFV; highly significant negative correlations with ADF and NDF. Crude protein yield had highly significant negative correlations with ADF and NDF; highly significant positive correlations with DDM,
DMI and RFV. Crude ash ratio had highly significant positive correlations with DDM; significant positive correlations with DMI and RFV; highly significant
negative correlations with ADF and significant negative correlations with NDF.
Table 7. Correlation coefficients among the investigated traits +
SWY TSW CPR CPY CA ADF NDF DDM DMI RFV
SY 0.528 ** 0.231 * 0.277 * 0.522 ** -0.253 * -0.288 ** -0.334 ** 0.288 ** 0.360 ** 0.347 ** SWY 0.316 ** 0.644 ** 0.937 ** -0.158 -0.522 ** -0.577 ** 0.522 ** 0.584 ** 0.575 ** TSW -0.063 0.189 0.003 -0.142 -0.118 0.142 0.114 0.122 CPR 0.846 ** -0.034 -0.702 ** -0.658 ** 0.702 ** 0.675 ** 0.703 ** CPY -0.125 -0.654 ** -0.686 ** 0.654 ** 0.706 ** 0.707 ** CA -0.298 ** -0.269 * 0.298 ** 0.246 * 0.264 * ADF 0.898 ** -1.000 ** -0.893 ** -0.949 ** NDF -0.898 ** -0.992 ** -0.980 ** DDM 0.893 ** 0.949 ** DMI 0.988 **
+) Correlation coefficients for the years 2014 and 2015, * = significant at 5% level, ** = Significant at 1% level, SY: Seed Yield, SWY: Straw Yield, TSW: Thousand Seed Weight, CPR: Crude Protein Ratio, CPY: Crude Protein Yield, CA: Crude Ash
ADF had highly significant positive correlations with NDF; highly significant negative correlations with DDM, DMI and RFV. NDF had highly significant negative correlations with DDM, DMI and RFV. DDM had highly significant positive correlations with DMI and RFV and DMI had highly significant positive correlations with RFV.
CONCLUSION
As the average of two years, the highest seed and straw yield was obtained from Gatem, the highest thousand seed weight was obtained from Atos and P101, the lowest crude ash ratio was obtained from P57B, Gatem, 88 PO38-4-3-683, the highest crude protein ratio was obtained from Gatem, Ürünlü, Gölyazı, Spring Pea 3-638 and 88 PO38-4-3-683, the highest crude
REFERENCES
Acar Z, Ayan İ, 2012. Yem Bitkileri Kültürü. Ondokuz Mayıs Üniversitesi, Ziraat Fakültesi Ders Kitabı No:2.
Açıkgöz E, 2001. Yem Bitkileri. Uludağ Üniversitesi, Ziraat Fakültesi Tarla Bitkileri Bölümü, Uludağ Üniversitesi Güçlendirme Vakfı, No: 182, 95 s.
Açıkgöz E, 2013. Yem Bitkileri Yetiştiriciliği. Süt Hayvancılığı Eğitim Merkezi Yayınları Hayvancılık Serisi, Yayın No:8. AOAC, 1990. Association of Official Analytical Chemists. Official
Method of Analysis. 15th.ed. Washington, DC. USA. 66 p. Avcıoğlu R, Hatipoğlu R, Karadağ Y, 2009. Baklagil Yem Bitkileri,
Cilt II. Tarım ve Köyişleri Bakanlığı, Tarımsal Üretim ve Geliştirme Genel Müdürlüğü, İzmir.
Bilgili U, Açıkgöz E, 1999. Değişik yaprak özelliklerine sahip yakın izogenik yem bezelyesi hatlarının önemli morfolojik ve tarımsal özellikleri üzerinde araştırmalar. Türkiye 3. Tarla Bitkileri Kongresi, 15-18 Kasım 1999, Adana.
Karaköy T, Demirbaş A, Yörük V, Toklu F, Baloch FS, Ton A, Anlarsal AE, Özkan H, 2016. Sivas ekolojik koşullarında
soğuğa dayanıklı bezelye (Pisum sativum ssp. sativum L. and
spp. arvense L.) genotiplerinin belirlenmesi. Tarla Bitkileri
Merkez Araştırma Enstitüsü Dergisi, 25(Özel sayı): 171-176. Karaman MR, 2012. Bitki Besleme. Gübretaş Rehber Kitaplar
Dizisi:2. Editör: Zengin M, Toprak ve Bitki Analiz Sonuçlarının Yorumlanmasında Temel İlkeler (Bölüm 12), 874 s.
Manga İ, Acar Z, Ayan İ, 2003. Baklagil Yem Bitkileri. Ondokuz Mayıs Üniversitesi, Ziraat Fakültesi, Ders Kitabı No:7. Morrison JA, 2003. Hay and Pasture Management, Chapter 6.
Illinois Agronomy Handbook, 72 p.
Sayar MS, Anlarsal AE, 2008. Diyarbakır ekolojik koşullarında bazı
yem bezelyesi (Pisum arvense L.) hat ve çeşitlerinin verim ve
verim öğelerinin belirlenmesi üzerine bir araştırma. Ç.Ü. Fen Bilimleri Enstitüsü, 17 (4): 78-88.
Sayar MS, Anlarsal AE, Açıkgöz E, Başbağ M, Gül İ, 2009.
Diyarbakır koşullarında bazı yem bezelyesi (Pisum arvense
L.) hatlarının verim ve verim unsurlarının belirlenmesi. Türkiye VIII. Tarla Bitkileri Kongresi, 19-22 Ekim 2009, Hatay.
Sezen Y, 1995. Gübreler ve Gübreleme. Atatürk Üniversitesi yayınları No: 679, Ziraat Fakültesi Yayınları No: 303, Erzurum, 15 s.
Tan M, Koc A, Dumlu Gul Z, 2012. Morphological characteristics
and seed yield of East Anatolian local forage pea (Pisum
sativum ssp. arvense L.) ecotypes. Turkish Journal of Field
Crops, 17(1): 24-30.
Timurağaoğlu KA, Genç A, Altınok S, 2004.Ankara koşullarında yem bezelyesi hatlarında yem ve tane verimleri. Tarım Bilimleri Dergisi, 10(4): 457-461.
Toğay N, Toğay Y, Erman M, Yıldırım B, 2006. Kışlık iki bezelye
hattı (Pisum sativum ssp. arvense L.)’nda farklı bitki
sıklıklarının bazı tarımsal özellikler üzerine etkisi. Yüzüncü Yıl Üniversitesi, Ziraat Fakültesi, Tarım Bilimleri Dergisi, 16 (2): 97-103.
Uzun A, Gün H, Açıkgöz E, 2012. Farklı gelişme dönemlerinde
biçilen bazı yem bezelyesi (Pisum sativum L.) çeşitlerinin ot,
tohum ve ham protein verimlerinin belirlenmesi. U.Ü. Ziraat Fakültesi Dergisi, 26(1): 27-38.
Van Soest PJ, Robertson JB, Lewis BA, 1991. Methods for dietary fiber, neutral detergent fiber and non-starch polysaccharides in relation to animal nutrition. J. Dairy Sci., 74: 3583-3597.
protein yield was obtained from Gatem genotypes. The lowest ADF and NDF ratios and the highest digestible dry matter content, dry matter intake and relative feed value were obtained from Gatem, Ürünlü, Gölyazı and Spring Pea 3-638 genotypes. Considering the above given outcomes, it was concluded that Gatem,
Ürünlü, Gölyazı and Spring Pea 3-638 genotypes were prominent with their superior characteristics. They had low ADF and NDF ratios and high crude protein, digestible dry matter, dry matter intake and relative feed values.