. . . .
. . . .
Prediction of elevated left ventricular filling
pressures in patients with preserved ejection
fraction using longitudinal deformation indices
of the left ventricle
†
Suzan Hatipog˘lu
1*
, Nihal O
¨ zdemir
1, Gamze Babu¨r Gu¨ler
2, Ruken Bengi Bakal
1,
Cetin Gec¸men
1, O
¨ zkan Candan
1, Cem Dog˘an
1, and Tuba Unkun
11
Department of Cardiology, Kartal Kosuyolu Heart Training and Research Hospital, Denizer Caddesi, Kartal/Istanbul 34846, Turkey; and2
Medipol University Hospital, Istanbul, Turkey Received 14 January 2015; accepted after revision 1 March 2015; online publish-ahead-of-print 20 April 2015
Aims Estimation of left ventricular (LV) filling pressures is a clinical challenge in patients with preserved ejection fraction (EF).
In the present study, we investigated whether LV and atrial longitudinal strain and strain rate (SR) parameters derived by speckle tracking echocardiography (STE) could be used to predict invasively measured LV end-diastolic pressure (LVEDP) in this patient population.
Methods and results
LVEDP was measured before coronary angiography was performed in 65 patients with preserved EF (≥50%) referred to
elective cardiac catheterization; besides, patients enrolled underwent comprehensive echocardiographic examination before the procedure. In addition to conventional echocardiographic parameters used to evaluate diastolic function LV longitudinal strain and SR, as well as peak atrial longitudinal strain during LV systole, measurements were performed using STE. Only log-diastolic blood pressure, systolic SR, early diastolic SR, SR during isovolumetric relaxation (SRIVR), and mitral early diastolic flow velocity/SRIVR significantly correlated with LVEDP. When age-adjusted stepwise linear regression analysis was performed, SRIVRT values (b ¼ 220.682, t ¼ 23.292; P ¼ 0.002) and log-diastolic blood pressure levels (b ¼ 21.118, t ¼ 3.784; P , 0.001) were independently correlated with LVEDP.
Conclusion When compared with conventional echocardiographic parameters, other longitudinal strain, and SR indices, SRIVRT independently predicted LVEDP in conjunction with log diastolic blood pressure. We suggest that SRIVRT is a valuable parameter to evaluate diastolic function in patients with preserved EF.
-Keywords Speckle tracking echocardiography † Diastolic dysfunction † Left ventricular end-diastolic pressure † Left ventricular longitudinal strain
Introduction
Heart failure with preserved ejection fraction (HFpEF) is a prevalent and growing public health problem associated with significant
morbid-ity and mortalmorbid-ity. HFpEF currently accounts for≥50% of the general
heart failure population.1Impairment in left ventricular (LV) diastolic
function has been proposed as a key pathophysiologic mediator.2,3
To be able to diagnose diastolic dysfunction, non-invasive estimation
of LV filling pressures is a clinical requisite.4The estimation of LV
filling pressures in patients with normal ejection fraction (EF) is more
challenging than in those with depressed EF. LV filling index E/E′with
its wide borderline values has also some limitations in the diagnosis of diastolic function particularly when left atrial (LA) pressure is
low.5–8This involves clinical circumstances like young patients with
borderline symptoms and risk factors for diastolic dysfunction. Recently, several investigations have highlighted the key role of the longitudinal diastolic function of the LV in the pathophysiology of HFpEF, also suggesting that in patients with diastolic dysfunction
†The study was conducted in the Cardiology Department of Kartal Kosuyolu Heart and Research Hospital.
*Corresponding author. Tel:+90 5325870062; Fax: +90 216 4596321. Email: [email protected]
Published on behalf of the European Society of Cardiology. All rights reserved.&The Author 2015. For permissions please email: [email protected].
the myocardial systolic function of the LV is not preserved. Myocardial strain and strain rate (SR) were recently introduced as echocardiographic parameters for quantification of diastolic func-tion. LV diastolic SR signals can be recorded during early filling (SRE), late diastole (SRA), and isovolumetric relaxation (SRIVR). The ratio of early mitral flow (E) to SRIVR predicted LV filling
pres-sure in patients in whom the E/e′ratio was inconclusive and was
more accurate than the E/e′ratio in patients with normal EF and
those with regional dysfunction.12Additionally, peak LA longitudinal
strain (PALS, peak atrial longitudinal strain) during LV systole was
also presented as a new index of diastolic function.13
The evaluation of diastolic function by deformation imaging is promising, but needs more study of its incremental clinical value. Therefore, longitudinal deformational parameters of LV and LA, detected by speckle tracking echocardiography (STE), and conven-tional echocardiographic indicators of diastolic dysfunction were compared in our study to predict invasively measured LVEDP in a patient population with preserved EF (.50%).
Methods
Our patient population consisted of 65 patients with preserved EF who underwent elective cardiac catheterization for the diagnosis of coronary artery disease or re-evaluation after coronary intervention. Patients were excluded if they had non-sinus rhythm, more than mild aortic and mitral regurgitation or stenosis, LV systolic dysfunction (EF ,50%), acute coronary syndrome, renal failure, or prosthetic mitral valve. One hundred and two consecutive patients referred to catheter-ization from outpatient clinic were evaluated and 65 of them were included. These patients underwent comprehensive echocardiographic examination≤15 min before cardiac catheterization and measurement of LVEDP was also performed in addition to conventional coronary angiography. The study was approved by the institutional ethical commit-tee of Kartal Kosuyolu Heart Training and Research Hospital; oral and written informed consent was obtained from all study participants.
Risk factors
Arterial hypertension was defined as blood pressure of .140/90 mmHg or in patients receiving anti-hypertensive therapy. Diabetes mellitus was defined as a fasting blood glucose level of .126 or .200 mg/dL 2 h after an oral glucose tolerance test or in patients receiving permanent medical anti-diabetic therapy. Hyperlipidaemia was defined as blood total cholesterol levels of .180 mg/dL or low-density lipoprotein of .130 mg/dL or when patients were receiving permanent treatment with lipid-lowering agents. Coronary artery disease was defined as a history of myocardial infarction, coronary artery disease bypass grafting, percutaneous coronary intervention, or an angiographic evidence of a significant coronary artery stenosis (≥50%).
Conventional echocardiographic examination
All echocardiographic examinations were performed before the patient was admitted to cardiac catheterization laboratory, using a com-mercially available system (iE 33, Philips, Bothel, USA) equipped with an S5-1 probe and recorded for offline analysis (Xcelera Workstation and QLAB; Advanced Quantification Software V.8.1, Philips). Individuals were instructed to hold their breath, and images were coupled with electrocardiographic recordings. Measurements were done offline later by a single investigator who was blinded to the clinical and cath-eterization data.
M-mode measurements were performed according to the criteria of the European Association of Cardiovascular Imaging. Three consecutive cycles were averaged for every parameter. LA dimension and LV end-systolic (LVESD) and end-diastolic diameters were measured. LV ejection fraction was estimated by biplane Simpson’s rule. Maximum LA volume was calculated at end-systole of the left ventricle using the biplane Simp-son’s method and indexed to BSA.14Early (E) and late (A) wave velocities, E/A ratio, and E deceleration time (DT) were measured from the mitral inflow profile. Isovolumetric relaxation time (IVRT) was also measured using pulsed-wave Doppler using previously validated and recommended methods.7To acquire tissue Doppler imaging data, the Nyquist limit was set at 15 – 20 cm/s, and minimal optimal gain was used. The myocardial systolic (S′), early diastolic (E′), and late diastolic (A′) velocities were obtained at the septal and lateral mitral annulus by placing a sample volume. The E/E′ratio was subsequently calculated for septal and lateral measurements; besides, it was also averaged. Mitral regurgitation severity was semiquantified from none to severe based on integrated assessment. LV diastolic dysfunction was classified accord-ing to previously defined standard criteria as normal (DT ¼ 160 – 240 ms, E/A ratio ¼ 0.9 – 1.5, E′≥ 10 cm/s), impaired relaxation; grade I (DT . 240 ms, E/A ratio , 0.9, E′, 10 cm/s), pseudonormalized pattern; grade II (DT ¼ 160– 240 ms, E/A ratio ¼ 0.9– 1.5, E′, 8 cm/s) and restrictive pattern; grade III (DT , 160 ms, E/A ratio . 2.0, E′, 5 cm/s).7
Speckle tracking imaging
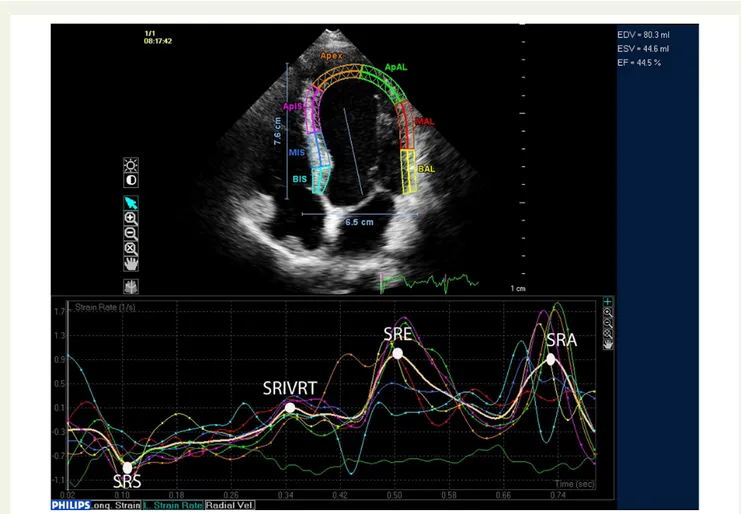
For speckle tracking analysis, three cycles were recorded at a frame rate of≥45 fps, and were averaged for strain analysis. Aortic valve opening and closing times were measured from the LV outflow Doppler profile and were incorporated in the speckle tracking strain profile in order to exclude post-systolic components. From three manually selected land-mark points (lateral and septal mitral annulus and LV apex) in apical views, LV endocardial borders were automatically detected by the soft-ware. Subsequently, automatic tracking of myocardial speckles was per-formed throughout the whole cardiac cycle. Manual corrections of the border tracings were avoided as far as possible. Global longitudinal strain (GLS) and SR curves were obtained for apical four-chamber, three-chamber, and two-chamber views; subsequently, the software (Q LAB V8.1 application for two-dimensional strain analysis) provided LV model consisting of all segments. Systolic GLS was obtained by averaging peak longitudinal strain of 17 segments (Figure1). Similarly, peak global SR during systole (SRS), SRE, SRA, and during SRIVR were determined (Figure2). E/SRIVR was also calculated.
Two-dimensional echocardiographic images for the LA were obtained from the apical four-chamber and two-chamber views. From three manually selected landmark points (lateral and septal mitral annulus and LA apex), endocardial borders were automatically detected by the software. Myocardial speckles were tracked automatically throughout the cardiac cycle and typical LA strain curves were obtained for each patient. A peak LA strain value during LV systole was measured in apical four and two-chamber images. Then measurements from these two views were averaged to obtain the peak atrial longitudinal strain (PALS) value for the index patient.
Cardiac catheterization
Cardiac catheterization was performed after the echocardiographic image acquisition was completed. During catheterization, heart rate and blood pressure were continuously monitored. In all patients, a fluid-filled 6-F pigtail catheter was inserted percutaneously from the right femoral artery and advanced to the LV. Before the contrast agent was injected into the coronary arteries, the LV pressure was obtained. After 10
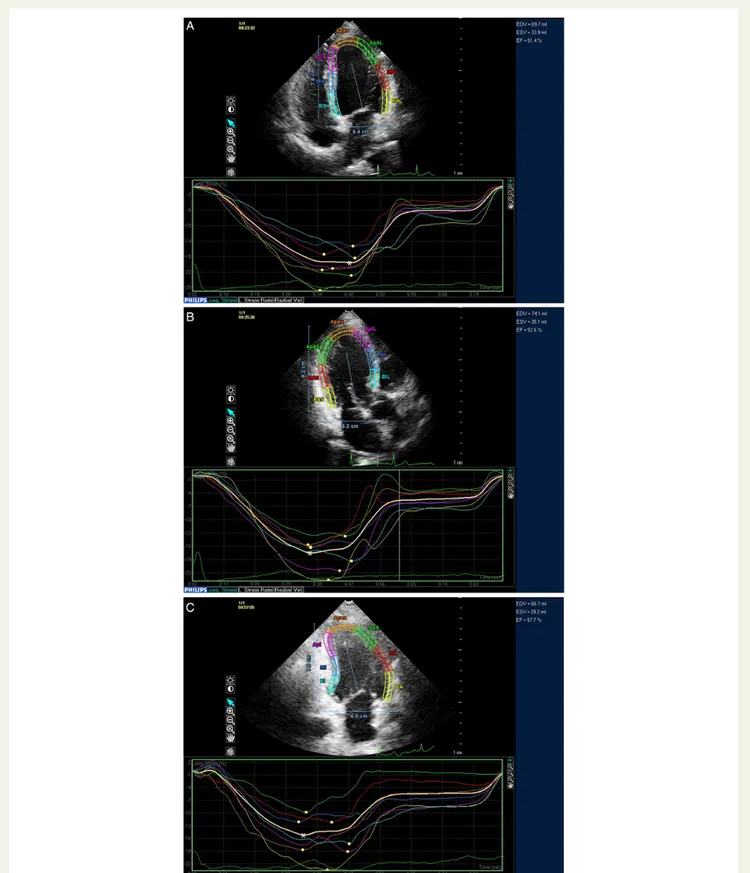
Figure 1 GLS measurement. The asterisk in (A) shows the average of peak strain values obtained from apical four-chamber view segments. Like-wise, (B and C) show the average values obtained from each segment in three-chamber and two-chamber views, respectively. The GLS was obtained by averaging the values obtained from each view in a 17-segment model representation of the left ventricle provided by the software. The yellow dots represent peak systolic longitudinal strain of individual segments analysed in the 17-segment left ventricle model.
consecutive beats were recorded, the measurement of LVEDP was made at the peak of R-wave on electrocardiography and average of measure-ments made for five consecutive beats was recorded as LVEDP for the index patient.
Statistical analysis
The data were presented as mean + SD for continuous variables and as percentage for categorical variables. For normality and homogeneity of data, Kolmogorov – Smirnov test was used. Diastolic blood pressure levels, E/SRIVR, IVRT, and LVESD had skewed distribution; therefore, data were log-transformed. The Pearson’s correlation analysis was used to test the possible associations between LVEDP and the study vari-ables. Prediction of independent variables was obtained by a stepwise linear regression model including potential confounders. The coefficient of determination (R2) and adjusted coefficient of determination (R2
a) were
evaluated to control the power of model.
The intraclass correlation coefficient (ICC) and its 95% CI were used to assess intraobserver reliability for the first echocardiographer. Cron-bach’sawas used to evaluate internal consistency. The interobserver reliabilities were assessed by Bland and Altman plots.
A P-value of ,0.05 was considered statistically significant. Statistical analysis was performed using the MedCalc 13 Software (Mariakerke, Belgium).
Results
One hundred and two consecutive patients referred for catheteriza-tion were evaluated; 8 patients were excluded for more than mild valvular disease, 6 for having AF, 12 had LV systolic dysfunction, and 11 were excluded for having insufficient echocardiographic images. The indication for catheterization was stable angina pectoris in 36 (55%) patients, myocardial ischaemia detected by stress imaging in 20 (31%) patients, and exercise electrocardiography test positivity in 9 (14%) patients. Mean age of the 65 (29 females and 36 males) patients enrolled was 57 + 9.5 years. Patients’ clinical char-acteristics and data from echocardiographic examination are
pre-sented in Table1. Mean LVEDP of patients was 16 + 3.9 mmHg.
Sixteen patients (24.6%) had a normal diastolic filling pattern, 40 (61%) patients had impaired relaxation (Grade I), and 9 (13.8%) patients had pseudonormalized pattern (Grade II). All of our patients had NHYA functional class I or II symptoms.
Among the non-invasive parameters analysed in our study, only systolic and log-diastolic blood pressure, SRS, SRE, SRIVR, and E/SRIVR were significantly correlated with LVEDP. Correlation coef-ficients for these parameters are presented in Table2. Examples of SR curves for individual patients with normal and elevated filling Figure 2 An example of SR measurement from the apical four-chamber view. The final values were obtained by averaging the corresponding measurements from apical four-chamber, two-chamber, and three-chamber views. SRS, systolic strain rate; SRIVRT, strain rate during isovolumetric relaxation; SRE, strain rate during early diastole; SRA, strain rate during atrial filling.
pressures are also provided in Figure3. E/E′was not correlated with LVEDP in our patient population (r ¼ 0.133; P ¼ 0.292).
Age-adjusted stepwise linear regression analysis was performed; while LVEDP was regarded as a dependent variable, log-diastolic blood pressure and other study variables including SRS, SRE,
SRIVRT, and age were assumed as independent variables (Table3).
We found that only SRIVRT values (b ¼ 220.682, t ¼ 23.292; P ¼ 0.002) and log-diastolic blood pressure levels (b ¼ 21.118,
t ¼ 3.784; P , 0.001) were independently correlated with LVEDP. Although systolic blood pressure levels were correlated with LVEDP, they were not included in the regression analysis because they were strongly correlated with diastolic blood pressure. The re-lationship between LVEDP and SRIVR is shown by using a scatter plot
representation in Figure4.
Reliability analysis
Reproducibility of strain measurements was assessed in 25 randomly selected patients. GLS, SRS, SRE, and SRIVR were re-measured by the original reader and a second echocardiographer who was blinded to the first measure. For intraobserver reliability, ICCs were significant for GLS 0.848 (0.655 – 0.937), SRS 0.975 (0.939 – 0.990), SRE 0.882 (0.727 – 0.952), and SRIVR 0.930 (0.832 – 0.972). The interobserver agreements for the same measurements were assessed by Bland and Altman plots. Bland – Altman plotting of the two echocardiographers’ results was within the correlation limits
of 1.96 (95% confidence interval; Figure5).
Discussion
LV global longitudinal SR parameters, except SRA, correlated signifi-cantly with LVEDP in conjunction with systolic and log-diastolic blood pressure in patients with preserved EF. The present study showed that SRIVR measured by STE and log-diastolic blood pressure are independent predictors of LVEDP in this patient population. To the best of our knowledge, this is the first study comparing invasively mea-sured filling pressures and GLS, SR parameters, as well PALS in patients with preserved EF and various degrees of diastolic function.
STE is a sensitive tool to evaluate myocardial mechanics and it is independent from translational motion and other through-plane motion effects in contrast to myocardial velocities. Data regarding accuracy, validity, and clinical application of STE are rapidly
accumulat-ing.15,16Since the endocardium is most susceptible to the deleterious
effects of interstitial fibrosis and hypoperfusion, the abnormal longi-tudinal function can be detected at an earlier stage by examining
sub-endocardial function, by means of GLS and SR measurements.12,17
Direct measurement of LV filling pressures with cardiac catheteriza-tion is the gold standard to determine the extent of diastolic
dysfunc-tion.3There are currently no unified criteria specified in the major
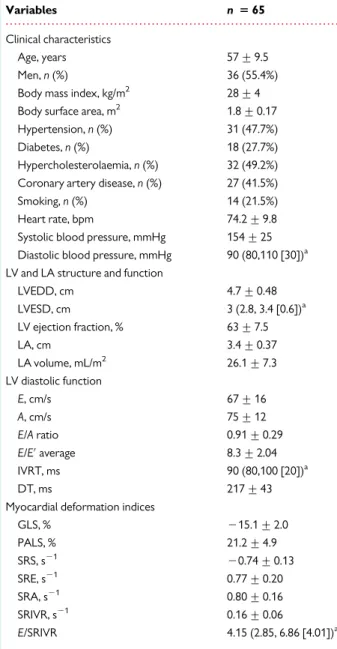
. . . . Table 1 Clinical, echocardiographic, and laboratory characteristics of the study population
Variables n 5 65
Clinical characteristics
Age, years 57 + 9.5
Men, n (%) 36 (55.4%) Body mass index, kg/m2 28 + 4 Body surface area, m2 1.8 + 0.17 Hypertension, n (%) 31 (47.7%) Diabetes, n (%) 18 (27.7%) Hypercholesterolaemia, n (%) 32 (49.2%) Coronary artery disease, n (%) 27 (41.5%) Smoking, n (%) 14 (21.5%) Heart rate, bpm 74.2 + 9.8 Systolic blood pressure, mmHg 154 + 25 Diastolic blood pressure, mmHg 90 (80,110 [30])a LV and LA structure and function
LVEDD, cm 4.7 + 0.48 LVESD, cm 3 (2.8, 3.4 [0.6])a LV ejection fraction, % 63 + 7.5 LA, cm 3.4 + 0.37 LA volume, mL/m2 26.1 + 7.3 LV diastolic function E, cm/s 67 + 16 A, cm/s 75 + 12 E/A ratio 0.91 + 0.29 E/E′average 8.3 + 2.04 IVRT, ms 90 (80,100 [20])a DT, ms 217 + 43
Myocardial deformation indices
GLS, % 215.1 + 2.0 PALS, % 21.2 + 4.9 SRS, s21 20.74 + 0.13 SRE, s21 0.77 + 0.20 SRA, s21 0.80 + 0.16 SRIVR, s21 0.16 + 0.06 E/SRIVR 4.15 (2.85, 6.86 [4.01])a
LVEDD, indicates left ventricular end-diastolic diameter; LVESD, left ventricular end-systolic diameter; LV, left ventricle; LA, left atrium; E, mitral early diastolic inflow; A, mitral late diastolic inflow; E′, early diastolic mitral annular velocity; IVRT; isovolumetric relaxation time; DT; deceleration time of mitral inflow; GLS, global longitudinal strain; PALS, peak left atrial systolic strain; SRS, systolic strain rate; SRE, early diastolic strain rate; SRA, late diastolic strain rate; SRIVR, strain rate during isovolumetric relaxation.
a
Median (25th, 75th percentile [interquartile range]) was used for variables that were not distributed normally.
. . . . Table 2 Correlation of LVEDP with echocardiographic and clinical findings
Variable r p
Systolic blood pressure 0.364 0.003 Log-diastolic blood pressure 0.463 ,0.001
SRS 0.249 0.045
SRE 20.256 0.040
SRIVR 20.420 ,0.001
Log-E/SRIVR 0.300 0.015
SRS, systolic strain rate; SRE, early diastolic strain rate; SRIVR, strain rate during isovolumetric relaxation; E, early diastolic mitral inflow.
guidelines for diagnosing diastolic dysfunction in patients with
pre-served EF. The value of the E/E′ ratio as a reliable estimate of LV
filling pressures was endorsed by European and American consensus
statements on diastolic HF and diastolic LV dysfunction.3,7However,
the existence of a ‘grey zone’ between 8 and 13 represents a limitation
for the application of E/E′ratio in clinical practice.18This may be
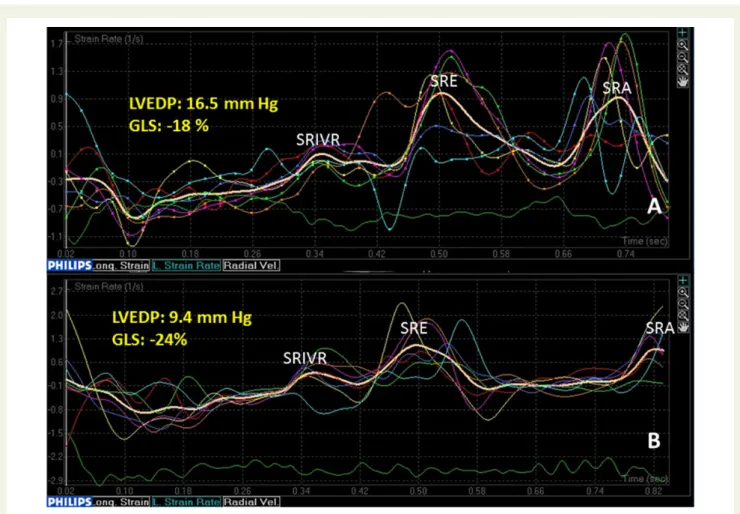
par-ticularly relevant among patients with normal EF, for whom the Figure 3 Comparison of SR curves from an index patient with elevated LV end-diastolic pressure (A) and from a patient with normal filling pres-sures (B). The patient in (A) has an SRIVR value of 0.1 s21, GLS 218%, and LVEDP 16.5 mmHg. (B) The curves from a patient with an SRIVR value of 0.4 s21, GLS 224%, and LVEDP 9.4 mmHg. GLS, global longitudinal strain; LVEDP, LV end-diastolic pressure; SRIVRT, strain rate during
isovolu-metric relaxation; SRE, strain rate during early diastole; SRA, strain rate during atrial filling.
. . . . Table 3 Stepwise linear regression analysis data that were performed to determine independent predictors of LV end-diastolic pressure Variables Unstandardized coefficients t p Log-diastolic blood pressure 21.118 3.784 ,0.001 SRIVR 220.682 23.292 0.002 Age 20.012 20.117 0.907 SRE 20.127 21.141 0.258 SRS 0.171 1.648 0.104
SRE, early diastolic strain rate; SRIVR, strain rate during isovolumetric relaxation; SRS, systolic strain rate.
R2
: 0.575; adjusted R2
: 0.331; standard error of the estimate: 3.263.
Figure 4 The relationship between LVEDP (mmHg) and peak SR value (s21) during isovolumetric relaxation.
possibility of correctly estimating LV filling pressures is of key
import-ance for the diagnosis of heart failure with preserved EF. Mean E/E′of
our study population was in the ‘grey zone’ and patients enrolled had many risk factors for diastolic dysfunction. Therefore, we tested the re-liability of GLS and SR parameters for the prediction of LVEDP in
com-parison with E/E′and other conventional echocardiographic diastolic
indices.
Wang et al.12were first to suggest the use of global diastolic SR
for the assessment of LV relaxation and filling pressures. Consistent with our findings, they reported that global SRIVR derived by STE related well to haemodynamic indices of LV relaxation both in animal models and in patients. They also stated that SRE was also dependent on LV relaxation in humans and this association was weaker than that of SRIVR, which is parallel to our findings. In their study, E/SRIVR predicted LV filling pressures with reasonable
accur-acy, particularly in patients with an E/Earatio of 8 to 15, those with
normal EF, and those with regional dysfunction. However, in our patients, SRIVR was superior to E/SRIVR for the prediction of filling pressures. This may have resulted from the different patient popula-tions studied as they have also included patients with dilated cardio-myopathy and more than mild valvular disease. A number of variables other than LV diastolic function and filling pressures affect mitral inflow, including heart rate and rhythm, PR interval, cardiac output,
mitral annular size, and LA function. In patients with coronary artery disease or hypertrophic cardiomyopathy, in whom EF is preserved LV filling patterns have a U-shaped relation with LV diastol-ic function, with similar values seen in healthy normal subjects and
patients with cardiac disease.7A better predictive value of SRIVR
than E/SRIVR can be explained by this phenomenon. SRIVR was also reported to be a reliable parameter to assess invasively measured LV relaxation in patients with hypertrophic obstructive
cardiomyopathy.19
In contrary to our findings, Kasner et al. concluded that, in patients with HFpEF, STE is accurate in detecting increased LV stiffness, but is
not superior to E/E′. They also reported that, in patients with HFpEF,
SRIVR was reduced and SRE and SRA did not differ compared with controls. However, the patient populations studied are different in
these studies and in our study E/E′was not even correlated with
LVEDP. This is consistent with the data reported previously by
Pre-vitali et al.5, indicating that the mitral E/E′ratio is of limited clinical
value in patients without heart failure.
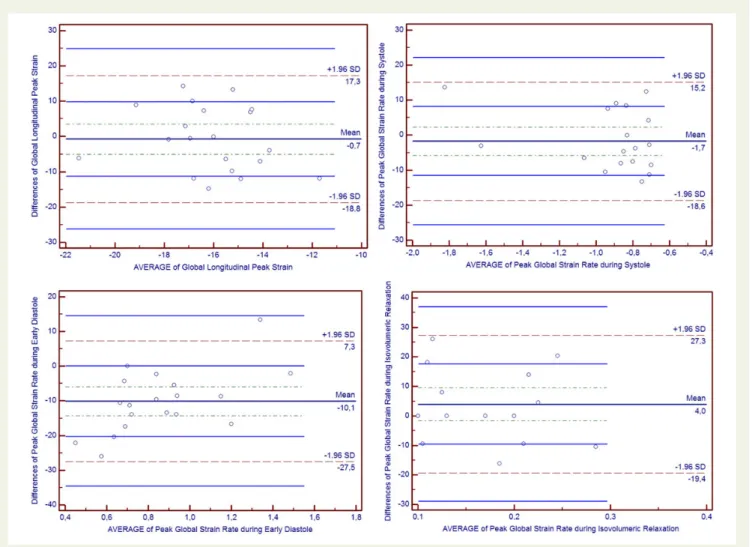
SRIVR occurs before the mitral valve opens and therefore is less de-pendent from load condition and chamber stiffness, and it is expected that SRIVR better reflects the intrinsic myocardial characteristics of the LV during early LV expansion. An SRE value is dependent on the balance between LV relaxation and LA pressure. In patients in whom Figure 5 Bland – Altman plots of LV GLS, SRS, SRIVRT and SRE.
myocardial expansion is delayed such that it occurs after the LA– LV pressure crossover, SRE is influenced mainly by LV relaxation. However, when it occurs earlier than this time point, it is affected as well by LA pressure. In that regard, SRE appears to have determinants
similar to those of E′.20
Consistent with previous studies, we found that SR during the late diastolic filling (SRA) was not related to LVEDP. In addition, we did not find significant correlation between PALS and LVEDP in our study, which was previously reported to correlate strongly and
nega-tively with invasively determined LVEDP.13However, the
popula-tions studied were different mainly in regard to LVEF.
Despite the fact that, in patients with diastolic dysfunction, the myo-cardial systolic function of the LV is not preserved, average values of GLS were lower than we would expect in a population with preserved
LVEF.9–11Patients enrolled had many risk factors for diastolic
dysfunc-tion like diabetes mellitus, hypertension, and coronary artery disease,
which may also have resulted in subclinical LV systolic dysfunction.21–23
In patients with diabetes mellitus, it was suggested that GLS deterior-ation proceeds and/or coexists with LV diastolic dysfunction as a
con-sequence of diabetic cardiomyopathy.23Possibly, other explanation
is that GLS reflects predominantly longitudinal motion which is affected more frequently and earlier in the evolution of diastolic dys-function; however, LVEF is more global or even more a reflection of
circumferential contraction.20
The main limitation of our study was the small size of the study population. This fact may explain to a certain extent the weak, although significant, correlations observed with some of the STE parameters. Besides, LVEDP was obtained using fluid-filled pigtail catheters. Although micromanometer-tipped catheters would have been ideal, our method used to measure LVEDP is standard in the clinical setting and well validated. The patients in this study were classified by LVEF and LV filling pressure, not enrolled according to clinical heart failure criteria. Therefore, this investigation was a study of the relation of myocardial mechanics to cardiac load. Our study could only detect cross-sectional relationships between the studied variables; long-term outcome studies are needed.
With the present study, we have demonstrated that SRIVR has an incremental value in patients with preserved EF for the estimation of LV filling pressures when compared with conventional echocardio-graphic parameters and recently suggested global longitudinal deform-ational indices of LV and LA (GLS, SRS, SRIVR, SRE, SRA, and PALS).
Authors’ contributions
S.H. and N.O. designed the study protocol; R.B.B. and S.H. performed data analysis/interpretation; S.H. and O.C. drafted the article; N.O. and C.G. critically revised the manuscript; G.B.G. and C.D. per-formed statistical analysis; data collection was perper-formed by S.H., T.U., C.D., C.G., and O.C.
Conflict of interest: The authors alone are responsible for the content and writing of paper.
References
1. Yancy CW, Jessup M, Bozkurt B, Butler J, Casey DE Jr, Drazner MH et al. 2013 ACCF/ AHA guideline for the management of heart failure: a report of the American College of Cardiology Foundation/American Heart Association Task Force on Practice Guidelines. J Am Coll Cardiol 2013;62:147 – 239.
2. Lam CS, Donal E, Kraigher-Krainer E, Vasan RS. Epidemiology and clinical course of heart failure with preserved ejection fraction. Eur J Heart Fail 2011;13:18 – 28. 3. Paulus WJ, Tschoepe C, Sanderson JE, Rusconi C, Flachskampf FA, Rademakers FE
et al. How to diagnose diastolic heart failure: a consensus statement on the diagnosis of heart failure with normal left ventricular ejection fraction by the Heart Failure Echocardiography Associations of the European Society of Cardiology. Eur Heart J 2007;28:2539 – 50.
4. Caruana L, Petrie MC, Davie AP, McMurray JJ. Do patients with suspected heart failure and preserved left ventricular systolic function suffer from ‘diastolic heart failure’ or from misdiagnosis? A prospective descriptive study. BMJ 2000;321:215 – 8. 5. Previtali M, Chieffo E, Ferrario M, Klersy C. Is mitral E/E′ratio a reliable predictor of left ventricular diastolic pressures in patients without heart failure? Eur Heart J Cardi-ovasc Imaging 2012;13:588 – 95.
6. Kasner M, Westermann D, Steendijk P, Gaub R, Wilkenshoff U, Weitmann K et al. Utility of Doppler echocardiography and tissue Doppler imaging in the estimation of diastolic function in heart failure with normal ejection fraction: a comparative Doppler-conductance catheterization study. Circulation 2007;116:637 – 47. 7. Nagueh SF, Appleton CP, Gillebert TC, Marino PN, Oh JK, Smiseth OA et al.
Recom-mendations for the evaluation of left ventricular diastolic function by echocardiog-raphy. Eur J Echocardiogr 2009;10:165 – 93.
8. Galderisi M, Rapacciuolo A, Esposito R, Versiero M, Schiano-Lomoriello V,
Santoro C et al. Site-dependency of the E/e′ratio in predicting invasive left
ventricu-lar filling pressure in patients with suspected or ascertained coronary artery disease. Eur Heart J Cardiovasc Imaging 2013;14:555 – 61.
9. Yip G, Wang M, Zhang Y, Fung JW, Ho PY, Sanderson JE. Left ventricular long axis function in diastolic heart failure is reduced in both diastole and systole: time for a redefinition? Heart 2002;87:121 – 5.
10. Yu CM, Lin H, Yang H, Kong SL, Zhang Q, Lee SW. Progression of systolic abnormal-ities in patients with ‘isolated’ diastolic heart failure and diastolic dysfunction. Circu-lation 2002;105:1195 – 201.
11. Aurigemma GP, Zile MR, Gaasch WH. Contractile behavior of the left ventricle in diastolic heart failure: with emphasis on regional systolic function. Circulation 2006; 113:296 – 304.
12. Wang J, Khoury DS, Thohan V, Torre-Amione G, Nagueh SF. Global diastolic strain rate for the assessment of left ventricular relaxation and filling pressures. Circulation 2007;115:1376 – 83.
13. Wakami K, Ohte N, Asada K, Fukuta H, Goto T, Mukai S et al. Correlation between left ventricular end-diastolic pressure and peak left atrial wall strain during left ven-tricular systole. J Am Soc Echocardiogr 2009;22:847 – 51.
14. Lang RM, Bierig M, Devereux RB, Flachskampf FA, Foster E, Pellikka PA et al. Recom-mendations for chamber quantification. Eur J Echocardiogr 2006;7:79 – 108. 15. Amundsen BH, Helle-Valle T, Edvardsen T, Torp H, Crosby J, Lyseggen E et al.
Non-invasive myocardial strain measurement by speckle tracking echocardiography: val-idation against sonomicrometryand tagged magnetic resonance imaging. J Am Coll Cardiol 2006;47:789 – 93.
16. Korinek J, Wang J, Sengupta PP, Miyazaki C, Kjaergaard J, McMahon E et al. Two-dimensional strain—a Doppler-independent ultrasound method for quantitation of regional deformation: validation in vitro and in vivo. J Am Soc Echocardiogr 2005; 18:1247 – 53.
17. Martinez DA, Guhl DJ, Stanley WC, Vailas AC. Extracellular matrix maturation in the left ventricle of normal and diabetic swine. Diabetes Res Clin Pract 2003;59:1 – 9. 18. Ommen SR, Nishimura RA, Appleton CP, Miller FA, Oh JK, Redfield MM et al. Clinical
utility of Doppler echocardiography and tissue Doppler imaging in the estimation of left ventricular filling pressures. A comparative simultaneous Doppler-catheterization study. Circulation 2000;102:1788 – 94.
19. Chen S, Yuan J, Qiao S, Duan F, Zhang J, Wang H. Evaluation of left ventricular dia-stolic function by global strain rate imaging in patients with obstructive hypertrophic cardiomyopathy: a simultaneous speckle tracking echocardiography and cardiac catheterization study. Echocardiography 2014;31:615 – 22.
20. Mor-Avi V, Lang RM, Badano LP, Belohlavek M, Cardim NM, Derumeaux G et al. Current and evolving echocardiographic techniques for the quantitative evaluation of cardiac mechanics: ASE/EAE consensus statement on methodology and indica-tions endorsed by the Japanese Society of Echocardiography. Eur J Echocardiogr 2011;12:167 – 205.
21. Ng ACT, Sitges M, Pham PN, Tran DT, Sc BA, Delgado V et al. Incremental value of 2-dimensional speckle tracking strain imaging to wall motion analysis for detection of coronary artery disease in patients undergoing dobutamine stress echocardiog-raphy. Am Heart J 2009;158:836 – 44.
22. Pavlopoulos H, Grapsa J, Stefanadi E, Philippou E, Dawson D, Nihoyannopoulos P. Is it only diastolic dysfunction? Segmental relaxation patterns and longitudinal systolic deformation in systemic hypertension. Eur J Echocardiogr 2008;9:741 – 7. 23. Ernande L, Bergerot C, Rietzschel ER, De Buyzere ML, Thibault H, PignonBlanc PG
et al. Diastolic dysfunction in patients with type 2 diabetes mellitus: is it really the first marker of diabetic cardiomyopathy? J Am Soc Echocardiogr 2011;24: 1268 – 75.