Comparison of terahertz technologies for detection and identification
of explosives
René Beigang*
a, Sandra G. Biedron
b, Sławomir Dyjak
c, Frank Ellrich
d, Magnus W. Haakestad
e,
Daniel Hübsch
f, Tolga Kartaloglu
g, Ekmel Ozbay
g, Frank Ospald
a, Norbert Palka
h, Uro
š
Puc
i,
Elżbieta Czerwińska
h, Asaf B. Şahin
j, Aleksander Sešek
k, Janez Trontelj
k, Andrej Švigelj
k, Hakan
Altan
l, Arthur D. van Rheenen
e, Michał Walczakowski
ha
TU Kaiserslautern, Department of Physics and Research Center OPTIMAS, Erwin-Schrödinger-Str.
46, 67663 Kaiserslautern, Germany;
bColorado State University, Department of Electrical and
Computer Engineering, Fort Collins, CO, USA 80523-1373;
cMilitary University of Technology,
Faculty of New Technologies and Chemistry, 2 Kaliski Str., 00-908 Warsaw, Poland;
dFraunhofer
Institute for Physical Measurement Techniques IPM, Department of Material Characterization and
Testing, Erwin-Schrödinger-Str. 56, 67663 Kaiserslautern, Germany;
eNorwegian Defence Research
Establishment (FFI), P. O. Box 25, NO-2027 Kjeller, Norway;
fHÜBNER GmbH & Co. KG,
Antonius-Raab-Str. 5, 34123 Kassel, Germany;
gBilkent University, Nanotechnology Research
Center, 06800 Bilkent, Ankara, Turkey;
hMilitary University of Technology, Institute of
Optoelectronics, 2 Kaliski Str., 00-908 Warsaw, Poland;
iJožef Stefan International Postgraduate
School, Jamova 39, 1000 Ljubljana, Slovenia;
jYildirim Beyazit University, Electrical and
Electronics Engineering Department, Ankara, Turkey;
kUniversity of Ljubljana, Faculty of Electrical
Engineering, Tržaška 25, 1000 Ljubljana, Slovenia;
lMETU, Physics Department, Ankara, Turkey
ABSTRACT
We present results on the comparison of different THz technologies for the detection and identification of a variety of explosives from our laboratory tests that were carried out in the framework of NATO SET-193 “THz technology for stand-off detection of explosives: from laboratory spectroscopy to detection in the field” under the same controlled conditions. Several laser-pumped pulsed broadband THz time-domain spectroscopy (TDS) systems as well as one electronic frequency-modulated continuous wave (FMCW) device recorded THz spectra in transmission and/or reflection.
Keywords: THz time-domain spectroscopy, THz cw spectroscopy, THz inspection, explosives, detection, identification, electronic THz source, photonic THz system
1. INTRODUCTION
THz spectroscopy can be applied for the detection of various hazardous substances such as illicit drugs and explosives. However, this general statement stems from proof-of-principle investigations in well-controlled, laboratory environments. In-the-field usage of THz equipment will face numerous obstacles like masking of spectral windows by atmospheric humidity, the need to penetrate multiple layers of fabric or packaging covering the substance of interest, and the identification of substances in mixtures of varying homogeneity and morphology.
To prepare field tests which eventually should assess the potential of THz spectroscopy for stand-off detection of explosives, our group conducted a laboratory measurement campaign with several THz systems available, so that not only the response of various explosives, but also the performance of the technologies could be compared. Besides three broadband time-domain spectroscopy (TDS) set-ups with photonic THz emission and detection techniques also a narrowband electronic spectrometer with FM emitter and a microbolometer array as sensor was employed. The explosives used in this study were HMX, RDX and PETN, and additionally PABA and α-lactose as reference materials.
2. THZ SYSTEMS 2.1 Photonic THz systems
Notably, the photonic set-ups were based on commercially available systems that had been more or less customized. We used a TDS system with remote, fiber-coupled measurement heads, which had been constructed by Fraunhofer IPM for the Norwegian FFI and thus is called NorT, a TPS Spectra 3000 spectrometer from TeraView and an electro-optic spectrometer based on a modified Rainbow Photonics TeraKit system (s. Fig. 1).
Figure 1. The photonic THz systems used in this trial. Top left: Optical subsystem of the NorT spectrometer; top right: fiber-coupled NorT measurement heads in dried air enclosure; bottom left: TPS Spectra 3000 with external fiber-fiber-coupled add-on compartment for reflection measurements; bottom right: modified electro-optic TeraKit spectrometer.
The NorT and TPS Spectra 3000 system utilize photoconductive GaAs-based antennas (PCAs) both for generation as well as detection of pulsed THz radiation. For pumping of these antennas, fs laser pulses from a Ti:Sapphire (TPS Spectra 3000) or frequency-doubled fiber laser (NorT) are employed. The TPS Spectra 3000 spectrometer has an internal sample compartment with dried air atmosphere to avoid water absorption bands in the spectra. In this configuration, it has a usable bandwidth of 3.6 THz with a peak dynamic range of 70 dB. The NorT system, on the other hand, was designed for positioning flexibility and remote operation and thus includes a portable emitter and detector unit, each of them connected to the main supply and operating system via a 5 m fiber/cable umbilical. Therefore, the measurements with this THz sensor were performed in an improvised external enclosure which was flushed with dried air as well (s. Fig. 1). It exhibits a bandwidth of 2.5 THz and 73 dB peak dynamic range1.
The electro-optic spectrometer, pumped by a fs laser at 1.55 µm with 76 fs pulse duration and 160 mW average power at 100 MHz rep rate utilizes optical rectification in a DSTMS crystal for broadband THz emission and terahertz-induced lensing in another DSTMS crystal for detection. Measurements were done only in transmission with this system.
O
reference (raw data) reference (apodized) 10 20 Time delay (ps) 30 reference (apodized) noise level
(\ivo,LÌ
1 z t,
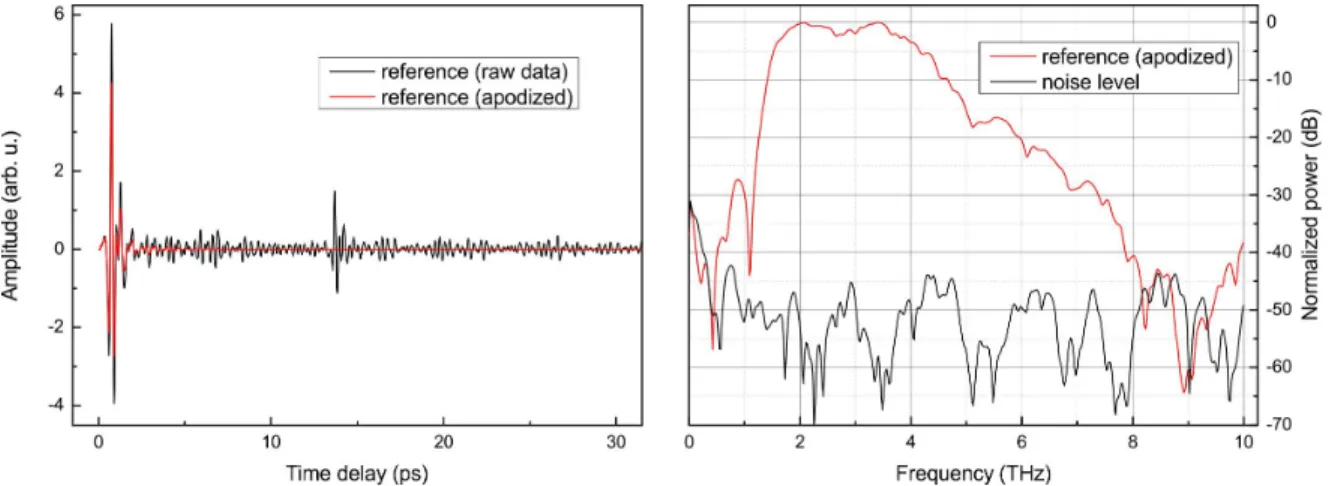
- -10 ( 4 6 Frequency (THz) 8 I E 50 Z 60 70 10Figure 2. Time- (left panel) and frequency- (right panel) domain reference data of the electro-optic TDS system. The high noise level and multiple reflections in the DSTMS crystals require apodization of the time-domain data before the FFT. The dip in the spectrum at 8 THz as well those around 1, 3, 5, 6, and 7 THz are characteristic for the DSTMS crystal3.
THz TDS with organic crystals like DSTMShas shown bandwidths beyond 10 THz when using sufficiently short laser pulses; the bandwidth in the set-up of our campaign ranged from approximately 0.5 to 8 THz with a peak dynamic range of 45 dB. While the strong transverse optical phonon line of DSTMS at 1 THz2 renders it effectively unsuitable for
spectroscopy below 1.2 THz, its almost flat spectral maximum between 2 and 4 THz gives access to a spectral range where the PCA-based systems already are beyond their limits (s. Fig. 2). The THz part of the beam path is enclosed in a compartment which is flushed with dried air to eliminate the atmospheric water vapor absorption bands in the recorded data.
2.2 Electronic THz system
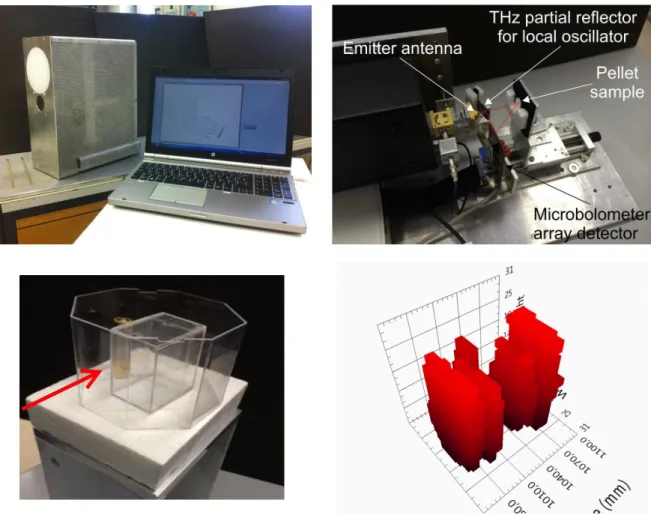
The electronic THz narrowband tool adopts a different technological approach, namely frequency-modulated electronic generation of THz radiation and detection of it in a microbolometer array. Several arrangements of frequency multiplier chains can cover the range from 100 GHz up to 1.2 THz. The main set-up, which is not only used for cw spectroscopy, but rather for imaging (s. Fig. 3), has a basic range from 9 to 14 GHz which is multiplied by a factor of 24 in three steps, resulting in an output in the frequency range 0.22-0.34 THz.
As detector for all emitter configurations, a 16×2 array of 32 antenna-coupled microbolometers with 100 V/W sensitivity and 5 pW/√Hz NEP is used. Imaging is done by projecting the scene which is illuminated by the emitter horn antenna with a pivoting mirror onto the array and reconstructing it from these line scans. When operated in reflection mode, a split-off part of the emitted radiation can serve as local oscillator in the microbolometer antenna, so that heterodyning with the signal reflected from the target and thus ranging with submillimeter resolution is possible. The radiation from the sample is coupled to the bolometers by a suitable antenna, which also enables the ranging functionality when a split-off part of the emitted radiation is heterodyned with the signal in the antenna4.
3. SUBSTANCES 3.1 Reference materials
Besides the explosives, we measured several harmless chemicals with well-known THz characteristics for comparison. The reference material PABA (para-aminobenzoic acid) exhibits absorption peaks around 0.6, 0.8, 1.3, 1.53-1.59 and 2.2 THz. At higher frequencies within the range of our measurements, absorption at 4.2 and 7.86 THz was reported5,6.
Another well-studied reference material was α-lactose with THz absorption at 0.53, 1.19, 1.37, 1.8, 2.55, 2.9, and 3.3 THz7,8.
-mitter antenna
THz partial reflector
for local oscillator
Pellet
/sample
for
Microbolometer
array detector
Figure 3. The electronic THz cw imaging and spectroscopy system. Top left: imaging configuration in housing with lenses; top right: configuration for spectroscopy; the radiation passes through the pellet and is reflected at the metallic mirror behind, so that absorption data can be recorded; bottom left: test scene for imaging; bottom right: reconstructed THz image of the scene.
3.2 Explosives
We had in total 18 explosives at hand, as pellets with low substance concentration or powders for transmission measurements, as well as pure or, if necessary, phlegmatized material for reflection measurements. Out of these, we present data from HMX, RDX and PETN in this study.
Regarding their characteristic features, HMX (also called octogen) is expected to show peaks in the absorption at 1.8, 2.5, 2.8-2.9, 3.5, 4.1, 5.3-5.4 and 6.1 THz9-13. RDX (cyclonite, hexogen) has been examined in many terahertz and
far-infrared studies and exhibits a strong absorption peak at approximately 0.83 THz, which is a unique signature of that explosive. Further absorption features can be expected at 1.05, 1.4-1.5, 1.95, 2.2, 3.05 and 6.73 THz. Also, enhanced absorption around 4.4 and in several bands between 5 and 6 THz was reported9-11,14-17. PETN (penthrite) is commonly
identified by its characteristic twin absorption peaks at approximately 2 and 2.85 THz. Absorption features at higher frequencies were measured around 3.75, 4.3, 4.9 and 5.5-6 THz10,13,17,18.
For the results presented in the next section, the frequency-domain data from the TDS measurements were calculated via FFT after apodization of the time-domain traces (3-term Blackman-Harris for the NorT and TPS Spectra 3000 systems, single-side exponential decay in the case of the TeraKit spectrometer). The parameters in the plots are defined as follows: “Transmittance” in transmission measurements is the ratio between the signal powers of measurement with
0.5 - PABA HMX RDX - PETN 05 10 Frequency (THz) 15 05 10 Frequency (THz) 15
sample and the reference measurement, whereas power is the square of the detected THz amplitude. The equivalent in reflection measurements is “reflectance”, whereas the reference in reflection is measured with a metallic mirror instead of the sample. “Absorbance” is calculated as the negative common logarithm of transmittance. The “derivative of reflectance” in reflection measurements is taken with respect to the frequency.
4. RESULTS 4.1 NorT
The NorT spectrometer can take data alternatively in transmission or reflection geometry due to the freely arrangeable sensor heads. During the measurement campaign, it suffered from the failure of one pump diode of the laser, reducing its output power by 50 %. Since this affects the THz emitter as well as the detector, the actually recorded signal dropped by 75 %, reducing the usable bandwidth to approximately 1.7 THz (s. Fig. 4).
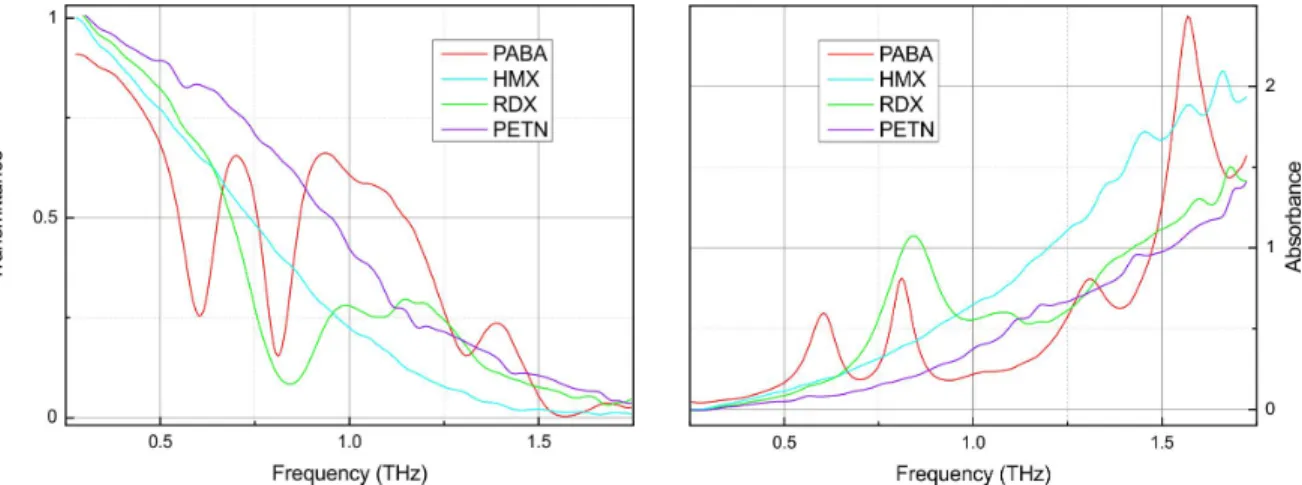
Figure 4. THz transmittances (left panel) and absorbances (right panel) of PABA and several explosives, measured with the NorT system. Features at frequencies above 1.7 THz cannot be unambiguously identified.
In transmission, the reference measurements on the PABA pellet show the absorption peaks at 0.6, 0.8, 1.3, and just below 1.6 THz. Access to higher frequencies is prohibited by the limited bandwidth of the system. For HMX, the absorption peak at 1.8 THz is masked by a multitude of peaks between 1.4 and 2 THz which do not allow an identification of the substance. RDX reveals itself by the 0.83 THz absorption peak, while the system is not suitable to identify PETN; its bandwidth is not sufficient to capture the characteristic peaks at 2 and 2.85 THz.
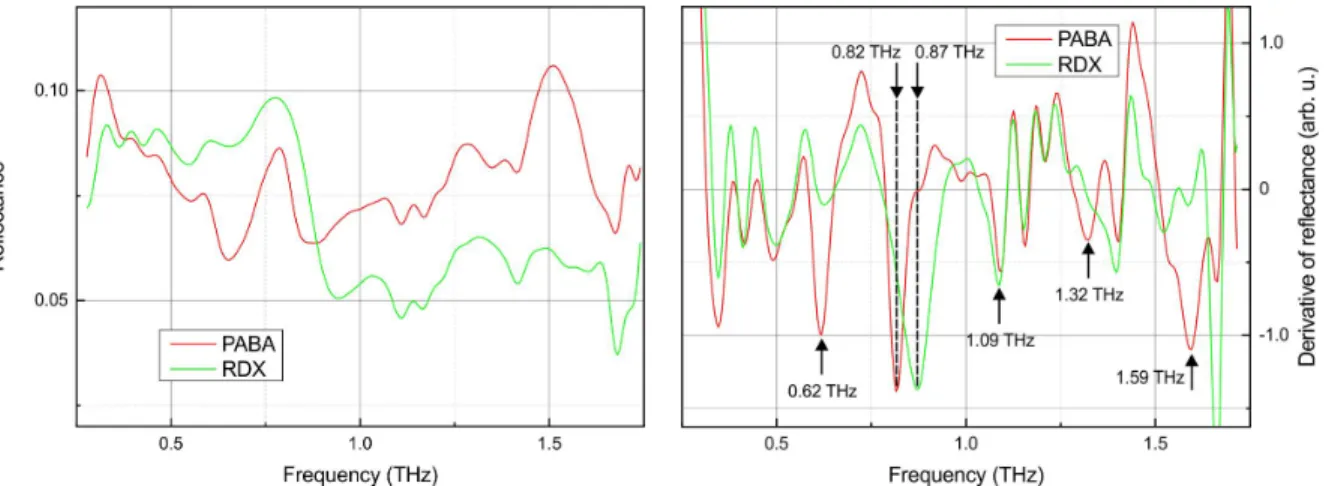
Measurements in reflection for PABA and RDX reveal the same features as in transmission (s. Fig. 5), however there are plenty of additional peaks in the reflectance derivatives that have to be considered as artifacts and hamper unambiguous identification of the substances. The unique absorption features can best be discovered via a comparison of the plots. Weaker characteristics, like the RDX absorption around 1.05 THz, are masked by the artifacts (see the dip at 1.09 THz which appears for PABA as well as RDX).
0.10 0.05 05 10 Frequency (THz) 15 0.82 THz 0.87 T 1z
nll
- PABA
RDX 0.62 THz 05 10 Frequency (THz) 15 1.0 a) U C a) a) O a) > 0.75 0.50 0.25 o 1 2 Frequency (THz) 3 4 2 1 2 Frequency (THz) 3 4Figure 5. THz reflectances (left panel) of PABA and RDX and their derivative versus frequency (right panel), measured with the NorT system. Absorption features (i. e. changes in the complex refractive index) should manifest themselves in the derivative.
4.2 TPS Spectra 3000
Measurements with the TPS Spectra 3000 (s. Fig. 6) for HMX showed the peaks at 1.8, 2.5 and 2.9 THz. The additional shoulder in the absorbance at approximately 2.2 THz can be matched with experimental data11 and simulations12. The
absorption feature at 3.5 THz already is affected by the decreasing dynamic range of the system in that region. The absorbance spectrum recorded for RDX is a typical one, with the characteristic strong 0.83 THz peak, the small peak at 1.05 THz and a plethora of comparatively broad features up to 3 THz. The PETN double peak feature as well is clearly identifiable; also the shoulder at the high-frequency slope of the first peak matches existing data9,17.
Figure 6. THz transmittances (left panel) and absorbances (right panel) of HMX, RDX and PETN, measured with the TeraView spectrometer. The characteristics of the three substances up to a frequency of roughly 3.5 THz are well pronounced.
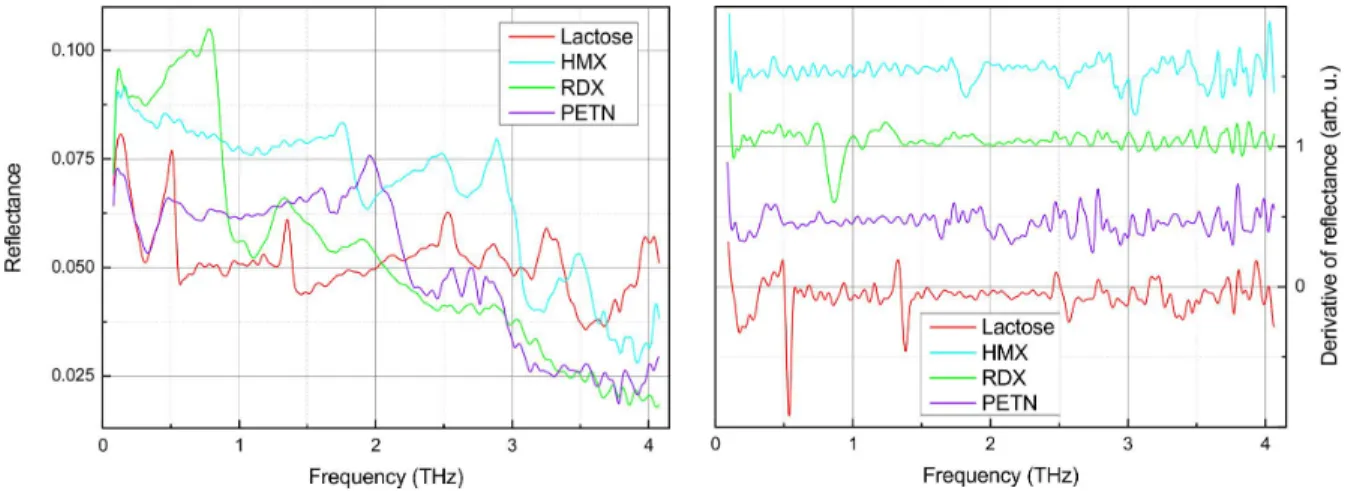
The TeraView spectrometer allowed to also measure in reflection (under an angle of incidence of 7°) in an external compartment that was fiber-coupled to the main system (s. Fig 1). Results for the reflectance and its derivative with respect to the frequency as an indicator for the absorption features are shown in Fig. 7. The lactose features at 0.53, 1.37 and 2.55 are present in the reflectance derivative, as well as the main RDX peak. Regarding HMX, the 1.8 THz
0.100 0.075 Lactose
- HMX
RDX PETN 0.025 o 1 2 Frequency (THz) 3 4pt r w^n T,
Tr,
I - Lactose- HMX
- RDX
- PETN
1 2 Frequency (THz) 3 L 4 1.6 1.2 - PABA HMX- RDX
- PETN 0.4 2 3 4 5 Frequency (THz) 6 7 8absorption can be identified, while the features between 2.5 and 3 THz appear at slightly higher frequencies than expected. The twin feature of PETN at 2 and 2.85 THz can hardly be seen in the plot.
Figure 7. THz reflectances (left panel) of pure substances and their derivative versus frequency (right panel), measured with the TeraView spectrometer. The traces in the right panel have been offset for clarity.
4.3 TeraKit
The measurements with the TeraKit system for PABA reflected the enhanced absorption at 1.6 and 2.2 THz, while identification of the features at higher frequencies are ambiguous: The peak expected at 4.2 THz appears to be down-shifted or split, and the broad absorption increase between 5 and 6 THz as well as the strong peaks at 6.76 and 7.19 THz are unexpected. However, the reference data for this region was taken by FTIR spectroscopy, which can introduce quantitative differences in the absorbance values in comparison to TDS5. Minor absorption peaks, bands and shoulders
that are visible in the respective frequency region in the FTIR data could appear more prominent in TDS measurements. The 7.86 THz peak, albeit being positioned close to the high-frequency edge of the available bandwidth range of the system, is visible.
Figure 8.Absorbance of PABA and several explosives measured with the electro-optic TDS system. The time-domain traces have been apodized to suppress multiple reflections in the DSTMS crystals before FFT.
1 0,8 0,6 0,4 0,2 o PABA Absorbance 500 550 600 650 Frequency (GHz) 700 3 2,5 2 1,5 1 0,5 o LACTOSE Absorbance 500 550 600 65D Frequency (GHz) 700 1 0,8 0,6 0,4 0,2 0
PABA Absorbance - Reference
500 550 600 650 700
Frequency (GHz)
For the explosives under test, the measurements qualitatively showed the absorption features that are characteristic for HMX up to 5 THz. While also the feature around 5.3 THz is present, the strong peak at 5 THz is unique to our measurement. Since DSTMS has an absorption band around 5 THz, it cannot be excluded that this feature is an artifact. Also, identification the peak around 6 THz could suffer from absorption in the crystals. The peak at 6.25 THz, however, could well be a real feature, since measurements and calculations9,11 indicate enhanced absorption in that region.
With respect to RDX, its signature feature at 0.83 THz is outside the usable bandwidth of the system. The absorption bands around 2 and 3 THz can be identified, however. Furthermore, the peak at 4.4 THz as well as absorption bands between 5 and 6 THz can be seen. The predicted peak at 6.73 THz9 is missing, but a pronounced one at 6.4 THz is
present. This region needs to be investigated further.
For PETN, the characteristic double peak is rather weakly expressed, as are the features at higher frequencies. Whether the dominating absorption peak at 7 THz is real or an artifact will be re-examined with an FTIR spectrometer.
4.4 Electronic frequency-modulated continuous wave system
Since this system is rather designed for imaging in the 300 GHz region, we just recorded typical spectral features of PABA and lactose to demonstrate the applicability of this system for THz cw spectroscopy, which are shown in comparison to reference measurements in Fig. 9.
Figure 9. The results of the electronic THz cw spectrometer (top row) in comparison with the corresponding data from the TPS Spectra 3000 system (smoothed by interpolation).
5. CONCLUSION
We recorded the THz spectrum of several well-known explosives (HMX, RDX, PETN) with different THz technologies. TDS systems that are based on photoconductive antennas deliver a comparatively high dynamic range with a usable bandwidth that reaches up to roughly 3.5 THz, which is enough to identify the explosives from this study. Access to higher frequencies (up to 8 THz), albeit with a lower dynamic range, is realized with an electro-optic TDS tool that utilizes DSTMS crystals for THz emission and detection. Efficient spectroscopy below 1 THz can also be realized with a purely electronic FMCW set-up.
After this laboratory campaign, investigation of in-the-field capability will follow. This will include e.g. taking data of covered substances, or in ambient atmosphere. For the goal of stand-off detection, the possibilities of identification from reflection measurements should be examined further. This increase in experimental difficulty must be accompanied by support of the system operator with (semi-)automatic data processing and chemometrics routines for identification of hazardous substances.
6. ACKNOWLEDGEMENT
The laboratory tests were carried out at the Military University of Technology, Warsaw, Poland in September 2013 within the framework of SET-193 “THz technology for stand-off detection of explosives: from laboratory spectroscopy to detection in the field” of the NATO Science and Technology Organization (STO). S. G. B. acknowledges support from the Office of Naval Research, Colorado State University, and CSU Ventures Systems Solutions Group.
REFERENCES
[1] Van Rheenen, A. D. and Haakestad M. W., “Detection and identification of explosives hidden under barrier materials – what are the THz-technology challenges?” Proc. SPIE 8017, 801719 (2011).
[2] Stillhart, M., Schneider, A. and Günter, P., “Optical properties of 4-N,N-dimethylamino-4´-N´-methyl-stilbazolium 2,4,6-trimethylbenzenesulfonate crystals at terahertz frequencies,” J. Opt. Soc. Am. B 25(11), 1914-1919 (2008).
[3] Rainbow Photonics product sheet, see http://www.rainbowphotonics.com/prod_THz_generators.php
[4] Trontelj, J., Sešek, A. and Švigelj, A., “THz-vision system with extended functionality,” Proc. SPIE 8716, 87160B (2013).
[5] Song, Q., Zhao, Y., Zhang, R., Liu, X., Dong, L. and Xu, W., “Measurement and DFT calculation on terahertz spectroscopy of 4-aminobenzoic acid,” J. Infrared Milli. Terahz. Waves 310(3), 310-318 (2010).
[6] Walczakowski, M. J., Palka, N., Zagrajek, P. and Szustakowski, M., “Terahertz spectra of materials measured by the OPO-based system,” Proc. SPIE 8716, 87160Y (2013).
[7] Bjarnason, J. E., Brown, E. R. and Korter, T. M., “Comparison of the THz absorption feature in lactose to related saccharides,” Proc. SPIE 6549, 65490L (2007).
[8] thzdb.org
[9] Liu, H.-B., Zhong, H., Karpowicz, N., Chen, Y. and Zhang, X.-C., “Terahertz spectroscopy and imaging for defense and security applications,” Proc. IEEE 95(8), 1514-1527 (2007).
[10] Leahy-Hoppa, M. R., Fitch, M. J., Zhen, X., Hayden, L. M. and Osiander, R., “Wideband terahertz spectroscopy of explosives,” Chem. Phys. Lett. 434(4-6), 227-230 (2007).
[11] Ortolani, M., Lee, J. S., Schade, U. and Hübers, H.-W., “Surface roughness effects on the terahertz reflectance of pure explosive materials,” Appl. Phys. Lett. 93(8), 081906 (2008).
[12] Hooper, J., Mitchell, E., Konek, C. and Wilkinson, J., “Terahertz optical properties of the high explosive β-HMX,” Chem. Phys. Lett. 467(4-6), 309-312 (2009).
[13] Palka, N. and Trzcinski, T., “Some aspects of far infrared spectroscopy of explosive materials,” Proc. SPIE 7938, 79380L (2011).
[14] Huang, F., Schulkin, B., Altan, H., Federici, J. F., Gary, D., Barat, R., Zimdars, D., Chen, M. and Tanner, D. B., “Terahertz study of 1,3,5-trinitro-s-triazine by time-domain and Fourier transform infrared spectroscopy,” Appl. Phys. Lett. 85(23), 5535-5537 (2004).
[15] Shen, Y. C., Lo, T., Taday, P. F., Cole, B. E., Tribe, W. R. and Kemp, M. C., “Detection and identification of explosives using terahertz pulsed spectroscopic imaging,” Appl. Phys. Lett. 86(24), 241116 (2006).
[16] Liu, H.-B., Chen, Y., Bastiaans, G. J. and Zhang, X.-C., “Detection and identification of explosive RDX by THz diffuse reflection spectroscopy,” Opt. Express 14(1), 415-423 (2006).
[17] Konek, C., Wilkinson, J., Esenturk, O., Heilweil, E. and Kemp, M., “Terahertz spectroscopy of explosives and simulants – RDX, PETN, sugar and L-tartaric acid,” Proc. SPIE 7311, 73110K (2009).
[18] Giles Davies, A., Burnett, A. D., Fan, W., Linfield, E. H. and Cunningham, J. E., “Terahertz spectroscopy of explosives and drugs,” Mater. Today 11(3), 18-26 (2008).