Examination and Comparison of Electrically Evoked
Compound Action Potentials and Electrically Evoked
Auditory Brainstem Response Results of Children with
Cochlear Implantation without Inner Ear Anomaly
Seda Bayrak1 , Başak Mutlu2 , Günay Kırkım1 , Bülent Şerbetçioğlu31Department of Audiology, Dokuz Eylül University School of Health Sciences, İzmir, Turkey 2Department of Audiology, İstanbul Medeniyet University School of Health Sciences İstanbul, Turkey 3Department of Audiology, Medipol University School of Health Sciences, İstanbul, Turkey Original Investigation
This study was presented at the VI. National Audiology and Speech Disorders, October, 2012, İstanbul, Turkey
Corresponding Author:
Başak Mutlu; [email protected] Received Date: 29.01.2019
Accepted Date: 09.04.2019 Available Online Date: 27.06.2019 DOI: 10.5152/tao.2019.4130 Copyright@Author(s)
Content of this journal is licensed under a Creative Commons Attribution 4.0 International License. Available online at www.turkarchotolaryngol.net
Abstract Objective: To investigate the relationship between
electrically evoked compound action potentials (ECAP) and electrically evoked auditory brainstem responses (EABR) in children with cochlear implants (CI) without inner ear anomalies.
Methods: Sixteen children between the ages of two
and six years who were CI users participated in the study. ECAP thresholds were recorded from one electrode in the basal, medial, and apical regions of the cochlear implant. EABRs were recorded from electrodes whose ECAP thresholds were determined. The latency-intensity functions, amplitude and mor-phological analyzes of the eIII and eV waves at 200 and 180 current unit (CU) excitation levels were per-formed. The data obtained were analyzed statistically.
Results: ECAP thresholds were found to be
171.5±11.38, 169.69 ± 20.32 and 160.81±20.03 CU at the basal, medial and apical electrodes, respectively. EABR thresholds were also found to be 169.69±12.17, 165.62±16.41 and 160±15.49 CU in basal, medial and apical electrodes, respectively. There was a strong
pos-itive correlation between ECAP and EABR thresh-olds in apical, medial and basal electrodes (p<0.05). EABR threshold levels were not significantly dif-ferent between basal, medial and apical region elec-trodes (p>0.05), and ECAP threshold values were significantly different between apical and basal region electrodes (p=0.002). When the significance values of EABR eV wave latencies were analyzed in terms of electrode region, the difference between basal and apical regions was found to be significant (p=0.03).
Conclusion: Consistency was found between ECAP
and EABR recordings. However, it was concluded that one could not be preferred over the other be-cause the data quality of the two tests was different. In future studies, ECAP and EABR recordings may be recommended by selecting more electrodes for stimulation.
Keywords: Cochlear implant, electrophysiological
studies, electrically evoked compound action poten-tial, electrically evoked auditory brainstem response
ORCID IDs of the authors:
S.B. 0000-0001-8272-5686; B.M. 0000-0002-9803-9258; G.K. 0000-0003-4170-5317; B.Ş. 0000-0002-5985-097X.
Cite this article as: Bayrak S, Mutlu B,
Kırkım G, Şerbetçioğlu B. Examination and Comparison of Electrically Evoked Compound Action Potentials and Electrically Evoked Auditory Brainstem Response Results of Children with Cochlear Implantation without Inner Ear Anomaly. Turk Arch Otorhinolaryngol
2019; 10.5152/tao.2019.4130
Introduction
Cochlear implantation is an amplification methodused in children and adults with severe and found sensorineural hearing loss. Effective pro-gramming of speech processors, effectively deter-mining the dynamic range, and ensuring that the patient comfortably perceives acoustic stimulants is highly important in cochlear implant (CI) pa-tients (1).
Electrophysiological measurements are performed to assess and adjust the CI in pediatric patients. These include electrically evoked auditory brain-stem response (EABR), electrically evoked
stapedi-al reflex threshold (ESRT), electricstapedi-ally compound action potentials (ECAP), middle latency responses (MLR), and cortical responses (CR). ECAP is the most frequently used of these methods, both intra- and postoperatively. That it provides limited infor-mation about auditory nerve fibrils and creates elec-trical measurement artefact are its disadvantages. On the other hand, it provides detailed information related to the auditory evoked brainstem activity. However, requires deep sleep or sedation because it is affected by muscle artefact (2-4).
The aim of this study is to identify the relationship between the results of two electrophysiological
techniques, ECAP and EABR, in pediatric CI users with no inner ear anomaly. The hypothesis of the study was defined as “The relationship between ECAP and EABR results are linear.”
Methods
This study was conducted at the Dokuz Eylül University Hospital, Ear, Nose, Throat Department, Hearing-Speech-Balance Unit, in-cluded 16 Nucleus CI 24 Contour users aged from two to six years and were radiologically confirmed to have no abnormalities of the inner ear. Consent was obtained from the families of the patients prior to the study. Ethics committee approval was obtained from the Ethics Committee of the Dokuz Eylül University. ECAP re-cordings were made while patients were awake. Electrical stimuli were created with apical (electrode number 20), medial (electrode number 11) and basal (electrode number 3) electrodes in ECAP and EABR. Recording electrodes were 22, 13 and 5, respectively. ECAP was measured with 25 microsecond/pulse and 50 Hz stim-ulus and standard monopolar stimstim-ulus (MP1) was used.
Evoked auditory brainstem responses was recorded on a differ-ent day than ECAP. Families were asked to keep the child awake the night before and the recording was made during natural sleep using a laptop computer with Medelec Synergy EMG/EP Systems (VIASYS Healthcare, UK) software and equipment. The EABR test protocol was completed in two sessions in some patients. Stimuli were transmitted from the user’s processor via a coil by the same CI firm. Connection between the CI and the EABR device was established by an external trigger cable compatible with this brand. Three gold disc electrodes were used in recording and each electrode was carefully placed in the same area during every recording. The difference between positive (forehead-hairline border) and negative (mastoid contralateral to the implanted ear) electrodes was recorded in EABR. The earth electrode was placed in the forehead region (Fpz). Elec-trodes were placed with skin impedance below 2 kOhms. EABR recording was carried out at 25 Is/phase intervals and using 20 Hz monopolar biphasic alternating polarity stimulation. Re-sponses were filtered using 0.1-3000 Hz analog band-pass filter and amplifier sensitivity was set at 500 µV. Analysis window was 10 msec and sampling rate was 25 kHz. Stimulation was single-channel and simultaneous with the recording. Recording was performed from apical-medial and basal electrodes, respec-tively. Recording began from the apical region where the most distinct response was evoked (3, 5, 6). Contralateral placement technique was used to minimize artefact (4, 7-10). Intensity-la-tency function and morphological analysis of the evoked waves were recorded at 200 and 180 current unit (CU) stimulus levels. Before stimulating at these levels, care was taken not to exceed the comfort level set in the most recent programs of the indi-viduals. Following the recordings at 200 CU and 180 CU, stim-ulus intensity was reduced in increments of 10-units and the last stimulus level at which wave eV was observed was accepted as the EABR threshold. Stimulation levels 5 units above and below the threshold were also recorded (11, 12). At least two tracings were recorded at each stimulation level and the aver-age number in each tracing was set to 1000. ECAP and EABR thresholds of basal, medial and apical electrodes, wave eIII and
eV latencies at EABR 200 CU and 180 CU and eIII-eV in-terwave intervals, amplitude levels of eII and eV waves at this intensity level, and wave eV morphologies were evaluated. Descriptive statistics of nominal, ordinal and numerical data were performed. The significance of the relationship between ECAP and EABR thresholds was analyzed by Spearman cor-relation test. Wilcoxon signed-rank test was used to analyze the significance of the difference between ECAP and EABR thresholds. Nonparametric Friedman variance analysis was used to determine whether wave eIII and eV latencies and amplitudes evoked in EABR differed in apical, medial and basal electrodes. A p-value <0.05 was accepted as significant. Statistical Package for the Social Sciences version 16.0 (IBM Corp.; Armonk, NY, USA) software was used.
Results
Of the 16 patients included in the study, 12 were male (75%) and four were female (25%). The CI was in the right ear in 15 patients (94%) and in the left ear in one patient (6%). The mean age of the patients was 46.08±9.13 months and the mean age of the CIs was 27.03±8.2 months. ECAP and EABR responses were evoked by all apical, medial and basal electrodes in all par-ticipants. While wave eI could not be recorded due to the mask-ing of the electrical stimulus artefact, waves eII and eIV were observed in some recordings. Waves eIII and eV were evoked in all cases at 200 CU. In all electrodes, wave eV latencies were seen to prolong as stimulus intensity decreased. ECAP and EABR thresholds and wave eV latencies obtained in EABR thresholds are given in Table 1.
Based on the values given in Table 1, no significant differences were observed between the EABR and the ECAP thresholds in basal, medial and apical regions (p>0.05). Moreover, the sig-nificance of the difference between the ECAP and the EABR thresholds was analyzed in terms of the site of the electrode. EABR thresholds were not found significantly different be-tween basal, medial and apical region electrodes (p>0.05), but ECAP thresholds showed significant differences between apical and basal region electrodes (p=0.002). When the difference be-tween EABR wave eV latencies at the threshold level was an-alyzed with respect to electrode regions, significant difference was found between basal and apical regions (p=0.03).
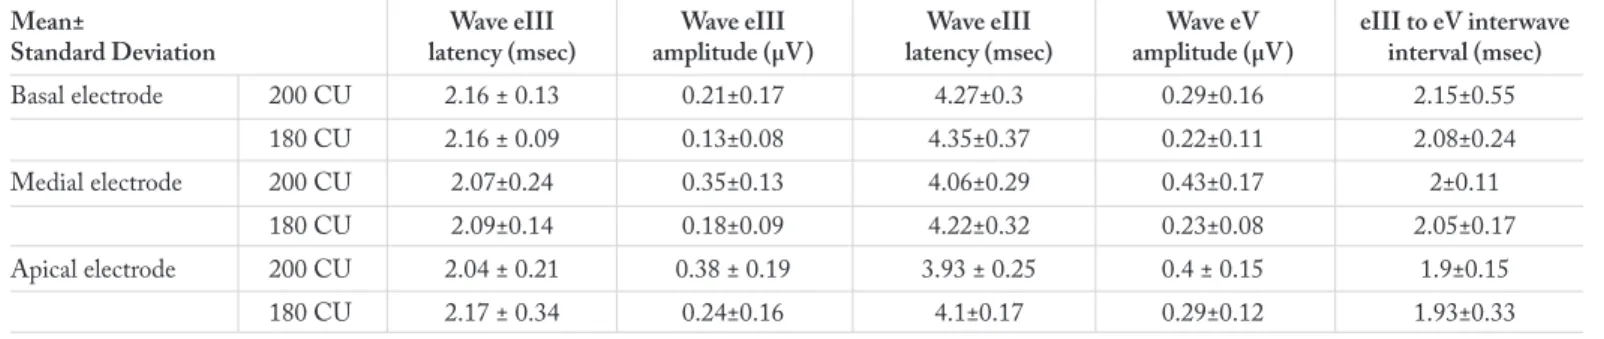
Evoked auditory brainstem response results according to elec-trode regions are given in Table 2. Wave eIII and eV amplitudes
Table 1. ECAP and EABR thresholds and wave eV latencies
obtained in EABR thresholds
Mean±Standard ECAP EABR Wave eV latency at
Deviation threshold (CU) threshold (CU) threshold (msec)
Basal electrode 171.5±11.38 169.69±12.17 4.88±0.4
Medial electrode 169.69±20.32 165.62±16.41 4.58±0.32
Apical electrode 160.81±20.03 160±15.49 4.53±0.35
ECAP: electrically compound action potentials; EABR: electrically evoked auditory brainstem response; CU: current unit; msec: millisecond
and latencies obtained at 180 CU and 200 CU, and eIII-eV in-terwave intervals are shown in this table.
An analysis of wave eV latencies at 200 CU and 180 CU inten-sity as given in Table 2 showed that wave eV latencies obtained at 180 CU did not significantly differ (p>0.05), but wave eV latencies obtained at 200 CU did significantly differ among the electrode regions. These results are given in Table 3.
Differences between EABR wave latencies and amplitudes at 200 CU and 180 CU are given in Table 4. Accordingly, wave eIII and eV latencies and amplitudes were identified to show significant differences at 200 CU and 180 CU stimulation. Only eIII-eV interwave intervals did not show any differences. Additionally, significant correlation was identified between the EABR and the ECAP thresholds in each of the stimulation re-gions. Correlation was found uphill and moderate for the basal region, and uphill and high in the medial and apical regions. At the same time, EABR and ECAP levels for the medial and the apical regions were observed to have an uphill and moderate correlation (Table 5).
Discussion
In all cases included in this study, high-amplitude eV waves with significant peaks were obtained in the apical region espe-cially at 200 CU. Wave eV latencies evoked by apical electrodes were significantly shorter than those evoked by basal electrodes. Also, ECAP thresholds evoked by apical electrodes were found to be lowest and significantly different from those evoked by basal electrodes.
In our study, we also found that ECAP and EABR thresholds showed an uphill, strong and significant correlation among
api-cal, medial and basal electrode regions. In a study which they conducted with Nucleus CI users, Brown et al. (13) demonstrat-ed that there were no significant differences between ECAP and EABR thresholds.
Hay-McCutcheon et al. (14) have compared the EABR and EAP (Electrically Evoked Whole-Nerve Action Potential) measurements in 10 postlingual adults with Nucleus CI 24R and Nucleus CI 24M implants, and reported to have found sig-nificant difference between the EAP and the EABR thresholds in the Nucleus CI 24M users, but no significant difference in Nucleus CI 24R users. It is probable that stimulant parame-ters and/or demographic characteristics of sample groups are different in studies that report significant differences between ECAP and EABR thresholds and the results were affected by these differences.
In a study which Hughes and Stille (6) evaluated the psycho-physiological and psycho-physiological measurements of electrical field interaction in CI users, they reported that significantly higher ECAP thresholds were evoked by basal electrodes compared to those evoked by apical electrodes. This result is consistent with our results.
Firszt et al. (2) reported high levels in EABR thresholds ob-tained from apical electrodes. In another study, the same group of authors studied lateral to medial electrode placement in terms of EABR and reported that the electrode regions showed differ-ences by EABR thresholds. They found that the thresholds ob-tained from medial electrodes were lower and wave amplitudes were higher (15). In our study, EABR thresholds in each of the electrode regions were evaluated and no significant differences were found.
In our study, we found significant difference between the basal and apical electrodes in wave latencies at EABR threshold level. Significantly earlier wave eV latencies were obtained from apical electrodes than basal electrodes. Similar results are also found in the literature (6, 15-17). A study investigating the effects of anatomy on EABR reported that wave eIII and eV latencies were significantly affected by the stimulated region, and mean latency levels of wave eV showed an increase of 0.43 msec from the apex to the basal in all electrodes (18). This was explained by the larger diameter of the apical nerve fibers (5). In our study,
Table 3. Significance of wave eV latency differences between
intensities of 200 and 180 CU in terms of electrode region (p values)
200 CU 180 CU
Basal-apical 0.002 0.13
Basal-medial 0.004 0.86
Apical-medial 0.049 0.37
CU: current unit
Table 2. EABR latency and amplitude levels obtained at 180 and 200 CU by electrode stimulation regions
Mean± Wave eIII Wave eIII Wave eIII Wave eV eIII to eV interwave
Standard Deviation latency (msec) amplitude (µV) latency (msec) amplitude (µV) interval (msec)
Basal electrode 200 CU 2.16 ± 0.13 0.21±0.17 4.27±0.3 0.29±0.16 2.15±0.55 180 CU 2.16 ± 0.09 0.13±0.08 4.35±0.37 0.22±0.11 2.08±0.24 Medial electrode 200 CU 2.07±0.24 0.35±0.13 4.06±0.29 0.43±0.17 2±0.11 180 CU 2.09±0.14 0.18±0.09 4.22±0.32 0.23±0.08 2.05±0.17 Apical electrode 200 CU 2.04 ± 0.21 0.38 ± 0.19 3.93 ± 0.25 0.4 ± 0.15 1.9±0.15 180 CU 2.17 ± 0.34 0.24±0.16 4.1±0.17 0.29±0.12 1.93±0.33
wave eV latency at 200 CU showed a significant difference among all stimulation regions. No significant differences were identified among wave eV latencies at 180 CU in terms of elec-trode regions. There are studies that support (2, 15, 19, 20) this result and advocate the opposite (9, 17, 21, 22) in the literature. In our study, wave eIII latencies were examined at 200 CU and 180 CU intensities. Wave eIII latency at 200 CU was signifi-cantly prolonged in the basal electrode. The difference between the apical and the medial electrodes was not significant. No significant differences were identified among wave eIII laten-cies at 180 CU in terms of electrode regions. This result may suggest that the stimulation level may have affected wave eIII latency since stimulation at higher intensities can both cause latency and stimulate more central areas. This finding has been previously reported in the literature (23). Guirauda et al. (23) reported that wave eIII latency was significantly affected by the stimulated region, and mean latency levels showed an increase of 0.49 msec from the apex to the basal in all electrodes.
No significant differences were found in our study among apical, medial and basal electrodes in the eIII-eV interval at 200 CU and 180 CU intensities. This result was found consistent with the literature. In a study examining the characteristics of hear-ing loss and the anatomical effects of auditory pathways with EABR, the effect of the stimulated region on wave eIII-eV in-terval was not found statistically significant (18). In the light of the data obtained in our study and from the literature, we can say that wave eIII latency is prolonged or shortened parallel to the eV wave latency and this applies to all electrode regions. In the literature, eII wave latency is reported as 1.30 msec, eIII wave latency as 2.10 msec, and eV wave latency as 3.75 msec at a stimulus level close to the maximum behavioral dynamic range.
Similarly, interwave latencies were reported as 0.80 msec for the eII-eIII interval, 1.60 msec for the eIII-eV interval, and 2.40 msec for the eII-eV interval (2, 16, 24, 25). Wave eV amplitude was defined in the range of 1.00 to 1.46 µV at high stimulus intensity depending on the recording electrode in the implant electrode array (26). In our study, the results closest to these lev-els were obtained from apical stimulation at 200 CU. Wave eV amplitude at 200 CU did not show a significant difference in the apical and the medial electrodes but decreased significantly in the basal electrode. In our study we also examined wave ampli-tudes at 180 CU and found no significant differences in wave V amplitudes with respect to electrode regions. Stimulus intensity, as well as electrode placement alter EABR amplitude.
Each of the EABR response parameters—latency, amplitude and morphology—varies as a function of the electrode position. Wave eV latency of the basal region electrode is longer than that of the apical region electrode (27, 28). This result was also found in our study. In their study they conducted in 2006 with seven adult and sev-en pediat ric Nucleus 24 CI users, Çiprut and Akdaş (29) re-ported EABR results in which wave eV amplitudes decreased as stimulus levels decreased, and wave morphology was better in apical channels.
That, in our study, a significant peak was observed in wave eV in all cases at 200 CU in the apical regions and a decrease was seen towards the basal in the number of cases at the same intensity, is consistent with the studies reporting that the population of live spiral ganglion cells affect the amplitude and morphology variables in EABR waves (18). When the stimulus level de-creased to 180 CU, the number of cases with significant peaks also decreased. The flattened and ovaliform state which wave eV has assumed from the apical to the basal at 200 CU was also observed at 180 CU.
Conclusion
In EABR, it will be better to select multiple electrodes from each of the basal, medial and apical regions to record responses specific to each stimulation region. In EABR, the most distinct response is evoked at 200 CU. EABR recording can be started at this intensity level. At the same time, 200 CU was a sufficient level for demonstrating the characteristics of wave latency and wave morphology. EABR or ECAP recording techniques are not suitable substitutes in CI assessment. While ECAP can be preferred for its clinical practicality, EABR may be more suit-able for use in clinical trials because of the more qualitative in-formation it provides.
Table 5. Analysis of the correlation between EABR and ECAP
thresholds
Basal ECAP Medial ECAP Apical ECAP
Basal EABR R 0.675 0.103 -0.218 P 0.004** 0.703 0.418 Medial EABR R 0.214 0.901 0.678 P 0.426 0.0001** 0.004** Apical EABR R 0.221 0.753 0.802 P 0.410 0.001** 0.0001**
**: Data showing significance at p<0.001
ECAP: electrically compound action potentials; EABR: electrically evoked auditory brainstem response
Table 4. Significance of the difference between EABR wave latencies and amplitudes of 200 and 180 CU (p)
Wave eIII latency Wave eV latency eIII to eV interwave interval Wave eIII amplitude Wave eV amplitude
Basal 0.005 0.010 0.87 0.003 0.008
Medial 0.007 0.002 0.08 0.003 0.002
Apical 0.001 0.001 0.31 0.001 0.001
Ethics Committee Approval: Ethics committee approval was received
for this study from Dokuz Eylül University Non-invasive Researches Ethical Committee (2012/17-24).
Informed Consent: Written informed consent was obtained from the
families of the patients who participated in this study.
Peer-review: Externally peer-reviewed.
Author Contributions: Concept - S.B., B.Ş.; Design - S.B., B.Ş.;
Su-pervision - B.Ş., G.K., B.M.; Resource B.Ş., G.K., B.M.; Materials - S.B., B.Ş.; Data Collection and/or Processing - S.B., B.Ş.; Analysis and/or Interpretation - B.Ş., G.K., B.M., S.B.; Literature Search - S.B.; Writing - B.M., S.B.; Critical Reviews - B.Ş., G.K., B.M.
Conflict of Interest: The authors have no conflicts of interest to
de-clare.
Financial Disclosure: The authors declared that this study has
re-ceived no financial support.
References
1. Gordon KA, Papsin BC, Harrison RV. Activity-dependent devel-opmental plasticity of the auditory brain stem in children who use cochlear implants. Ear Hear 2003; 24: 485-500. [CrossRef]
2. Firszt JB, Chambers RD, Kraus N, Reeder RM. Neurophysiolo-gy of cochlear implant users: Effects of stimulus current level and electrode site on the electrical ABR, MLR, and N1-P2 response. Ear Hear 2002; 23: 502-15. [CrossRef]
3. Cinar BC, Atas A, Sennaroglu G, Sennaroglu L. Evaluation of objective test techniques in cochlear implant users with inner ear malformations. Otol Neurootol 2011; 32: 1065-74. [CrossRef]
4. Şerbetçioğlu B. Periferik ve santral işitsel işlevlerin değerlendir-ilmesi. Kulak Burun Boğaz Hastalıkları ve Baş Boyun Cerrahisi, Çelik O, editor. 2nd ed. Ankara: Asya Tıp Kitabevi, 2007; 19-33. 5. Tavartkiladze GA, Potalova LA, Kruglov AV, Belov A. Effect of
stimulation parameters on electrically evoked auditory brainstem responses. Acta Otolaryngol 2000; 120: 214-7. [CrossRef]
6. Hughes ML, Stille LJ. Psychophysical and physiological measures of electrical-field interaction in cochlear implants. J Acoust Soc Am 2009; 125: 247-60. [CrossRef]
7. Møller A R, Janetta PJ. Neural generators of the auditory brain-stem response, in Jacobson JT editor. The Auditory Brainbrain-stem Re-sponse. San Diego: College Hill Press; 1984. p. 13-31.
8. Cords SM, Reuter G, Issing PR, Sommer A, Kuzma J, Lenarz T. A silastic positioner for a modiolus-hugging position of intracochlear electrodes: Electrophysiologic effects. Am J Otol 2000; 21: 212-7.
[CrossRef]
9. Abbas PJ, Brown CJ. Electrically evoked brainstem potentials in cochlear implant patients with multi-electrode stimulation. Hear Res 1988; 36: 153-62. [CrossRef]
10. Kileny PR, Zwolan TA, Boerst A, Telian SA. Electrically evoked auditory potentials: Current clinical applications in children with cochlear implants. Am J Otol 1997; 18: S90-2.
11. Thai-Van H, Cozma S, Boutitie F, Disant F, Truy E, Collet L. The pat-tern of auditory brainstem response wave V maturation in cochlear-im-planted children. Clin Neurophysiol 2007; 118: 676-89. [CrossRef]
12. Runge-Samuelson C, Firszt JB, Gaggl W, Wackym PA. Electri-cally evoked auditory brainstem responses in adults and children:
Effects of lateral to medial placement of the Nucleus 24 contour electrode array. Otol Neurotol 2009; 30: 464-70. [CrossRef]
13. Brown C J, Hughes ML, Luk B, Abbas PJ, Wolaver A, Gervais J. The relationship between EAP and EABR thresholds and lev-els used to program the Nucleus 24 speech processor: Data from Adults. Ear Hear 2000; 21: 151-63. [CrossRef]
14. Hay-McCutcheon MJ, Brown CJ, Clay KS, Seyle K. Comparison of electrically evoked whole-nerve action potential and electrically evoked auditory brainstem response thresholds in Nucleus CI24R cochlear implant recipients. J Am Acad Audiol. 2002; 13: 416-27. 15. Abbas PJ, Brown CJ, Shallop JK, Firszt JB, Hughes ML, Hong
SH, et al. Summary of results using the Nucleus CI24M implant to record the electrically evoked compound action potential. Ear Hear 1999; 20: 45-59. [CrossRef]
16. Shallop JK, Beiter AL, Goin DW, Mischke RE. Electrically evoked auditory brainstem responses (EABR) and middle latency responses (EMLR) obtained from patients with the Nucleus mul-tichannel cochlear implant. Ear Hear 1990; 11: 5-15. [CrossRef]
17. Miller CA, Abbas PJ, Brown CJ. Electrically evoked auditory brainstem response to stimulation of different sites in the cochlea. Hear Res 1993; 66: 130-72. [CrossRef]
18. Thai-Van H, Gallego S, Veuillet E, Truy E, Collet L. Electrophys-iological findings in two bilateral cochlear implant cases: Does the duration of deafness affect electrically evoked auditory brain stem re-sponses? Ann Otol Rhinol Laryngol 2002; 111: 1008-14. [CrossRef]
19. van den Honert C, Stypulkowski PH. Characterization of the electrically evoked auditory brainstem response (ABR) in cats and humans. Hear Res 1986; 21: 109-35. [CrossRef]
20. Stypulkowski PH, van den Honert C, Kvistad SD. Electrophysio-logic evaluation of the cochlear implant patient. Otolaryngol Clin North Am. 1986; 19: 249-57.
21. Nagel D. Compound action potential of the cochlear nerve evoked electrically. Electrophysiological study of the acoustic nerve (guin-ea pig). Arch Otorhinolaryngol 1984; 206: 293-8. [CrossRef]
22. Hermann, B. and Thornton, A. Electrically-evoked auditory brain-stem responses in cochlear implant patients. The Second Interna-tional Cochlear Implant Symposium 1990; pp: 57, Iowa City, IA. 23. Guirauda J, Gallego S, Arnold L, Boyle P, Truy E, Collet L. Effects
of auditory pathway anatomy and deafness characteristics? (1): On electrically evoked auditory brainstem responses. Hear Res 2007; 223: 48-60. [CrossRef]
24. Hervé T, Truy E, Durupt I, Collet L. A new stimulation strategy for recording electrical auditory evoked potentials in cochlear im-plant patients. Electroencephalogr Clin Neurophysiol 1996; 100: 472-8. [CrossRef]
25. Pelizzone M, Kasper A, Montandon P. Electrically evoked re-sponses in cochlear implant patients. Audiology 1989; 28: 230-8.
[CrossRef]
26. Hall JW. ABR Parameters, Protocols and Procedures. New Hand-book of Auditory Evoked Responses. Boston, Mass: Pearson; 2007. p. 595-7.
27. Abbas P, Brown C. Electrically evoked auditory brainstem re-sponse: Growth of response with current levels. Hear Res 1991; 51: 123-37. [CrossRef]
28. Firszt JB, Chambers RD, Kraus N. Neurophysiology of cochlear im-plant users: Comparison among speech perception, dynamic range, and physiologic measures. Ear Hear 2002; 23: 516-31. [CrossRef]
29. Ciprut A, Akdas F. Electrically evoked auditory brainstem re-sponses in cochlear implant patients. J Int Adv Otol 2007; 3: 6-11.