EFFECTS OF REVERBERATION TIME ON CLASSICAL SINGERS’ PREFERENCES UPON MUSIC PRACTICE ROOMS
A Master’s Thesis
by ÖZGÜN SİNAL
Department of
Interior Architecture and Environmental Design İhsan Doğramacı Bilkent University
Ankara September 2015
EFFECTS OF REVERBERATION TIME ON CLASSICAL SINGERS’
PREFERENCES UPON MUSIC PRACTICE ROOMS
Graduate School of Economics and Social Sciences of
İhsan Doğramacı Bilkent University
by
ÖZGÜN SİNAL
In Partial Fulfillment of the Requirements for the Degree of MASTER OF FINE ARTS
in
THE DEPARTMENT OF
INTERIOR ARCHITECTURE AND ENVIRONMENTAL DESIGN İHSAN DOĞRAMACI BİLKENT UNIVERSITY
ANKARA
I certify that I have read this thesis and have found that it is fully adequate, in scope and in quality, as a thesis for the degree of Master of Fine Arts in Interior
Architecture and Environmental Design.
_________________________ (Assoc. Prof. Semiha Yılmazer) Supervisor
I certify that I have read this thesis and have found that it is fully adequate, in scope and in quality, as a thesis for the degree of Master of Fine Arts in Interior
Architecture and Environmental Design.
_________________________ (Prof. Mehmet Çalışkan)
Examining Committee Member
I certify that I have read this thesis and have found that it is fully adequate, in scope and in quality, as a thesis for the degree of Master of Fine Arts in Interior
Architecture and Environmental Design.
_________________________ (Assoc. Prof. Çağrı İmamoğlu) Examining Committee Member
Approval of the Graduate School of Economics and Social Sciences
_________________________ (Prof. Erdal Erel)
iii
ABSTRACT
EFFECTS OF REVERBERATION TIME ON CLASSICAL SINGERS’
PREFERENCES UPON MUSIC PRACTICE ROOMS
Özgün Sinal
MFA in Interior Architecture and Environmental Design Supervisor: Assoc. Prof. Semiha Yılmazer
September 2015
The purpose of this study is to investigate the effect of reverberation time variances on classical singers’ [N=30] preferences in individual music practice rooms. The
method has combined objective measurements (RT) and perceptual responses of participants. The participant group [N=30] has consisted of five different backgrounds in vocal studies ; EME (early music education) students (N=6), skilled amateurs (N=5), undergraduate singing students (N=6), graduate singing students (N=5), and professionals (N=8). Classical singers has been asked to sing with as high and as low as they could with melisma singing style (in opera singing technique) in three different room settings which had following reverberation times; around 0.6 s, 0.8 s, and 1.0 s. These were the values, which acoustical standards for music schools recommended. The participants have also been asked to sing with three different singing volumes in each room setting. The findings have been analyzed statistically. According to the results, classical singers have preferred the room setting with 0.8 s reverberation time considering their overall experience in three different room settings. Classical singers’ perceived singing effort has had a statistically significant relationship with preferred room setting. In addition, it has been found that there is a relationship between preference and background in vocal studies, which means that while experienced classical singers prefer dead conditions to live conditions, unexperienced classical singers prefer live conditions to dead conditions. It has also been found that, according to perceptual responses, experienced classical singers exert less singing effort while less experienced classical singers exert more singing effort in same room conditions.
Keywords: Reverberation Time, Music Practice Rooms, Perceived Singing Effort, Classical Singers.
iv
ÖZET
KLASİK ŞANCILARIN MÜZİK ÇALIŞMA ODASI TERCİHLERİNE ÇINLAMA
SÜRESİNİN ETKİSİ
Özgün Sinal
İç Mimarlık ve Çevre Tasarımı Yüksek Lisans Programı Tez Yöneticisi: Doç. Dr. Semiha Yılmazer
Eylül, 2015
Bu çalışmanın amacı müzik çalışma odalarındaki çınlama süresi değişikliklerinin klasik şancıların tercihlerine etkisini incelemektir. Uygulanan yöntem, nesnel ölçümleri ve katılımcıların algısal cevaplarını bir araya getirmiştir. Katılımcı grubu
[N=30], ses çalışmalarında beş farklı özgeçmişe sahip kişilerden; erken müzik eğitimi
öğrencileri (N=6), yetenekli amatörler (N=5), üniversite öğrencileri (N=6), yüksek lisans öğrencileri (N=5) ve profesyonel opera sanatçılarından (N=8) oluşturulmuştur. Klasik şancılardan, çınlama süresi 0.6 s, 0.8 s ve 1.0 s dolaylarında olan oda ortamlarında tekli heceler halinde opera tekniğiyle çıkarabildikleri en bas ve tiz sesleri içerecek şekilde ses alıştırması yapmaları istenmiştir. Söz konusu çınlama süreleri ise müzik okulları için standartların önerdiği değerlerden oluşmaktadır. Katılımcılardan aynı zamanda bu alıştırmayı üç farklı şarkı söyleme şiddetinde tekrarlamaları istenmiştir. İstatistiksel veriler analiz edilmiştir. Buna göre, klasik şancılar, söz konusu üç farklı oda ortamındaki genel performanslarını değerlendirerek, çalışmak istedikleri oda ortamını çınlama süresini 0.8 s dolaylarında tercih etmiştir. Klasik şancıların algılanan ses eforları ve tercih ettikleri oda ortamı arasında istatistiksel olarak anlamlı bir ilişki bulunmuştur. Buna ek olarak, saptanmıştır ki oda ortamı tercihi ile ses çalışmalarındaki özgeçmiş arasında da ilişki vardır. Buna göre, tecrübeli klasik şancılar cansız koşulları canlı koşullara; tecrübesiz klasik şancılar ise canlı koşulları cansız koşullara tercih etmiştir. Ayrıca, bulunmuştur ki, algısal cevaplara göre tecrübeli klasik şancılar, aynı oda koşullarında tecrübesiz klasik şancılara göre daha az efor sarf etmiştir.
Anahtar Kelimeler: Çınlama Süresi, Müzik Çalışma Odaları, Algılanan Şarkı Söyleme Eeforu, Klasik Şancılar.
v
ACKNOWLEDGEMENTS
This thesis would not have been possible without splendid support and
encouragement from several very important people.
Foremost, I would like to thank Assoc. Prof. Semiha Yılmazer for her
guidance, moral and academic support, kindness, patient and sincere approach
during my undergraduate and graduate studies. She has unveiled me a whole new
world and encouraged me to have a better career. I would also like to thank Prof.
Mehmet Çalışkan and Assoc. Prof. Çağrı İmamoğlu for all their advices.
I owe special thanks to the team members of Mezzo Stüdyo; Dr. Zühre
Sü-Gül, Serkan Atamer, Zeynep Bora, and Işın Meriç-Nursal for all their support and
their close friendship.
Sincere thanks to my good friends Didem Doğan, İlkin Alpay and Giray Bayer
for their contributions to this work.
Lastly, I thank Gökçe Kutsal, not only for her several contributions to this
vi
TABLE OF CONTENTS
ABSTRACT ... iii ÖZET ... iv ACKNOWLEDGEMENTS ... v TABLE OF CONTENTS ... viLIST OF TABLES ... viii
LIST OF FIGURES ... ix
CHAPTER 1. INTRODUCTION ... 1
1.1. Aim and Scope ... 4
1.2. Structure of the Thesis ... 5
CHAPTER 2. ACOUSTICS IN MUSIC PRACTICE ROOMS ... 7
2.1. Music Practice Room Requirements ... 8
2.1.1. Reverberation Time (RT) ... 11
2.1.2. Limitations in Small Volumes ... 14
2.2. Effects of Reverberation Time on Singers’ Performance ... 16
CHAPTER 3. METHOD ... 24
3.1. Design of the Study ... 24
3.1.1. Research Questions ... 25 3.1.2. Hypotheses ... 25 3.2. Methodology ... 26 3.2.1. Objective Measurements ... 26 3.2.2. Subjective Measurements ... 32 CHAPTER 4. RESULTS ... 35 4.1. Objective Measurements ... 35 4.1.1. Reverberation Time (RT) ... 35
vii 4.1.2. Schroeder Frequency ... 39 4.2. Subjective Evaluations ... 39 4.2.1. Questionnaire results ... 40 4.2.2. Statistical Analyses ... 51 CHAPTER 5. DISCUSSION ... 53
5.1. Relationship between perceived singing effort on RT preference ... 53
5.2. Methods on Classical Singers... 56
5.3. Further Studies ... 59 CHAPTER 6. CONCLUSION ... 61 REFERENCES ... 66 APPENDICES APPENDIX A... 70 APPENDIX B ... 76 APPENDIX C ... 80 APPENDIX D ... 86
viii
LIST OF TABLES
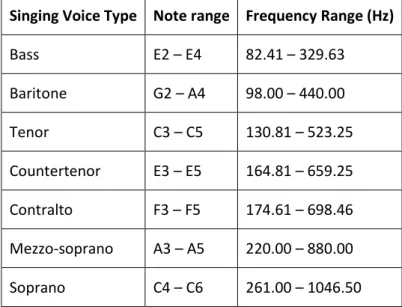
Table 1. General vocal ranges in scientific notation and related frequency ranges . 11
Table 2. Optimum RT for music practice rooms ... 13
Table 3. Calculated Schroeder frequency values for each room setting ... 39
Table 4. Vocal types of participants ... 40
Table 5. Participants’ background in vocal studies ... 41
Table 6. Mean and standart deviation for perceived singing effort ... 44
Table 7. Mean and standart deviation for perception of low notes ... 45
Table 8. Mean and standart deviation for perception of high notes ... 47
Table 9. Mean and standart deviation for perception of each singing volumes ... 49
Table 10. A selection of the participant responses indicating why did they prefer to practice in the preferred room setting ... 51
ix
LIST OF FIGURES
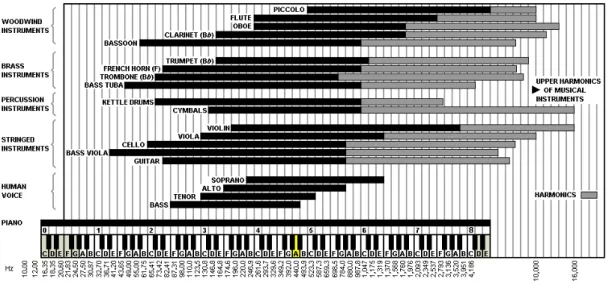
Figure 1. Ranges of singing voice and musical instrument frequencies ... 10
Figure 2. Optimum mid-frequency RT for speech and music as a function of room volume ... 13
Figure 3. Photograph of room setting 1 ... 28
Figure 4. Photograph of room setting 2 ... 28
Figure 5. Photograph of room setting 3 ... 29
Figure 6. ODEON model of room setting 1 ... 29
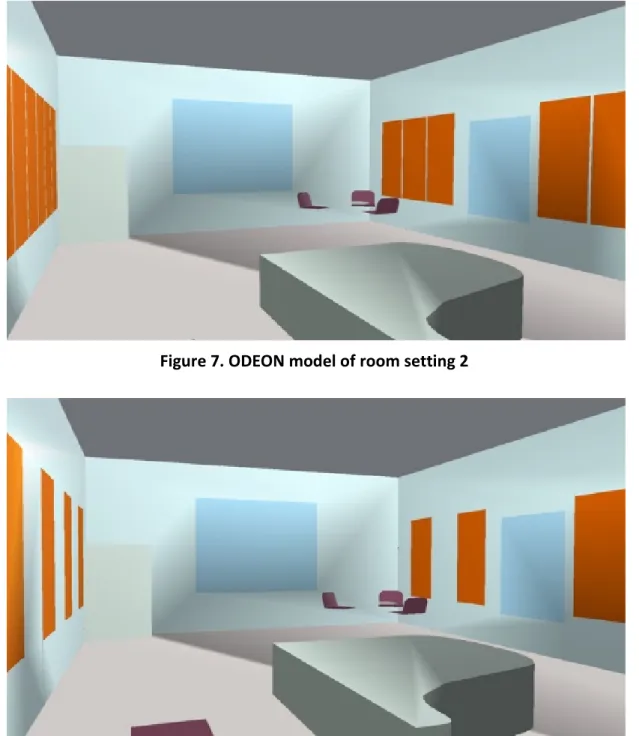
Figure 7. ODEON model of room setting 2 ... 30
Figure 8. ODEON model of room setting 3 ... 30
Figure 9. Sound source position in each room setting ... 33
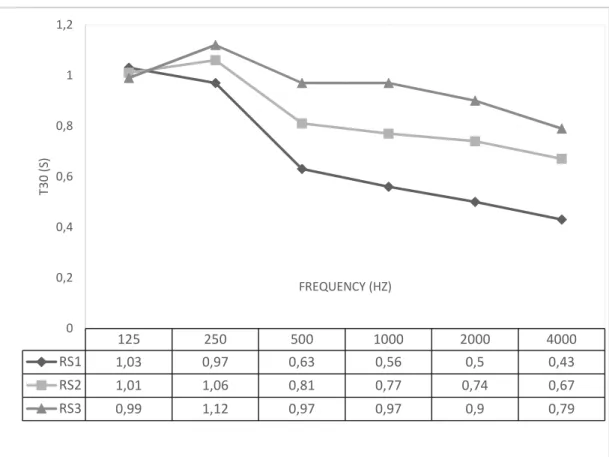
Figure 10. Measured RT values via ODEON for each room setting ... 36
Figure 11. Measured RT values for RS2 via ODEON and DIRAC ... 36
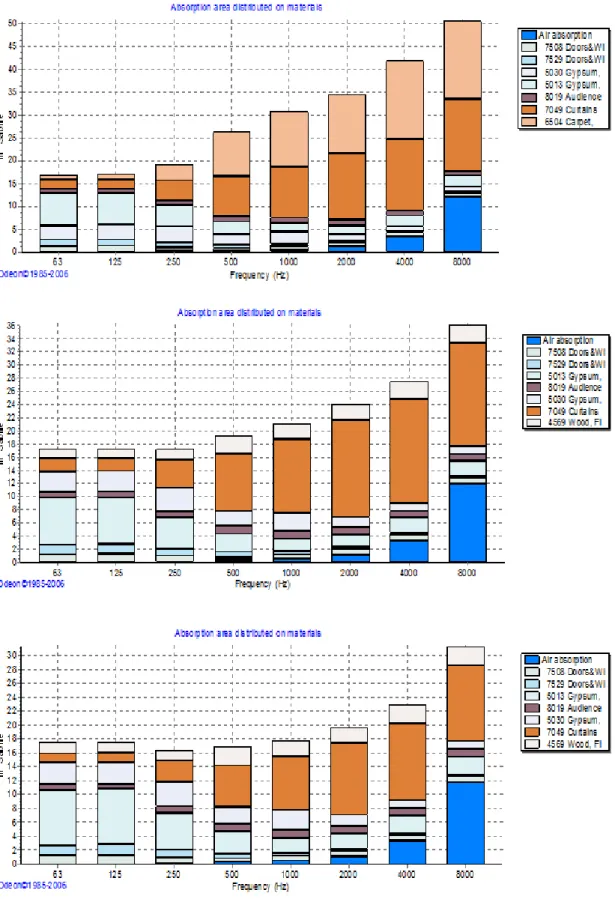
Figure 12. Absorption area distributed on materials for RS1, RS2 and RS3 consecutively ... 38
Figure 13. Number of concerts/ recitals participants usually perform in a year ... 42
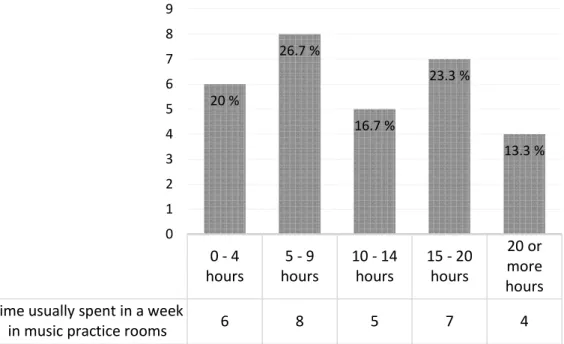
Figure 14. Time usually spent in a week in music practice rooms ... 42
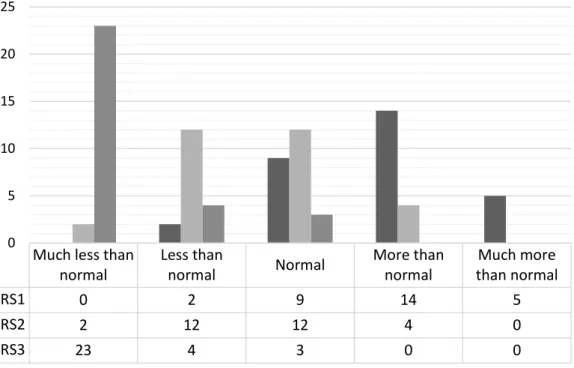
Figure 15. Perceived singing effort in each room setting ... 44
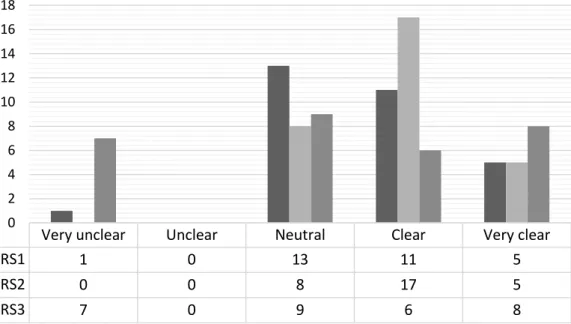
Figure 16. Perception of low notes in each room setting ... 45
Figure 17. Perception of high notes in each room setting ... 46
Figure 18. Perception of pianissimo-paced parts in each room setting ... 48
x
Figure 20. Perception of fortissimo-paced parts in each room setting ... 49 Figure 21. Preference of room setting for practicing ... 50
1
CHAPTER 1
INTRODUCTION
Architectural acoustics (room acoustics) aims to obtain a good sound quality
within diverse spaces from concert halls to railway stations (Morfey, 2000). The first
empirical study with modern scientific methods in architectural acoustics was
carried out by Wallace Sabine. Sabine (1922), a physician and mathematician, was
considered to be the first acoustician who investigated room acoustics in lecture
halls, such as lecture rooms in the Fogg Museum and in Harvard University, in terms
of room volume along with reverberation time and absorption. These experiences
led him to develop a formula (Sabine’s formula) for room absorption which is still
used in the architectural acoustics field to calculate reverberation time according to
the relationship between room volume and absorption on surface (Beranek, 2004).
Later then, as another contribution to acoustical design field, Sabine integrated
music and architectural acoustics with his investigation in Boston Symphony Hall.
Therefore, detailed researches for concert halls have begun.
One of the greatest contributors to the study of concert hall architectural
2
concert halls compiling information in his previous work. Beranek (2004), combined
objective measurements and subjective evaluations in his compiled work. Since
such spaces are designed for people, their subjective evaluations are required as
well. Therefore, in order to determine which characteristics in acoustical design
influence listeners, subjective evaluations act as confirmation towards acoustic in
concert halls.
Objective measurements are used to determine overall acoustical quality in
architectural attributes which are measured physically by reverberation time (RT),
early decay time (EDT), clarity (C80), definition (D50), lateral fraction (LF), strength
(G), and initial-time-delay gap (ITDG). On the other hand, subjective parameters
used to evaluate overall acoustical quality from user perspective that are listed as
subjective clarity, reverberance, envelopment, intimacy, loudness and warmth
(Beranek, 2004). These two parameters should have high correlations in between to
be considered as reliable (Sü, 2004).
Ternström (1991) recommended that sound should be studied by its
production, propagation and perception as certain areas of architectural acoustics
focus preferably on the perspectives of listeners and very few considers the
musicians, particularly the singers (as cited in Hom, 2013, p. 8). It is crucial to
analyze efficiency of singers’ vocal sound along with their perceptions of the room while singing, and hearing their own voices (Hom, 2013).
3
Hom (2013) also argues that perceptions of listeners and performers are
different. Hom’s study on singers indicated that the rooms which performers prefer
the most, affect listener perceptions negatively. In contrast, the rooms that
listeners are expected to prefer, affect performer perceptions negatively. Since
singers in music practice rooms practice their singing voices individually, their own
perceptions are to be considered, unlike in concert hall evaluations.
Singing performers predominantly need to adjust their voices according to
the different room environments from concert hall stages to small music practice
rooms. Teachers and vocal coaches along with internet forums suggest ways and
singing techniques on how to survive poor acoustics. Sataloff (2010) affirms the fact
and suggests that instead of teaching the singers how to survive poor acoustics;
acoustical experts should be consulted for design processes of music facilities. It is
also suggested for singers to sing normally, as they get used to the rooms for
practicing, so they can have better performances in every environment they
perform. For this reason, the reserved rooms for singers should be acoustically
suitable and efficiently designed in absorption. In this respect focusing on music
practice rooms’ acoustical conditions and the user’ responses towards the rooms, singers spend most of their time, becomes a necessity.
4
1.1. Aim and Scope
This study is designed to see the effects of reverberation time on classical
singers towards music practice rooms for individual usage purposes. The aim is to
compare perceptual evaluations of performers by controlling the reverberation
time. In this study, perceptual evaluations are acquired via questionnaires and in
real environments in order to eliminate biased assessments towards simulated
conditions. For this reason, singing practice rooms in Bilkent University Faculty of
Music and Performing Arts have chosen for this case study. There are three
different room settings arranged and designed to see the difference in participant
responses. Arranging the acoustical conditions in room settings, potential problems
emerging from the small volume and room geometry are eliminated where
necessary. However, modal behavior of room settings is not analyzed in detail.
Since the room modes subject is too complex by itself and requires too much effort
to analyze, it is beyond the scope of this research. In other respects, the main
acoustical parameter in this study is reverberation time. It is measured via ODEON
simulation software which gives reliable results.
In this study, the main aim is to obtain reasonable findings related to singing
effort. Singing effort is predominantly measured by exploring long time average
spectra (LTAS) and the difference between sound levels can be analyzed. However,
5
are investigated based on the recommendations of professional opera singers who
participated in the study.
1.2. Structure of the Thesis
The first of the five main chapters in this thesis, introduction presents the
development of architectural acoustics on music spaces and gives brief information
about the aim of the study along with the scope and structure of the present work.
In the second chapter, music practice rooms are described. Along with the
requirements of these rooms and their users, potential acoustical problems are also
given briefly. Then, empirical studies related to the present study are examined
focusing on the effects of reverberation time on singers in unamplified music rooms
(mainly concert halls). In this part, acoustical parameters of the rooms and
perceptual measurement techniques are also described briefly.
In the third chapter, the design of the study formed according to the
research questions is presented. It contains methodology, the most important part
of the study, which systematically describes the approach to the study and
preparations that are made to have contributive findings to the scientific research
field. Measurement techniques and procedure along with the designed
6
In the fourth one, the results of reverberation time measured via computer
simulation software and subjective evaluations of participants are given with
relevant statistical analyses.
Lastly, in chapter five, results are interpreted and compared with the
previous studies which are given in the second chapter. The further results are also
reasoned and other possible consequences are evaluated. These are followed by
7
CHAPTER 2
ACOUSTICS IN MUSIC PRACTICE ROOMS
Music practice rooms in music faculties are designed to provide practicing
space for diverse user groups ranging from brass instrumentalists to classical singers
for both ensemble studies, orchestral and individual practices (Osman, 2010). Apart
from practicing musicians, these rooms are used for music teaching purposes as
well. Music practice rooms mostly vary in size, volume, and geometry depending on
the aim of usage.
Every musician, before each concert or recital, spends a considerable
amount of time practicing his or her instruments. Especially music students spend
up to 40 hours in a week in practice rooms (Lamberty, 1980). Considering the time
spent, these rooms require a lot more attention to indoor sound quality as well as
concert halls.
Music practice rooms also deserve suitable acoustics since musicians are
learning and improving their skills by listening to their instruments. Particularly, as
8
concepts such as articulation, intonation, balance, dynamics and tone productions.
In this case, poor acoustical conditions affect the development of basic musical skills
of music students negatively (Osman, 2010). More importantly, such concerns are
among the most probable reasons of having poor performances in concerts and
recitals.
For hierarchical reasons in an architectural manner, music practice rooms
are designed to be small areas. Small music rooms are known to have problematic
acoustical properties if they are not treated carefully. At the beginning, noise
control and isolation have been the main concerns in their design (Osman, 2010).
However, carelessly projected absorption amount may lead to unforeseeable and
unintended consequences. Recent studies on music practice rooms have focused on
issues such as hearing problems emerging from loud instruments, noise exposure,
and vocal strain that musicians face due to poor acoustical conditions.
2.1. Music Practice Room Requirements
As stated in the previous paragraph, musicians playing loud instruments,
such as brass instruments, suffer from hearing problems while singers suffer from
vocal strain because of practicing with high-intensity. It is obvious that their
9
Regardless of their musical degree, singers have a common point in covering
their voices. This term is often used when referring to protecting voice against vocal
damage (Miller, 1996). Many singers taking singing lessons are taught strictly about
their voice usage. There are several techniques taught in singing education,
especially classical singing, that focus primarily on vocal comfort in order to
eliminate the vocal strain that results in shorter careers. Particularly while
producing higher and lower notes, singers often have difficulties and if the voice is
forced, vocal folds (sometimes misleadingly called vocal cords) may permanently be
damaged. Vocal folds of singers are actually their instruments. For this reason,
singers always carry the burden of covering their voices.
Protect themselves from upper respiratory infections which may be
damaging to their throats are also priorities for singers. In such cases, the process of
education is given a break until full recovery from the illness is achieved or the
scheduled concerts/recitals are cancelled.
Instrumentalists and singers have the mutual aim of learning and improving
their playing and singing techniques in music practice rooms. Learned technique is
expected to be maintained and improved throughout the education process. If the
wrong technique is learned, it is difficult to reform.
Along with the common points, musical instruments and singing voice have
10
and lowest notes of instrument groups and singing voice. Besides, produced sound
levels of musical instruments are different. For this reason, either music practice
rooms are to be designed to cover all requirements, or cover each instrument
groups separately such as wind, brass, bow instruments, and voice.
Simply put, the singing voice has seven major voice categories that are for
the most part acknowledged across all the major voice classification systems (Stark,
2003). Female voices are typically divided into three main groups: 1) soprano, 2)
mezzo-soprano, and 3) contralto while male voices are divided into four main
groups: 1) countertenor, 2) tenor, 3) baritone, and 4) bass. The following table,
Table 1, shows the general vocal ranges related with each singing voice type using
scientific pitch notation. One should know that some singers could sing higher or
lower than their specified singing voice types (Miller, 1996).
11
Table 1. General vocal ranges in scientific notation and related frequency ranges
Singing Voice Type Note range Frequency Range (Hz)
Bass E2 – E4 82.41 – 329.63 Baritone G2 – A4 98.00 – 440.00 Tenor C3 – C5 130.81 – 523.25 Countertenor E3 – E5 164.81 – 659.25 Contralto F3 – F5 174.61 – 698.46 Mezzo-soprano A3 – A5 220.00 – 880.00 Soprano C4 – C6 261.00 – 1046.50
Music practice room should fulfil the requirements of musicians by providing
the best-fit acoustical parameters that allow them excellent auditory perceptions.
Two of the most important requirements for acoustical comfort are a suitable
reverberation time (RT) according to the aim of the room, and elimination of
problems emerging from the small room size such as strong resonances and flutter
echoes.
2.1.1. Reverberation Time (RT)
In a general scientific description, reverberation time (RT) is defined as the
time, required for the average sound energy density to decay by 60 dB from an
equilibrium level after stopping a sound source (Sü, 2004). It is controlled by the
12
It can be calculated using Sabine’s formula as presented below:
T60 = 0,161 x V / At where,
T60 = reverberation time, or the time takes for a sound to decay by 60 dB (s)
V = volume of the room (m3)
A
t = total area of absorption in the room (sabins) (Egan, 2007)There are two additional formulas for calculation of reverberation time
which are proposed by Norris-Eyring and Millington & Sette (Egan, 2007). They are
also valid and currently in use in the field of architectural acoustics.
According to Australian/ New Zealand Standard on Acoustics-Recommended
Design Sound Levels and Reverberation Times for Building Interiors, AS/ NZS
2107:2000 (2000), The American National Standards Institute’s (ANSI) Design
Requirements and Guidelines for Schools standard, S12.60 (2002, 2010),
Department for Education and Skills’ Building Bulletin 93, on Acoustical Design of Schools, BB93 (2003, 2015), optimum reverberation times should be around 0.6 s -
1.0 s band. Related RT values are presented in Table 2.
Since reverberation is a volume dependent acoustical parameter, as the
room volume increases, so does RT. Figure 2 is illustrating the optimum RT by
13
Table 2. Optimum RT for music practice rooms
Standards Volume (m3) RT (s)
AS/ NZS 2107:2000 (2000) Not Specified 0.5 – 0.7
ANSI S12.60 (2002) < 283 < 0.6 ANSI S12.60 (2010) < 283 < 0.6 BB93 (2003) (See Figure 2) < 0.8 BB93 (2015) ≤ 30 ≤ 0.61 - ≤ 0.82 > 30 ≤ 0.81 - ≤ 1.02
Figure 2. Optimum mid-frequency RT for speech and music as a function of room volume
1 Suggested RT value for newly built music practice rooms 2 Suggested RT values for refurbished music practice rooms
14
2.1.2. Limitations in Small Volumes
As stated, reverberation time is a primary acoustical parameter in room
acoustics. However, for small room acoustics, it may not be adequate. Even if the
correct reverberation time according to main aim of the room is provided,
undesirable reflections (flutter echoes) and room resonances pose perceptional
problems such as loudness at particular lower frequencies (BB93, 2003).
Accordingly, along with reverberation time, there are two other factors are to be
investigated designing small practice rooms.
Flutter echo can be described as a rapid series of echoes (especially in small
rooms) arising from reflection between two parallel surfaces. In order to eliminate
them, untreated surfaces should not face each other (Osman, 2010). In addition,
flutter echoes can also be minimized by adding diffusive surfaces where necessary
such as quadratic residue diffusers (QRD) as proposed by Schroeder (1975).
Diffusion (or scattering such as bookshelves) also contributes to the balance of the
sound in a music practice room along with increasing the communications between
teachers and students. Despite eliminating flutter echoes, standing waves that can
cause acoustical problems may not be prevented.
Standing waves, which emerge from room modes, can be described as a low
frequency resonance which takes place between two parallel surfaces. In other
words, where the distance between two parallel walls interferes, a standing wave
15
singing in bathroom the one may realize that some certain notes make the room
resonate by enhancing the sound level and often a boomy sound is perceived. For
this reason, in rectangular small rooms, room modes should be taken into
consideration.
The very first empirical study concerning room modes was published by
Mors & Bolt (1944). The researchers mainly focused on axial modes since they are
the strongest modes. After that, Bolt (1946) developed a pair of formulas without
defining any criteria for how room modes should be. Eventually, the subject of
determining particular room ratios was discussed by other researchers. The
following room ratios by worldwide respected acousticians using the positioning of
axial, tangential, and oblique modes are accepted worldwide: 1:1.14:1.39 and
1:1.6:2.33 by Sepmeyer (1965), and 1:1.4:1.9 by Louden (1971). Along with these,
Louden determined 125 more ratios. Yet, there were no certain criteria for the best
room concerning well-distributed room modes. Instead, Schroeder’s widely used
formula is used in order to determine the lowest frequency.
The Schroeder Frequency, also known as cut-off frequency, is commonly
used to define the crossover between the low frequency regions, dominated by
particular room modes (Schroeder, 1962). The related frequency can be calculated
with the following formula:
16
where,
FS = Schroeder Frequency (Hz)
T = Expected reverberation time (s)
V = Volume of the room (m3) (Everest & Pohlmann, 2009)
In other words, Schroeder frequency indicates how reliable the results of
reverberation time calculations are. Below that limit frequency, modes can be
expected to dominate the room acoustic conditions. Therefore, a deeper
investigation to the modal behavior of the room setting may be required.
2.2. Effects of Reverberation Time on Singers’ Performance
This section reviews empirical research literature related to the effects of
reverberation time on singers’ performance. Although the focus of this thesis is on the effect of reverberation time along with perceptions of singers in individual
practice rooms, studies investigated aforementioned subjects in smaller music
rooms, such as practice rooms, are rare. Yet, eight other investigations (Marshall &
Meyer, 1985; Ternström, 1989; Guyette, 1996; Noson et al., 2000, 2002; Skirlis et
al., 2005; Stetson & Braasch, 2009; Hom, 2013) focusing on the effects of acoustics
in concert halls on singers have useful findings to examine for this study.
Investigations on concert halls have been studied concerning both objective
17
investigations have focused mainly on performers in terms of the effects of
reverberation time and perceived acoustical quality.
Moorcroft and Kenny (2013) investigated classical singers’ and listeners’ tonal quality perceptions before and after predesigned warm-up exercises. Twelve
professional female classical singers were asked to learn and sing an eight bar solo,
designed for this study, before and after 25 minutes of warm-up exercises and rate
their own performances. Six experienced listeners were asked to evaluate each
vocal sample, recorded in a recording studio rather than an anechoic chamber, in
terms of tonal quality. Dramatically, all singers perceived statistically significant
differences in tonal quality along with psycho-physiological factors, proprioceptive
feedback, and technical command (brilliance, energized alertness, resonant voice
sensations, and vocal connection throughout the body) as listeners observed
differences only in vibrato quality.
Blankenship, Fitzgerald, and Lane (1955) presented a comparison of
acoustical measurements and subjective evaluations of the users in music practice
rooms, rehearsal rooms and auditoriums in The University of Texas in order to
evaluate them in terms of their adequacy for music performance, and to integrate
the contribution of the musician along with the architectural acoustician on music
room designs. In the study, researchers determined three identical practice rooms
around 12 m3 volumes. Instrumentalists along with classical singers (n=20) were
18
panels in several ways. Participants were asked to evaluate room settings in terms
of tonal quality, dynamic range and reverberation after each session was
completed. The results showed that the room with around 0.5 s reverberation time
(RT) was desired among room settings with 0.4 s and 0.8 s RT. Researchers also
asked the same participants to evaluate two teaching rooms which had different
volumes, but around 70 m3. Reverberation time in related rooms was fixed to 0.6 s
by using draperies. All participants indicated that these two teaching studios were
far better than practice rooms. Besides, the larger teaching studio was found to be
better.
Guyette (1996) investigated the effects of acoustical conditions on five
professional opera singers (3 soprano, 2 tenor) towards ten different concert hall
conditions focusing on physical and psychological singer adjustment along with
perceptions on their own performances. Participants were to sing their own choice
of operatic arias in an anechoic chamber. Participants were asked to evaluate their
perception of the room and their own performance in each simulated acoustic
condition according to sound recordings. Listeners (n=3) were also asked to
evaluate each of these recordings. Then, listeners’ perceptions and singer perceptions were compared. Unfortunately, listeners were able to evaluate only
two of the recordings of singers. For this reason, the results were statistically
insignificant. However, according to singer perceptions, the anechoic room
19
Stetson & Braasch (2009) performed a similar study which investigated
singers’ preferences towards acoustical characteristics of five different concert halls focusing on singers’ own auditory perceptions. In this study, ten professional
classical singers (5 mezzo-soprano, 3 soprano, 1 tenor; ages 21-70) were asked to
sing in and evaluate related concert halls according to their own performance by
using a head and torso simulator capturing singers’ mouth and ears which enables a real-time auralization. Objective measurements were provided using impulse
response technique and transferred to the simulator. According to results,
regardless of the genre and singers’ positions in the stage there was a statistically strong connection between increasing preference and increasing reverberation
time.
Skirlis, Cabrera and Connolly (2005) investigated vocal effort variations in
small and large halls. In the study, eight professional opera singers were asked to
imagine a small hall and a large hall for different two sets and were asked to sing
one song excerpt, which was the final 16 bars of a traditional Italian song, in an
anechoic chamber. According to results, participants produced greater sound levels
for large hall renditions compared to small hall.
Marshall and Meyer (1985) investigated the directivity and auditory
impressions of professional singers. The study consisted of two parts. At first stage,
the directivity of three professional singers (1 soprano, 1 alto, 1 baritone) was
20
two singing volumes, full voice (fortissimo) and half voice (pianissimo). According to
their results, the floor reflection was found to be particularly important as the area
covered 2 to 5 meters in front of singers. In the second part of the study, auditory
impressions of singers were explored with experiments in hemi-anechoic
conditions. The results indicated that singers’ auditory impression was influenced by reverberation rather than early reflections.
Noson, Sakai, Sato and Ando (2000) were interested in what acoustical
changes might be crucial for singers. An on-site preliminary study was done in a
church with choir singers (bass to soprano). Singers were asked to perform two
short passages with slow and fast tempos respectively. First results showed that, for
solo performance with a slow tempo, with added reflections from speakers (10 ms
to 40 ms delay) nearly had no influence on singers’ preference. On the other hand, with a fast tempo, solo singers were affected by the presence of simulated
reflection and they preferred a delay range between 20 ms and 30 ms. Researchers
carried this study to an anechoic environment. This time, a similar study was
applied to four singers. According to the results, tempo caused no chances and the
singers preferred shorter delay times between 13-21 ms.
Noson et al. (2002), investigated the similar study with different singing
styles consisting of melisma singing (with and without lyrics). This time, six singers
were asked to sing in semi-anechoic conditions. According to the results, the
21
Ternström (1989) studied the effects of acoustics in three different rooms
consisting of a church hall with 3.90 s reverberation time (RT), a choir rehearsal
room with 0.85 s RT and a small absorbent room with 0.34 s RT. The researcher also
studied the effects of singing effort. Three different choirs consisting of a boy’s, a
youth and an adult choir participated in this study. As the youth and adult choir
were asked to perform mixed-voice versions of two different songs, the boy’s choir
was asked to produce only the melody in unison for each room with three different
singing volumes (pianissimo to fortissimo). According to long-time average spectra
(LTAS) measures, statistically significant differences were found between two songs
and singing volumes. According to their overall results, the choirs’ exerted singing effort increased in the absorbent condition which means as the reverberance
decreased, exerted singing effort increased considerably.
Hom (2013) performed a similar study to explore the effects of acoustical
and perceptual measures in two different rooms consisting of a choir rehearsal
room and a performance hall. Eleven university student choristers (4 soprano, 3
alto, 2 tenor, 2 bass) and thirty-three listeners participated in Hom’s study.
Chorister participants were asked to learn and sing a song composed for SATB
voices in each room and each song was recorded in-situ. Reverberation time
calculated for the rooms was around 2.00 s in rehearsal room (791 m3) and around
1.45 s in performance hall (1900 m3). According to their results, within the same
room, listeners’ and performers’ perceptions are different. As listeners preferred the rehearsal room, performers preferred the performance hall considering its
22
acoustical characteristics. Besides, sound pressure level differences of singers in
different rooms were statistically significant. As for the results of the survey applied
to singers indicated that singers’ individual perceived singing effort was slightly more in performance hall which had a slightly less RT than rehearsal room.
Considering the researches mentioned in this section, the majority of studies
focused on concert halls in order to determine the effects of reverberation time on
classical singers and their preferences. In addition, evaluations of the participants in
aforementioned studies were taken in anechoic conditions instead of real
environments. Only one study, performed by Blankenship et al. (1955), studied the
related subject in both real environment and in music practice rooms.
Only three studies, Ternström (1989), Skirlis et al., (2005) and Hom (2013),
examined singing effort in different acoustical conditions. Only one study, Hom
(2013), examined perceived singing effort on singers (choristers). However, no
study to date, explored perceived singing effort of individual classical singers in
music practice rooms along with how perceived singing effort influences their
preferences towards different acoustical conditions.
The aim of this study is to focus on how the perceived singing effort
influences the RT preference of classical singers upon individual singing practice
23
along with the differences of subjective and perceptual responses of classical
24
CHAPTER 3
METHOD
3.1. Design of the Study
The purpose of this study is to explore the effects of reverberation time (RT)
on classical singers’ preferences. For this purpose, three room settings with
different reverberation times were prepared in two identical practice rooms. In this
context, music practice rooms reserved for classical singers in Bilkent University
Faculty of Art Music and Performing Arts, Department of Music were chosen for the
case study.
Objective measurements such as reverberation times were measured using
computer simulation software while subjective evaluations were obtained through
a questionnaire. The group [N=30] consisted of participants from five different
backgrounds in vocal studies ; EME (early music education) students (N=6), skilled
amateurs (N=5), undergraduate singing students (N=6), graduate singing students
25
3.1.1. Research Questions
The following research questions directed the study:
1) What is the most preferable RT in a music practice room for classical
singers?
2) Is there any relationship between perceived exerted singing effort and
preference of RT in a practice room; classical singers’ perceived exerted singing
effort and their background in vocal studies in music; classical singers’ background
in vocal studies and preference of RT in a practice room?
3.1.2. Hypotheses
The hypothesis drawn was as follows:
1) The most preferable RT in a music practice room for classical singers is
around 0.6 second.
2) There is a negative correlation between perceived exerted singing effort
and preference of RT in a practice room; classical singers’ perceived exerted singing
effort and their background in vocal studies in music; classical singers’ background
26
3.2. Methodology
The study was divided into two parts: acoustical parameter measurements
using simulation software and subjective evaluations through a questionnaire and
respondent comments.
3.2.1. Objective Measurements
Two identical singing practice rooms were determined. Their dimensions
were 7.3m*5.4m*3.2m (L*W*H) and their volumes were 128 m3. Furthermore,
their dimensional ratios were 1: 1.68: 2.28. Nearest known ratio, to indicate that
the room modes are well distributed, is Sepmeyer’s (1965), 1: 1.60: 2.33. There
were absorbent panels with dimensions of 1.4m*0.60m*0.03m (L*W*H) on the
walls. Additionally there was a single window of (L*W) 0.9 m*1.2 m, a wooden door
of (L*W) 2.1 m*0.9 m, and some furniture consisting of a cabinet, table & chairs,
and a piano along with a piano stool. The only difference between these two
identical rooms was floor materials. The first one had a heavy carpet floor material
while the other one had parquet flooring.
According to a rough calculations using Sabine’s formula (Sabine,1922), the
room with carpet floor had around 0.6 s reverberation time as it was, and the other
room (with parquet flooring) had around 0.8 s, in middle frequencies (500 Hz and
1000 Hz). After calculating that the present room settings were around 0.6 s and 0.8
27
distribution and the number of absorbers on the walls of the room with 0.8 s RT.
From sidewalls, 7 absorbent panels have been homogeneously removed and set to
be staggered. Rear wall was left to be absorbent. This way the amount of
absorption was reduced as flutter echoes between parallel walls were prevented.
Therefore, as design guidelines’ and acoustical standards’ suggested (see Chapter 2) RT values in between 0.6 s and 1.0 s band were defined to have a comparative case.
Eventually, three different room settings were arranged, as seen in Figure 3,
Figure 4, and Figure 5. Their reverberation times were set to be different, from dead
condition to live condition respectively, and expected to be around 0.6 s, 0,8 and
1.0 s as a result of computer simulation results. Room setting 1 (RS1), the dead
setting, had carpet floor finishing with 23 absorbent panels on the walls. Room
setting 2 (RS2), the midway setting, had parquet flooring with the same number and
distribution of absorbent panels. As for room setting 3 (RS3), it had parquet floor
with 16 absorbent panels on the walls.
As room modes are quite important for the design of the acoustical
environment of small music rooms in rectangular shapes, the room settings were
evaluated for their geometry using an online room mode calculator before the
study. There were no axial modes multiple within 5%, and no tangential or oblique
modes overlapped in one particular frequency. As explained in Chapter 2, since
there is no certain criteria for the most well distributed room modes, one should
28
Schroeder’s widely used cut-off formula was used to determine the lowest
frequency (for more details, see Chapter 2, p. 12).
Figure 3. Photograph of room setting 1
29
Figure 5. Photograph of room setting 3
Each room setting was modelled using Timbre SketchUp 2014 and carried
out to ODEON Room Acoustics Software, version 8.5. ODEON models of room
settings are presented in Figure 6, Figure 7, and Figure 8.
30
Figure 7. ODEON model of room setting 2
Figure 8. ODEON model of room setting 3
ODEON is a room acoustics software creating and simulating real-life
environment (ex. concert & conference halls, offices, listening rooms and so on) and
31
acoustical parameters can be measured and are used in acoustical design field for
many years (Brüel & Kjaer, 2010).
However, although there was no statistical difference found between results
of real-size measurements and computer simulation, in low frequencies (below 250
Hz) the simulated values may not follow the trend of the measured values
(Christensen, Koutsouris & Rindel, 2013). The low frequency material data has a
higher degree of error due to modal effects that occur during measurement of the
absorption data (Brüel & Kjaer, 2011). For this reason, a real-size measurement via
internal e-sweep signals of DIRAC 3.0 Room Acoustics Software Type 7841 was
processed in one of the room settings to see the validity of the results in low
frequency region.
DIRAC 3.0 Room Acoustics Software measures acoustical parameters by
using a computer with soundcard and microphone and calculates the frequency
spectrum along with many acoustical parameters with impulse response technique.
Therefore, for real size measurements, the instruments used were DIRAC
3.0 Room Acoustics Software Type 7841 along with B&K Omnipower Sound Source
32
3.2.2. Subjective Measurements
Classical singers (N=30) were asked to perform a vocal warm-up exercise
,singing as high and as low as they could in each room setting in melisma singing
style (singing of a single syllable of text while moving between several different
notes in succession) with opera technique. A warm-up exercise, which is
predominantly used by classical singers, consisting of conjoined five notes, changes
according to the reference tone, was redesigned by one of the graduate singing
students from Bilkent University, Faculty of Music. Therefore, a new warm-up
exercise became more complex with conjoined nine notes. The new warm-up
exercise was also maintained as moderate in each reference sound. The participants
were also asked to sing with different singing volumes from pianissimo (softest) to
fortissimo (loudest). Reference tones were presented by the piano shortly before
producing each vocal sound. Each session per singer was completed in around 5
minutes so that they could test their perceptions in the room settings better.
To limit the study, the position and facing direction of participants were
fixed. Sound source, shown in Figure 9, in room setting represents the positions of
the participants. The position in ODEON model were arranged to be approximately
1.5 m from the ground and placed in the middle.
In order to eliminate order and learning effects, the participants were asked
to perform in random rooms every other day. Therefore, preconceived opinions
33
Figure 9. Sound source position in each room setting
Participants reported that they had been classically singing for at least 3
years and had no hearing problems. Additionally, all classical singers signed an
in-formed consent form prior to data collection for the sake of procedure.
Before beginning each session, participants were asked to fill the first two
parts of the relevant questionnaire form to collect data about their background in
vocal studies, age, and gender along with their practicing routine, concert schedule
in a year, and any previous problems they had in music practice rooms. The
questionnaire consisted of four parts. After each singing session, participants were
asked to fill the remaining two parts. In the last two parts, questions were about
their experiences in practice rooms and mainly about their perceived exerted
34
overall experience. Subjective evaluations were also collected through open-ended
comments about their experiences at the end.
The questionnaire was designed using tick boxes to make it more
user-friendly along with a Likert scale. It was also prepared in English. Since the
participants had a proficiency in English, a Turkish version of the questionnaire was
35
CHAPTER 4
RESULTS
This chapter presents results based on the research questions posed for this
study. Reported results include objective measurements, and subjective evaluations
along with statistical analyses.
4.1. Objective Measurements
4.1.1. Reverberation Time (RT)
Reverberation times (T30) for each room setting measured using ODEON
Simulation Software and they are presented in Figure 10. For spaces with such small
volumes and basic room geometry, T30 indicates better results than T20. In order to
see the difference between the results of T20 and T30, see Appendix A.
In order to see the difference of reverberation times (T30) and test the
validity of simulation results, particularly in low frequencies, room setting 2 (RS2)
36
Figure 10. Measured RT values via ODEON for each room setting
Figure 11. Measured RT values for RS2 via ODEON and DIRAC
125 250 500 1000 2000 4000 RS1 1,03 0,97 0,63 0,56 0,5 0,43 RS2 1,01 1,06 0,81 0,77 0,74 0,67 RS3 0,99 1,12 0,97 0,97 0,9 0,79 0 0,2 0,4 0,6 0,8 1 1,2 T3 0 ( S) FREQUENCY (HZ) 125 250 500 1000 2000 4000 ODEON 1,01 1,06 0,81 0,77 0,74 0,67 DIRAC 0,83 0,88 0,84 0,81 0,73 0,64 0 0,2 0,4 0,6 0,8 1 1,2 T3 0 ( S) FREQUENCY (HZ)
37
Measured RT values via ODEON and DIRAC are shown in Figure 11. As seen,
the real-size measurement results are lower than simulation results in low
frequencies (125 Hz – 250 Hz). Nonetheless, measured reverberation times in mid
and high frequencies Hz are very close (500 Hz – 4000 Hz). For extensive real-size
measurement results see Appendix A.
Surface materials in room settings and their absorptive areas (m2) are shown
in Figure 12, which presents the difference in terms of measured amount of
absorption in each room setting.
Results of RT measurements showed that Sabine calculations, which were
calculated while designing the methodology, were as expected. At this point, in
order to see if there is a statistically significant difference between RT mean values
of three different room settings, One Way ANOVA Test was run. Results indicated a
significant difference among RT data of each room setting at the p<.05 [F (2, 12) =
4.29, p=0.049]. However, this result was only valid for the frequency range between
38
Figure 12. Absorption area distributed on materials for RS1, RS2 and RS3 consecutively
39
4.1.2. Schroeder Frequency
Schroeder frequency is known to be the minimum frequency limit (see
Chapter 2) and as the study field was small rooms, Schroeder frequency was
emphasized. Therefore, the most reliable RT results for room settings could be
acquired. Relevant Schroeder frequencies were shown in the Table 3. According to
Schroeder Frequency results, to make estimations for below frequencies specified,
a deeper investigation to the modal behavior of the room setting was needed.
Table 3. Calculated Schroeder frequency values for each room setting
Room Settings App. RT values (s) Schroeder frequency (Hz)
1 0.6 s 136
2 0.8 s 158
3 1.0 s 176
Therefore, the frequency range was determined to be between 250 Hz and
2000 Hz in the 1/3 octave band considering both the Schroeder frequency as the
lowest point for each room (136 Hz for RS1, 158 Hz for RS2, and 176 Hz for RS3) and
the high-pitched sound frequency of a soprano voice (1046.5 Hz).
4.2. Subjective Evaluations
Data taken from 30 classical singers according to their experience in
different room settings were analyzed to provide a reasonable conclusion to study.
40
4.2.1. Questionnaire results
4.2.1.1. Sample group
Classical singers had six different voice characteristics consisting of bass
(N=1), baritone (N=4), tenor (N=5), countertenor (N=2) contralto (N=2),
mezzo-soprano (N=4), and mezzo-soprano (N=12) as presented in Table 4. Gender distribution of
the participants was as follows: 18 female, 12 male. The age range was between 15
to 30 years (M = 23.2, SD = 5.11). Participants’ backgrounds in vocal studies were distributed from the very first beginning of music education process to complete
professional shown in Table 5.
Table 4. Vocal types of participants
Vocal types of participants
Frequency Percent (%) Bass 1 3,3 Baritone 4 13,3 Tenor 5 16,7 Countertenor 2 6,7 Contralto 2 6,7 Mezzo-soprano 4 13,3 Soprano 12 40,0 Total 30 100,0
41
Table 5. Participants’ background in vocal studies
Background in vocal studies Frequency Percent (%) Early music education students 6 20,0
Skilled amateurs 5 16,7
Undergraduate students 7 23,3
Graduate students 4 13,3
Professionals 8 26,7
Total 30 100,0
As for the yearly concert/recital schedule of the participants and the time
they usually spend in a regular weekly routine in the music practice rooms, the data
is given in Figure 13 and Figure 14.
All the participants mentioned that they had no permanent hearing loss to
date. All participants grasped the basic concept of reverberation time and they
agreed with the statement that reverberation time was affecting their
performances as well. The majority (n=20, 66.6 %) have suffered from vocal strain
42
Figure 13. Number of concerts/ recitals participants usually perform in a year
Figure 14. Time usually spent in a week in music practice rooms
4.2.1.2. Room perceptions
The following questions were designed and addressed to the participants to
find out how they perceive 1) their signing effort, 2) the low and high-pitched notes,
0 - 2 recitals 3 - 5 recitals 6 - 8 recitals 9 or more recitals Number of concerts/ recitals
performed in a year 5 7 12 6 16.7 % 23.3 % 40 % 20 % 0 2 4 6 8 10 12 14 0 - 4 hours 5 - 9 hours 10 - 14 hours 15 - 20 hours 20 or more hours Time usually spent in a week
in music practice rooms 6 8 5 7 4
20 % 26.7 % 16.7 % 23.3 % 13.3 % 0 1 2 3 4 5 6 7 8 9
43
and 3) three major singing volumes in each room settings. Since dependent
variables in this part of the questionnaire were designed to be ordinal,
Kruskal-Wallis (K-W) H test was run to see if there is any statistically significant difference
between them in each room setting. At this point, one should know that the
Kruskal-Wallis H test does not give results about which specific groups of the
independent variable are statistically significantly different from each other. For this
reason, if there was a significant difference found with K-W, Tukey post-hoc test
was applied to see which of these groups differ from each other.
Question - How did you perceive your exerted singing effort in this room setting? This question was asked to participants in each room setting to analyze how the perceived singing effort is influenced by RT. The question offered the
following responses along a Likert-type scale: 1) much more than normal, 2) more
than normal 3) normal, 4) less than normal, 5) much less than normal.
Even though the term perceived singing effort may not have been easy to
explain, all participants were already familiar with the term. In Figure 15 and Table
6, the frequencies along with their means and standard deviations are shown.
Kruskal-Wallis H test results showed that there was a statistically significant
difference between perceived exerted singing efforts in room settings, χ2(2) =
59.22, p = 0.0001, with a mean rank perceived singing effort level of 21.47 for Room
44
test revealed that the perceived singing effort was statistically significantly different
in each room setting at p < .01 (p1, p2, p3=0.0001).
Figure 15. Perceived singing effort in each room setting Table 6. Mean and standart deviation for perceived singing effort
Room Settings Mean Standard Deviation
1 2.27 ,828
2 3.40 ,814
3 4.67 ,661
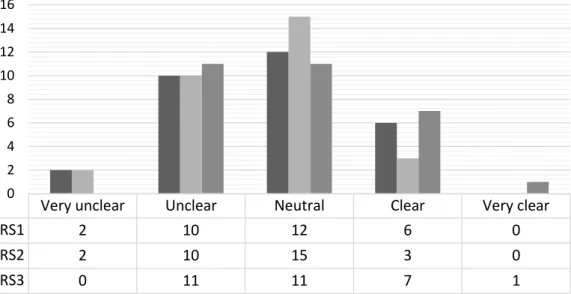
Question - How did you perceive the low notes in this room setting? The purpose of this question was to acquire insight on participants’ perception about the sound quality in the room settings. If there were any statistically significant
differences between room settings related to perceived low notes, then the actual
questions posed for this study would have biased answers from the participants.
Much less than normal Less than normal Normal More than normal Much more than normal RS1 0 2 9 14 5 RS2 2 12 12 4 0 RS3 23 4 3 0 0 0 5 10 15 20 25
45
The question offered the following responses along a Likert-type scale: 1) very
unclear, 2) unclear, 3) neutral, 4) clear, 5) very clear.
In Figure 16 and Table 7, the frequencies along with their means and
standard deviations are shown. According to K-W H test results, there was not a
statistically significant difference between perceived low notes in each room
setting, χ2(2) = 2.734, p = 0.255, with a mean rank perceived singing effort level of
44.27 for Room Setting 1, 51.30 for Room Settings 2 and 40.93 for Room Setting 3.
Figure 16. Perception of low notes in each room setting Table 7. Mean and standart deviation for perception of low notes
Room Settings Mean Standard Deviation
1 3.67 ,802
2 3.90 ,662
3 3.50 1,137
Very unclear Unclear Neutral Clear Very clear
RS1 1 0 13 11 5 RS2 0 0 8 17 5 RS3 7 0 9 6 8 0 2 4 6 8 10 12 14 16 18
46
Question - How did you perceive the high notes in this room setting? The question offered the following responses along a Likert-type scale: 1) very unclear,
2) unclear, 3) neutral , 4) clear, 5) very clear.
Similar to perceived low notes, K-W test results showed no difference
between perceived high notes between each room setting, χ2(2) = 1.584, p = 0.453,
with a mean rank perceived singing effort level of 43.75 for Room Setting 1, 50.02
for Room Settings 2, and 42.73 for Room Setting 3. In Figure 17, frequencies, and in
Table 8, mean values of high note ratings and related standard deviations are
presented.
Figure 17. Perception of high notes in each room setting
Very unclear Unclear Neutral Clear Very clear
RS1 1 3 6 15 5 RS2 0 0 7 17 6 RS3 0 4 8 12 6 0 2 4 6 8 10 12 14 16 18
47
Table 8. Mean and standart deviation for perception of high notes
Room Settings Mean Standard Deviation
1 3.67 ,994
2 3.97 ,669
3 3.67 ,959
Question - How did you perceive 1) pianissimo-paced parts, 2)
mezzo-forte-paced parts 3) fortissimo-mezzo-forte-paced parts in this room setting? The purposes of the
following three questions were to acquire participants’ perception about how they hear their own voices with different singing volumes in each room setting. The
question offered the following responses along a Likert-type scale: 1) very unclear,
2) unclear, 3) neutral, 4) clear, 5) very clear.
In Figure 18, Figure 19, and Figure 20, frequency of participants’ responses is presented for each room setting consecutively. For mean values and standard
deviations for perception of different singing volumes towards each room setting,
see Table 9.
There was no statistically significant difference between perceived
pianissimo-paced parts of the warm-up exercise in each room setting, χ2(2)=3.60,
p=0.165, with a mean rank perceived singing effort level of 40.20 for Room Setting
48
There was no statistically significant difference between perceived mezzo
forte-paced parts of the warm-up exercise in each room setting, χ2(2)=1.45,
p=0.485, with a mean rank perceived singing effort level of 47.18 for Room Setting
1, 48.08 for Room Settings 2, and 41.23 for Room Setting 3.
Figure 18. Perception of pianissimo-paced parts in each room setting
Figure 19. Perception of mezzo-forte-paced parts in each room setting
Very unclear Unclear Neutral Clear Very clear
RS1 2 10 12 6 0 RS2 2 10 15 3 0 RS3 0 11 11 7 1 0 2 4 6 8 10 12 14 16
Very unclear Unclear Neutral Clear Very clear
RS1 0 9 17 4 0 RS2 0 13 13 4 0 RS3 0 5 19 6 0 0 2 4 6 8 10 12 14 16 18 20
49
Figure 20. Perception of fortissimo-paced parts in each room setting Table 9. Mean and standart deviation for perception of each singing volumes
Room Settings Mean Standard Deviation
1 Pianissimo 2,73 ,868 Mezzo-forte 2,63 ,765 Fortissimo 2,93 ,868 2 Pianissimo 2,83 ,648 Mezzo-forte 2,70 ,702 Fortissimo 3,03 ,615 3 Pianissimo 3,13 ,973 Mezzo-forte 2,57 ,728 Fortissimo 2,83 ,648
There was no statistically significant difference between perceived
fortissimo-paced parts of the warm-up exercise in each room setting, χ2(2)=1.74,
Very unclear Unclear Neutral Clear Very clear
RS1 2 5 11 11 1 RS2 1 14 12 3 0 RS3 0 9 17 4 0 0 2 4 6 8 10 12 14 16 18
50
p=0.418, with a mean rank perceived singing effort level of 45.00 for Room Setting
1, 49.80 for Room Settings 2, and 41.70 for Room Setting 3.
4.2.1.3. Preference of room settings
Participants responded to the following question; considering your overall
experience, which room setting would you prefer for practicing? The question
offered the following responses: 1) Room setting 1, 2) Room setting 2, 3) Room
setting 3.
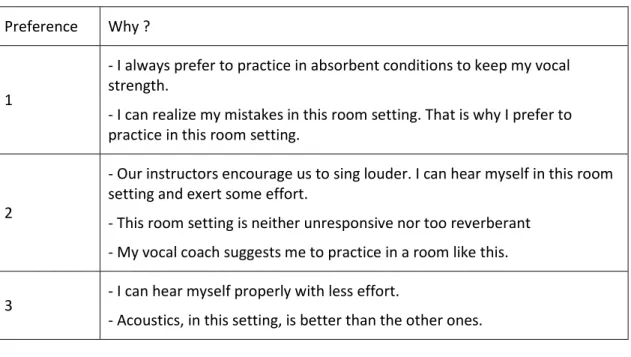
According to the results, seen in Figure 21, the most preferred room setting
to practice is RS2, which had 0.8 s RT. Most of the participants also (n=23) indicated
why they preferred practicing in the room setting they have chosen. A selection of
their answers is presented in Table 10.
Figure 21. Preference of room setting for practicing
RS1 RS2 RS3
Preference of room setting
for practicing 8 16 6 26.7 % 53.3 % 20 % 0 2 4 6 8 10 12 14 16 18
51
Table 10. A selection of the participant responses indicating why did they prefer to practice in the preferred room setting
Preference Why ?
1
- I always prefer to practice in absorbent conditions to keep my vocal strength.
- I can realize my mistakes in this room setting. That is why I prefer to practice in this room setting.
2
- Our instructors encourage us to sing louder. I can hear myself in this room setting and exert some effort.
- This room setting is neither unresponsive nor too reverberant - My vocal coach suggests me to practice in a room like this.
3 - I can hear myself properly with less effort.
- Acoustics, in this setting, is better than the other ones.
4.2.2. Statistical Analyses
Relationship between perceived exerted singing effort of the classical
singers and their RT preferences was questioned. If any, how the perceived exerted
singing effort influenced the RT preference among 0.6 s, 0.8 s and 1.0 s could be
revealed. A Rank-Biserial correlation was run to explore the relationship between
room settings and perceived singing effort. There was a moderate, negative
correlation between them, which was significant at the p < 0.01 [rrb(30) = -.614, p =
.0001]. Related correlation table is shown in Appendix D.
Relationship between perceived exerted singing effort of the classical
singers in each room setting and their background in vocal studies was questioned
52
relationship. According to this analysis, there was no correlation between perceived
exerted singing effort of the participants and their background in vocal studies at
the p < 0.01 and p < 0.05 [rs(30) = .392, p = -.162]. Related correlation table is shown
in Appendix D. Nevertheless, five variables of background in vocal studies were
recoded as two variables as unexperienced classical singers (early music education
students, skilled amateurs, undergraduate students) and experienced classical
singers (graduate students, professionals) a different result was found. In order to
achieve further results, a chi-square test of independence indicated that perceived
singing effort of the participants was associated with education level of participants
in music, χ (2, N = 30) = ,520, p < .001, Cramér’s V = .017.
Relationship between participants’ background in vocal studies and their RT preferences was also questioned. If any, how background in vocal studies influence
the RT preference among 0.6 s, 0.8 s and 1.0 s could be revealed. Once more,
Rank-Biserial correlation was run to determine the relationship between aforementioned
variables. There was a negative correlation found between them, which was
statistically significant at the p < 0.01 [rrb(30) = -.594, p = .001]. Related correlation
53
CHAPTER 5
DISCUSSION
In this chapter, the choice of methods in this study is discussed including
possible influence of methodological biases, errors on data validity. Furthermore,
the central results and potential implications are discussed. This chapter also
contains general limitations and weaknesses of the study. Overall, the results and
the methods compared with the literature, presented in Chapter 2, and final
arguments form the basis for the conclusions.
5.1. Relationship between perceived singing effort on RT preference In this study, the relationship between perceived singing effort and
preference of reverberation time (RT) in a music practice room has been
questioned. As indicated in Chapter 2, no study to date tested the influence of
perceived singing effort on classical singers’ preferences of RT. At this point, the influence of background in vocal studies on perceived singing effort and preference