Received: April 20, 2016 Revision received: August 18, 2016 Accepted: November 14, 2016 OnlineFirst: February 20, 2017
Copyright © 2017 EDAM www.estp.com.tr
DOI 10.12738/estp.2017.2.0280 April 2017 17(2) 573–596 Research Article
1 Correspondence to: Ilker Kalender (PhD), Graduate School of Education, Ihsan Dogramaci Bilkent University, Ankara Turkey. Email: [email protected]
2 Department of Education Sciences, Baskent University, Ankara Turkey. Email: [email protected]
Citation: Kalender, I., & Berberoglu, G. (2017). Can computerized adaptive testing work in students’ admission to higher education programs in Turkey? Educational Sciences: Theory & Practice, 17, 573–596. http://dx.doi.org/10.12738/ estp.2017.2.0280
Abstract
Admission into university in Turkey is very competitive and features a number of practical problems regarding not only the test administration process itself, but also concerning the psychometric properties of test scores. Computerized adaptive testing (CAT) is seen as a possible alternative approach to solve these problems. In the first phase of the study, a series of CAT simulations based on real students’ responses to science items were conducted in order to determine which test termination rule produced more comparable results with scores made on the paper and pencil version of the test. An average of 17 items was used to terminate the CAT administration for a reasonable reliability level as opposed to the normal 45 items. Moreover, CAT based science scores not only produced similar correlations when using mathematics subtest scores as an external criterion, but also ranked the students similarly to the paper and pencil test version. In the second phase, a live CAT administration was implemented using an item bank composed of 242 items with a group of students who had previously taken the exam the paper and pencil version of the test. A correlation of .76 was found between the CAT and paper and pencil scores for this group. The results seem to support the CAT version of the subtests as a feasible alternative approach in Turkey’s university admission system.
Keywords
Computerized adaptive testing • Item response theory • University admission examinations • Validity • Classification
Ilker Kalender1
Ihsan Dogramaci Bilkent University Giray Berberoglu
2
Baskent University
Can Computerized Adaptive Testing Work in Students’
Admission to Higher Education Programs in Turkey?
The Challenges of the Admission System
University admission is as an extremely important issue in countries whose higher education programs have limited capacity. As a typical example, university admission in Turkey is extremely competitive because of higher education being in such high demand while also being of limited capacity relative to applicants. Although the number of potential students taking the high stake two-stage university examination continues to increase each year, only 1/3rd of them are selected and placed in higher education programs. For example, in 2015, while 2,126,684 students applied for university admission, a mere 983,090 were actually placed in a four year higher education program (Measurement, Selection and Placement Center [MSPC], 2015). Basically, the Higher Education Transition Examination (HETE) and Undergraduate Placement Examination (UPE) are paper-based tests (PBT) used in Turkey’s university admission process. The HETE is used to screen and select students for the second stage. Containing Quantitative and Verbal sections, the HETE focuses on students’ ability to use basic concepts and principles learned during their previous years of formal educational. In order to take the UPE, students’ HETE scores should pass a specific cut-off score. Thus, since the bulk of students take the HETE, it represents one of the major challenges both for students and test administrators. While passing the cut-off score is students’ major concern, test administrators are more concerned with the test being administrated in a secure and standard manner for such a large group.
Such a high demand for university education renders the selection process quite challenging in Turkey. The greatest problem is the stress and anxiety that students experience during their senior year in high school since they have only one chance per year to be admitted into a university. High school graduates lose one year in their educational career if their HETE scores do not pass the cut-off or if their UPE score is insufficient to place them into a university program. In such an event, one usually retakes the examination the following year, causing a tremendous increase in the number of students taking the examination each successive year. In 2015, for instance, of the entire 2,126,684 individuals taking the HETE test, only 891,090 had graduated high school that year and the rest consisted of those students who had previously failed the examinations (MSPC, 2015). Such a large group being tested on the same day and at the same time creates a major problem in ensuring test security. Acting as venues for the test’s application, school buildings’ facilities as well as the necessary personnel to monitor the examination are two other major issues in need of attention. Another issue requiring attention is related to the confidentiality of the test content. Since students, parents, and school teachers are greatly concerned about the questions used on the test forms, it is not possible to keep them absolutely confidential. Test questions had been officially released to the public until 2012, after which only a small portion of the questions have been released by the MSPC each year. Yet, the remaining questions are leaked out to the public by test takers taking
the test simply to make them available to the public. Even more recently, the center has begun to release all of the the items used in the admission tests based on the order of court. Thus, since test questions are known by the examinees before the actual test, another potential problem is equating test scores from one year into another (Berberoglu, 2012; Kolen & Brennan, 2004).
In Turkey, university candidates come from various educational and family backgrounds. First of all, there are different types of high schools within the Turkish educational system, with some being more privileged and representing groups of higher ability. On the other hand, public schools are more heterogeneous in terms of students’ ability distributions, socioeconomic, and cultural backgrounds. Testing such a heterogeneous group hardly meets the requirement to match examinees’ abilities with the test’s difficulty level, especially in STEM related fields. In 2015, for example, out of the 40 science questions on the HETE, an average of 3.9 questions were correctly answered by students. This result clearly justifies a floor effect in this particular subtest (Allen & Yeng, 1979; Hessling, Schmidt, & Traxel, 2004).
It seems that such low achievement in the science subtest might be partly related to insufficient educational practices in science courses in Turkey and to the failure in matching the questions’ diffciulty with students’ abilities. On the other hand, the group being tested for university admission is so heterogeneous that it is quite difficult to achieve this match through traditional PBT administration. Weiss (2011) mentions the difficulty in matching fixed-length tests, pointing out that reliability is obtained only around a certain ability level and decreases for ability levels outside of this range. As a result, therefore, of the mismatch between the difficulty of the test and the ability distributions of the students (Lord, 1980), the floor effect observed in the HETE seems far from the best measurement practice. It seems quite difficult to construct a PBT of appropriate difficultly level for all the examinees taking the test. Considering the volume of the university applicants in Turkey, matching test difficulty with the participants’ ability seems to be a great challenge for the test developers.
In sum, there are issues in the existing university admission system in Turkey related to test administration procedures and the psychometric properties of the test scores. On the other hand, student anxiety while taking the tests once a year is another important concern among educators. There is a need to reform the university admission examinations in Turkey, and it seems that Computer Adaptive Testing (CAT) may be quite promising in solving the current problems faced mentioned above.
Is Computerized Adaptive Testing a Possible Solution?
With the advancement in both computer technology and psychometric theories, computers have become an important tool for testing (Weiss, 2011). At the beginning,
computers were used to deliver the same test to all the examinees in a lineer test format (Schaeffer, Steffen, Golub-Smith, Mills, & Durso, 1995). In this format, only the test delivery was different than PBT (Wang & Shin, 2010). On the other hand, the CAT changed the entire paradigm of testing in which it tailors the test content to each test taker (Lord, 1980). Although the idea of tailoring test content to individuals can be traced back to Binet and Simon (1905), it was Weiss (1973) who first proposed the idea of “computerized” testing. CAT seems to have many advantages related to testing practices that could help solve the problems cited above for the Turkish university admission system. First of all, CAT matches individuals’ ability levels with test difficulty, thereby providing higher reliability using fewer items compared to PBT versions (Mardberg & Carlstedt, 1998; Moreno & Segall, 1997; Wainer, 2000; Wei & Lin, 2015; Weiss, 1973). CAT also provides standard error of score estimation conditional on ability level rather than the sample dependent, overall reliability statistic because of Item Response Theory (IRT) (de Ayala, 2009; Embretson & Reise, 2000). It is also possible to administer CAT on demand, which may reduce the anxiety experienced by Turkish students in the university admission if more than one chance is given to take the tests in a single year (Glas & Van der Linden, 2001). It is also more efficient to pilot the new test items during adaptive test administration. Moreover, based on the scaling techniques used in constituting the item bank, the results of the test administrations are comparable among individuals and over different years. Furthermore, the limitations of PBT in terms of item format could be overcome by CAT administration. New item formats, such as interactive items, multimedia items, etc., might effectively be used in CAT administration. There are also a number of practical advantages of CAT, such as in scoring the performance as well as in not needing to printor transporttest booklets
when the tests are administered (Hambleton & Swaminathan, 1985; Rudner, 1998;
Sands, Waters, & McBride, 1997). Individualized test administrations of CAT may also bring greater control over test security since a computer records a wide range of data, such as response time and test takers’ behaviors, during the test administration process (Hambleton & Swaminathan, 1985; Lord, 1968; Rudner, 1998; Sands et al.,
1997). Moreover, there are also copying or collusion detection methods applied for
CAT administrations (Wise & Kong, 2005).
Considering all the advantages, CAT seems promising in solving the current problems in Turkey’s admission system, especially its psychometric problems. Thus, in the present study, the researchers are interested in the applicability of CAT administration in the Turkish university admission system.
Score Comparability in CAT
When the current PBT method is replaced by CAT administration, score
2000). Comparability between different versions of a test cannot be naively assumed, and fairness should be examined since the CAT may provide significant differences in the testing paradigm (Wang & Kolen, 2001). Both the effect of change in the medium of administration and overall paradigm should be considered on score comparability between PBT and CAT versions of the same test. It is evident that in some instances, there might be problems in the ability to compare the CAT and PBT results because of differences in scoring procedures, testing conditions, and examinee characteristics (Kolen, 2000). Schaeffer et al. (1995) conducted a study on GRE scores in which they revealed no comparability between scores obtained from the two testing modes. Similar results were also reported by Paek (2005), Vispoel, Rocklin, and Wang (1994), Wang, Jiao, Young, Brooks, and Olson (2008) for adaptive testing administrated in K-12 and college level testing programs. Wang & Shin (2010) stated that administration mode is an influential factor needing investigation across CAT and PBT, also pointing out that score comparability from different administrations of a test should be fully satisfied. The comparison between CAT and PBT includes reporting descriptive statistics, such as central tendency and dispersion measures, rank orders, and the validity and reliability evidence for the test scores. Wang and Kolen (2001) extended the comparisons to the reduction rate CAT provides over PBT and some correlational studies with external and internal criteria. It seems that for CAT, the validity of the test scores becomes a major issue requiring attention so that it may be effectively used as a viable alternative to traditional PBT. Score comparability between PBT and CAT was also noted by various professional organizations, such as the American Psychological Association (APA), the American Educational Research Association (AERA), and the National Council on
Measurement in Education (NCME) (AERA, APA, & NCME, 1999, 2015). Thus, score
comparability is the major issue for any CAT program proposed to replace existing conventional test administration, since similar results produced by two administration modes are used to defend CAT over the existing test practice in public. This study focuses on whether the CAT version of the HETE produces similar results as the current PBT format. As was stated above, the HETE is basically used for screening purposes and the major interpretation is students’ rank. Thus, whether students are ranked in the same way in both CAT and PBT versions is important in this comparison for the validity of the admission since similar ranks may be used as evidence to defend the adaptive version of the existing PBT administration.
When designing a CAT or transferring a paper-based test into a CAT format, there are several issues needing consideration, such as item bank characteristics defining a starting rule, the method used to select items and estimate ability, and test termination rules (Weiss, 2011).
In the literature, in order to understand the differences between two testing procedures, computer simulation studies are conducted based on the parameters
estimated on simulated or real data sets. As a common approach, computer simulations are regarded as an invaluable tool, especially for CAT related research questions. Although they have been used in the natural sciences for a long time (Metropolis & Ulam, 1949), they are relatively new in educational sciences (de la Torre, 2009; de la Torre & Douglas, 2004; Harwell, Stone, Hsu, & Kirisci, 1996; Nydick & Weiss, 2009). Two types of simulations are mainly used in the educational sciences: (i) Monte-Carlo simulations and (ii) Post-hoc simulations. The former type uses produced model-based responses generated by a computer algorithm whereas the latter is designed to simulate environments using actual responses of individuals in a real test. Since Monte-Carlo studies provide a higher level of control in setting the parameters, they are used to investigate the effect of changing parameters on a CAT performance. On the contrary, post-hoc simulations are typically used to examine how individuals would perform in a CAT by assuming that individuals exhibit the same response patterns in CAT as they do in the PBT version of a test (Wang, Pan, & Harris, 1999; Weiss, 2005). Post-hoc simulations provide a realistic representation of test takers’ behaviors. Moreover, they also provide a better representation of the factors stemming from testing conditions, which are not easy to simulate completely, such as speediness and guessing (Thompson & Weiss, 2011; Wang et al., 1999). Simulations based on real data sets are the general approach used to determine optimal CAT design (Eignor & Schaeffer, 1995; Segall, 1995) and are considered as an initial step prior to live testing (Weiss, 2005). Furthermore, using simulations based on real data sets is the general approach adopted in the related literature when attempting to determine the optimal CAT design (Eignor & Schaeffer, 1995; Segall, 1995). Thus, in the present study, both simulation based analysis and live test administration were carried out to investigate the best approach to be used in Turkey’s university admission system. In the first phase of the study, a set of post-hoc simulations was carried out in order to investigate whether the CAT based ability estimations were obtained within (i) fixed standard error (SE) threshold and (ii) if a fixed number of items produced similar results. The similarity of the results between two termination rules were studied using correlational techniques, differences in reliability estimates, and classifications of the students at different percentiles. All the comparisons were carried out across three different ability strata as determined by school types. In the second phase of the study, based on the findings in the simulation, a live CAT administration was carried out with a group of students. In this phase, the scores of the students previously taking the admission test’s PBT format were correlated with their scores estimated on the CAT version of the same assessment. Also, ability estimations on these two administration modes were compared in the individual student level. It is expected that this study provide useful evidence regarding the usability of the CAT version of Turkey’s HETE test.
Method
The results of the CAT and PBT tests were compared across a series of post-hoc simulations based on real test takers’ responses to test items in previous years. In the simulation, students’ real response patterns were used as if they were responding to the CAT version of the test under various conditions of termination rules based on post-hoc simulations (Nydick & Weiss, 2009).
Instrument
In the present study, the science subtest of the HETE was used. This particular test is considered to test general ability since it assesses examinees’ ability to use
basic concepts and principles covered in their K-12 science education (MSPC,
2015). Assessing students’ higher order cognitive processes rather than their ability to retrieve information, the science subtest used in the simulation consisted of 45 multiple choice items with five alternatives. As an external criterion, the HETE’s mathematics subtest scores were also used to compare whether CAT based ability estimations were correlated in a similar way with those of the PBT version’s mathematics subtest scores.
Sample of the Study
In the Turkish educational system, there are different types of high schools. Public schools, Anatolian High Schools, and Private Schools host the majority of Turkey’s students. These three types of schools were used in the sample of the present study. Whereas both Anatolian and Private Schools select their students at the end of 8th grade, public schools do not. In order to understand how CAT administrations function in such a segregated system, school type was taken as one of the variables in the simulation. A total of 5,000 students who had taken the admission tests were randomly selected from each school type in the data base. A total of 15,000 students constituted the sample of the study in the simulation. For the live CAT session, a sample of 37 students who had volunteered to take the CAT version of the test was used.
Estimation of Item and Ability Parameters
Students’ responses to the science section of the PBT version of the HETE test were used to conduct an IRT analysis (Baker & Kim, 2004; van der Linden & Hambleton,
1997). Students’ raw scores on the mathematics subtest of the HETE were used as
external criterion. Preliminary analyses showed that all-zero response patterns were quite common in the HETE data set. When all-correct or all-incorrect response patterns constitute a problem, it is suggested that Bayesian approaches be used (Weiss, 2011). Thus the scaling was carried out using the Bayesian Expected A Posteriori (EAP) estimation method instead of the Maximum Likelihood estimation method since the
former method does not create a problem in estimating the abilities of those who score zero and perfect scores (Birnbaum, 1968; Bock & Aitken, 1981; de Ayala, 2009; Gu & Reckase, 2007; Samejima, 1969; Veerkamp & Berger, 1997). Also, EAP method produces ability estimates with lower standard errors (Vang, 1997).
A factor analysis of the tetrachoric correlation matrix via TESTFACT for all science items produced eigenvalues of 21.17, 1.78, 1.45, 1.15, and 0.83 throughout the factors. The sharp decrease from the first to the second eigenvalue is used as evidence to consider a unidimensional trait in the group of items used for the post-hoc simulations (Wilson, Wood, & Gibbins, 1991). Item and ability parameters of the PBT were estimated using a 2 parameter logistic model since all of the items fit the model, as assessed by χ2 tests and fit plots produced by Bilog-MG (de Ayala, 2009; Embretson & Reise, 2000; Hambleton, Swaminathan & Rogers, 1991; Zimowski, Muraki, Mislevy, & Bock, 1996). An item calibration was run for all the students coming from the different school types. The means (and standard deviations) of the item difficulty and discrimination parameters for the science test were 1.659 (0.661) and 0.869 (0.188), respectively. Table 1 indicates the means and standard deviations of ability estimations along with the minimum and maximum values in the science subtest across different school types.
Table 1
Descriptives for Ability Estimates of IRT-based on Full-Length PBT
Public Anatolian Private
Mean 0.07 1.32 0.78
SD 0.92 1.18 1.29
Minimum -2.33 1.08 0.57
Maximum 1.05 2.32 1.19
As it is seen from Table 1 students have different ability levels depending on the school they attend. Anatolian high school students represent the highest ability strata whereas public high schools represent the lowest.
Simulation Design
In order to ascertain the best approach in CAT, different test termination rules were used in the simulations (Babcock & Weiss, 2009; Bock & Aitken, 1981; Nydick & Weiss, 2009; Raîche & Blais, 2002; Samejima, 1969). Essentially, there are two test termination rules: (i) fixed number of items, which delivers every individual with an equal-length test, and (ii) standard error of ability estimation threshold, which stops test administration when the SE of an ability estimate is lower than a pre-determined error rate. As a result of this rule, test length varies for each individual. The most
comprehensive study on test stopping was done by Babcock and Weiss (2009) who
examined a wide variety of termination rules on different item banks. Their results indicated that while standard error threshold-based rule performed well, performance
of the rule based on fixed number of items was relatively low in terms of root mean squared error. Due to the above-stated reasons, the Bayesian EAP procedure was used to estimate individuals’ ability in all simulations.
For each of the test termination rules, different conditions were applied. For threshold of standard error two different levels were used; namely, 0.30 and 0.20. The fixed length test item stopping rule was also studied at three different levels; at 23%, 33%, and 55% of the full test length. These correspond to a test length of 10, 15, and 25 items, respectively. The series of post-hoc simulations were carried out using these two test termination rules across the school types.
Using maximum information as an item selection method in CAT not only provides the best match between ability and item difficulty, but also results in greater precision
with fewer items (Wainer, 2000). In the simulation design, items were selected
based on Fisher’s maximum information. This particular approach is defined as the most efficient item selection algorithm since it selects the item that minimizes the standard error of an examinee’s ability estimation while also effectively maximizing test information for the examinees (Han, 2012; Thissen & Mislevy, 2000; Veldkamp & Matteucci, 2013). Moreover, using item information to match the ability with difficulty becomes more crucial, especially if the item bank is quite narrow in terms of the number of items it contains, as in the case of the present study. It is expected that fewer items selected based on the maximum information will result in improved precision in estimating the students’ abilities in the post-hoc simulation.
The algorithm of the post-hoc simulation was as follows: (i) The initial ability estimation was set to 0 for all examinees, (ii) CAT software randomly selected an item with difficulty indexes between -0.05 and +0.05 as these are considered moderate difficulty levels, (iii) the software checked the student’s responses from the PBT data set, (iv) based on the student’s response, the software estimated an ability and picked another item for the estimated ability level using maximum information function, (v) based on the examinee’s response to the selected item, the CAT procedure continued to select items based on maximum information, and (vi) the simulation stopped when the above-mentioned test stopping criterion was met. The software used for the post-hoc simulation was developed using the Delphi platform, Object Pascal (Kalender, 2015).
As seen from step one, the simulation started with a randomly selected item at moderate difficulty level. This is a rather arbitrary starting point, and the item used to start the CAT procedure may change if the same individual were to be reconsidered in the CAT simulation. Thus, in order to understand if this starting procedure results in any bias to the ability estimations, after the CAT simulation was replicated a hundred times for each individual for each stopping rule, the mean of the ability estimations were used in the analyses.
Comparison of CAT and PBT Results
CAT and PBT were compared with respect to differences in the ability estimations, item reduction rate according to the fixed SE test termination rule, and the reliabilities obtained using the fixed test length test termination rule. After this, the correlations were assessed between ability estimates obtained in CAT with the ability estimate obtained in the PBT versions of the science subtest. The ability estimations obtained from the CAT and PBT versions of the test were correlated with mathematics test scores, as an external criterion. Finally, the proportions of students who were similarly classified across CAT and PBT in the top 10th, 25th, and 50th percentile groups were also compared (Babcock & Weiss, 2009; Wang & Kolen, 2001).
After the post-hoc simulation, a live CAT administration was carried out with a group of students from the higher ability strata. A total of 37 students who had already taken the paper and pencil version of the HETE took the CAT version of the same test using a 242-item bank. This test was compiled from the older science subtests of the HETE. In this particular analysis, the results of the PBT and CAT estimations were correlated and the ability estimates with respect to their magnitudes were also compared.
Findings Post-hoc Simulations
Table 2 below indicates the mean ability estimations obtained with their standard deviations for each stopping rule and school type.
Table 2
Mean (Standard Deviations) of the Ability Estimations as a Result of Replications
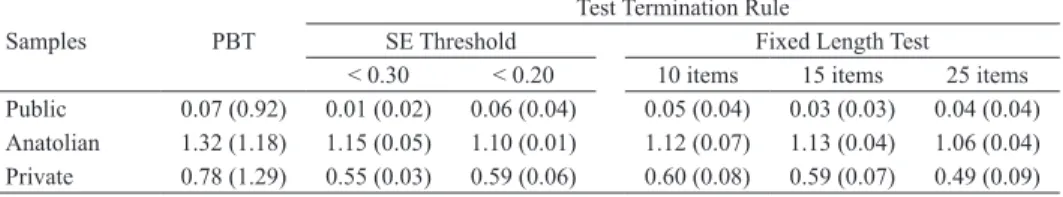
Samples PBT
Test Termination Rule
SE Threshold Fixed Length Test < 0.30 < 0.20 10 items 15 items 25 items Public 0.07 (0.92) 0.01 (0.02) 0.06 (0.04) 0.05 (0.04) 0.03 (0.03) 0.04 (0.04) Anatolian 1.32 (1.18) 1.15 (0.05) 1.10 (0.01) 1.12 (0.07) 1.13 (0.04) 1.06 (0.04) Private 0.78 (1.29) 0.55 (0.03) 0.59 (0.06) 0.60 (0.08) 0.59 (0.07) 0.49 (0.09)
As seen in Table 2 replications produced narrow distributions in abilities as evidenced by the small standard deviations. This could be evidence for supporting CAT’s precision in estimating abilities. However, differences between the SDs between PBT and CAT could indicate that the two formats produce different ability distributions. Table 3 presents the differences between CAT and PBT’s ability estimations (CAT estimations were subtracted from PBT estimations). The ability differences in Table 3 indicate that CAT produces higher estimations for Anatolian and private schools than does PBT. Estimates in individuals in public schools are close to 0, indicating that CAT and PBT estimate ability to a similar degree.
Table 3
Mean Differences between PBT and CAT Ability Estimations
Samples
Test Termination Rule
SE Threshold Fixed Length Test
< 0.30 < 0.20 10 items 15 items 25 items
Public 0.06 0.01 0.02 0.04 0.03
Anatolian 0.17 0.22 0.20 0.19 0.26
Private 0.23 0.19 0.18 0.19 0.29
Table 4 illustrates the number of items used in CAT simulations using different SE threshold termination rules across different school types.
Table 4
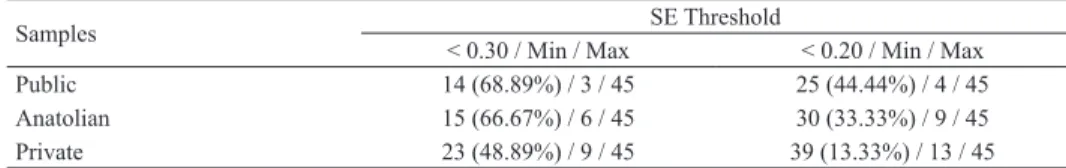
Means of the Number of Items used in CAT (Percentage of Reduction in Number of Items Compared to 45 PBT Items)
Samples SE Threshold
< 0.30 / Min / Max < 0.20 / Min / Max Public 14 (68.89%) / 3 / 45 25 (44.44%) / 4 / 45 Anatolian 15 (66.67%) / 6 / 45 30 (33.33%) / 9 / 45 Private 23 (48.89%) / 9 / 45 39 (13.33%) / 13 / 45
As expected, as the number of items used increases, SE values decrease. The lowest reduction rate was obtained in private schools while the highest was observed in public schools. It seems that the reduction rate decreases as students’ ability levels increase.
The magnitudes of SE threshold values for fixed test length CAT formats were examined for tests containing 10, 15, and 25 items. The results of this analysis are presented in Table 5.
Table 5
Mean SE Values (% of Individuals with ability estimations below an SE of 0.30) for Fixed Test Length CATs
Samples 10 items Fixed Length Test15 items 25 items Public 0.43 (36.40%) 0.36 (41.80%) 0.25 (54.50%) Anatolian 0.39 (16.10%) 0.34 (39.60%) 0.30 (50.70%) Private 0.43 (7.10%) 0.38 (23.90%) 0.32 (41.60%)
As seen in Table 5, mean SE values of 0.30 or higher were obtained for tests containing 10 and 15 items, indicating such tests to be relatively lower in their reliability to estimate ability compared to tests using the SE threshold termination rule. For a fixed threshold value of 0.30, an average of 17 items was used to terminate the test across school types. SE values’ mean were obtained between 0.34 and 0.38 across the school types for the test containing 15 items. Using the fixed test length termination rule, SE estimations were observed to decrease as the length of the test increased, as expected. Even the highest SE threshold mean of 0.43 provides a Cronbach’s alpha reliability coefficient of .82, which is quite high.
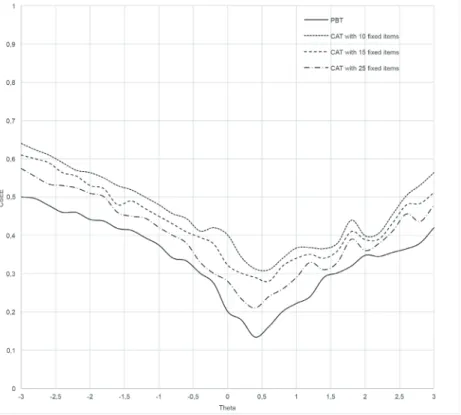
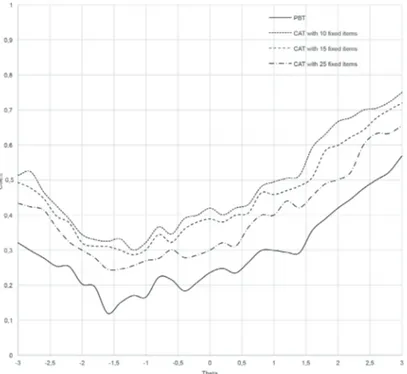
Figures 1, 2, and 3 show the conditional standard errors of estimations (CSEE) produced by fixed-length CATs containing different numbers of items and by PBT with an increment of 0.1 between theta levels of -3.0 and +3.0. PBT produced the lowest error rates across the entire ability continuum. However, errors estimated by fixed-length CATs containing 25 were very close to those made by PBT. In public schools, PBTs seemed to produce highly reliable ability estimates (SE of below 0.30) for a limited range of abilities (-0.5 and 1.5). On the other hand, the SE values increased significantly outside of this range. The PBT produced successful matches for a larger range of ability levels with SE values below 0.30 for both Anatolian and private schools. They were between -2.8 and 1.5, and between -1.3 and 1.5, for Anatolian and private schools, respectively. When the errors produced by CAT were examined, it was seen that while only the fixed-length test containing 25 items was able to produce ability estimates with an SE of less than 0.30, the range of ability was still narrower than the PBT. Ability estimates by fixed-length CATs containing 10 and 15 items were above the 0.30 threshold. An SE value of 0.30 may be criticized as being too strict of a reliability threshold. If a more liberal SE threshold were used, such as 0.40, CATs may produce reliable ability estimates for the larger ability ranges, as can be seen from the figures included.
Figure 2. CSEE of ability estimations for PBT and CAT in Anatolian schools.
In the present study, the ability estimations obtained for all the test termination criteria were correlated with the ability estimations obtained from the full PBT test. Table 6 gives the Spearman correlations of ability estimates between CAT and PBT tests across all conditions. All the correlations presented in Table 6 were significant with an Alpha level of .05.
Table 6
Correlations of Ability Estimates between PBT and CAT Versions for the Science Subtest
Samples
Test Termination Rule
SE Threshold Test Length
< 0.30 < 0.20 10 items 15 items 25 items
Public .91 .91 .88 .90 .93
Anatolian .93 .96 .91 .91 .95
Private .90 .93 .85 .88 .90
Since the test items used in CAT consist of the subtest of the same science test, it is natural to have high correlations in these particular comparisons. Independent of the termination criterion, CAT produced highly correlated results with the ability estimations obtained from the PBT.
As an external criterion, the mathematics raw subtest scores on the HETE were used to validate CAT’s ability estimations obtained using different test termination rules. The correlations between the abilities estimated on the full PBT versions of the science subtest and mathematics subtest raw scores were .83, .68, and .77 for public, Anatolian, and private high schools, respectively. Table 7 indicates the correlations of CAT’s ability estimations with the mathematics subtest scores for all the test termination criteria. All the correlations presented in Table 7 were significant with an Alpha level of .05.
Table 7
Correlations between CAT Ability Estimations and the External Criterion of Raw Scores on the Mathematics Subtest
Samples
Test Termination Rule
SE Threshold Fixed Test Length
< 0.30 < 0.20 10 items 15 items 25 items
Public .73 .73 .75 .75 .74
Anatolian .66 .66 .67 .67 .67
Private .74 .75 .69 .72 .75
Compared to the correlations obtained for the full test length, slightly lower correlations were obtained with the mathematics subtest scores when ability estimations obtained in CAT were considered. On the other hand, the correlations were not lower than .65 for any of the different test termination rules. As a final comparison, both CAT and PBT’s ability to consistently classify students was studied. Table 8 indicates the percentages of students who were similarly classified into the 10th, 25th, and 50th percentile groups based on CAT and PBT ability estimations.
Table 8
Rates of Correctly Classified Students by CAT as PBT
Samples from the TopGroup Size
Test Termination Rule
SE Threshold Fixed Test Length 0.3 0.2 10 items 15 items 25 items Public 10%25% 0.780.81 0.800.84 0.880.88 0.890.91 0.880.96 50% 0.87 0.91 0.89 0.93 0.96 Anatolian 10% 0.99 0.99 0.69 0.74 0.85 25% 0.99 0.99 0.97 0.98 0.99 50% 0.70 0.74 0.78 0.86 0.94 Private 10%25% 0.990.94 1.000.98 0.800.86 0.880.88 0.970.91 50% 0.94 0.98 0.91 0.95 0.93
Almost all of the classifications are above 80% in Table 8. In some instances however, like for public schools, using a SE threshold may provide less commonly classified students compared to the other school types. SE threshold provided stable classifications for higher ability groups. Toward the top 10%, the ratio of commonly classified students increased when test termination rule was used. On the other hand, the fixed-length test provided relatively more stable and better results for public schools. Moreover, for the higher ability groups near the top 10%, relatively fewer students were commonly classified when the fixed-length test termination rule was used. However, classifications were also observed to become more stable as test length increased when the fixed-length test termination rule is used. It seems that in the present study, ability distribution and termination criterion are related when classifying students with respect to different percentiles.
Although item exposure rate was not controlled for in this study, all the items were used in 45% of the simulations on average (between 6% and 79%), and 53% of the live CAT (between 9%, and 72%).
Live CAT Administration
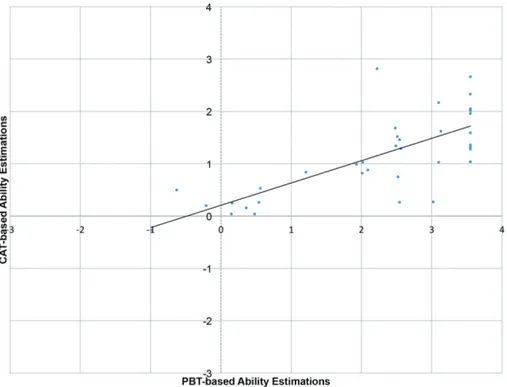
In the live CAT administration, a SE threshold of 0.30 was used as the test termination rule since this approach produced more defendable results in the simulation. Thirty-seven students answered the CAT version of the science test with an item bank totaling 242 items. An average of 14 items was used to terminate the CAT administration, with the minimum amount being 4 and the maximum 30 items. The scattergram of ability estimates between PBT and CAT was found to be .764 (p < .05) (see Figure 4), and standard error was estimated to be 0.28, on average whereas the PBT produced a standard error estimation of 0.466, on average.
As seen from the Figure, CAT produced relatively lower ability estimations than did the PBT version. CAT seemed to be more difficult, as evidenced by significantly
lower mean differences: MCAT-MPBT = -5.435, t(35) = -5.435, p < .001. For all except two students, ability levels were estimated with a SE level below 0.30. However, the ability estimates for these 2 students were not above 0.40, which is still an acceptable reliability level.
Figure 4. Scattergram of Ability Estimation from CAT and PBT. Discussion
University admission in Turkey is overburdened as a result of the ever increasing number of applicants with high levels of test anxiety. There are also flaws in test and item scores’ psychometric properties. The CAT version of the admission tests has been seen as a possible alternative approach to solve the problems faced in the existing PBT system. For this purpose, the science subtest was used to understand whether the CAT version of this particular subtest produced similar results with the PBT.
In general, the results supported the use of CAT in the admission system since it seems to serve a similar function as the science test on the PBT version. In the CAT simulations, the use of different test termination rules did not produce remarkable differences. Compared to the fixed SE threshold test termination criterion, a fixed length test provided slightly greater errors. On the other hand, with respect to the correlations with the criterion measures, no matter which test termination rule was used, different CAT procedures produced similar results. Since CAT used any subtest
from the full test in the post hoc simulation, it is natural for there to be high correlations between CAT and PBT’s estimated abilities (Forbey & Ben-Porath, 2007).
In CAT, smaller standard errors in ability estimations containing fewer items is expected (de Ayala, 2009; Embretson & Reise, 2000). The simulation results indicated that CAT reduces the number of items used for all termination rules. Among all the test termination criteria, an SE threshold value of 0.30 produced the most defendable results since this approach estimated abilities using an average of 17 items across all the school types. Although the comparable error rates were obtained between fixed-length tests containing 25 items and fixed SE criteria, using a fixed number of items left many examinees with ability estimations above pre-defined precision levels.
Closer examination of CSEEs provided further evidence for this problem. CAT was able to produce ability estimates with standard errors below 0.30 only for fixed-length tests containing 25 items and only within a limited range of ability. Fixed-length CATs containing 10 and 15 items yielded almost no ability estimations with a SE of less than 0.30. It can therefore be concluded that too much of a reduction in the number of items given to an examinee may result in the inability to reliably estimate ability. However, fixed-length CATs containing more items and/or with SE values of below 0.40 and 0.50 remain promising. Actually, the inability to reliably estimate ability was somewhat expected in this study. Since the simulations used an item pool consisting of 45 items, only a limited number of available items were able to be used on the CATs and were insufficient to cover the entire ability continuum. In other words, there were too few items to be used for much of the ability levels. Due to this problem, it was not possible to select the most informative items targeting specific ability levels. Rather, items with lower information at a given ability levels should have been used in the simulations. A larger item pool composed of a broad range of difficulty levels may help to improve CAT so as to render it able to produce reliable ability estimates along the continuum, thereby revealing the true potential of CAT.
The test’s content validity could be criticized since using an average of 17 items may jeopardize the sampling of the objectives in the curriculum. Yet, as previously explained, the science test is more of a unidimensional measure of students’ ability to deal with scientific concepts and principles (MSPC, 2015). In this particular test, items are defined with respect to the cognitive skills being assessed rather than subject matter content. Thus, considering the higher order cognitive processes covered in this particular test, content sampling could be considered in line with different cognitive skills rather than learning outcomes related to content specific subject matter. This test is basically designed to rank students and the CAT rankings students in a similar manner supports the notion that CAT serves its purpose. Moreover, the correlation between CAT ability estimates and the external criterion of mathematics subtest scores also provided supporting evidence for the use of CAT to estimate ability. This correlation could be
considered as another piece of evidence validating CAT’s ability estimations. When the magnitudes of correlation coefficients are considered for the both PBT and CAT ability estimations and mathematics subtest scores, not only are the differences quite negligible, CAT also estimated abilities using fewer items and predicted mathematics achievement as well as the PBT. This finding therefore supports the validity of CAT’s ability to estimate ability, which is no lower than the full test length. The increase in reduction rate is somehow linked with students’ ability levels. Among the school types considered, the highest ability level was in Anatolian high schools and the lowest in public schools. The greater reduction rate was obtained in public schools. Fewer items can be used to estimate the students’ abilities in this school type compared to students in other school types. The reason might be due to the difficulty level of the item bank. As previously explained, the science test is rather difficult for students attending public schools. It is also known that there is a greater tendency for low ability groups to make blind guesses on multiple choice items. This might therefore create aberrant response patterns in this particular group, forcing the CAT to after fewer items have been asked. Having greater error rates when using the fixed length test termination criterion supports the aberrant response patterns behavior that might be observed in this particular group (Babcock & Weiss, 2009). It could be said that there is still a problem matching students’ ability and test item difficulty for public schools.
The major concern in the CAT simulation was to predict the PBT results using different test termination rules while also obtaining similar student rankings with the PBT test results (Thompson, 2007). The question in this respect is whether the full test ranking is estimated in a similar manner with CAT versions (Wang & Kollen,
2001). Since students’ ranks are important in the HETE, CAT’s ability to classify
students similarly across different ability strata is an important issue within the university admission system in Turkey. It seems that almost all the test termination criteria provided defendable classification rates compared to the PBT’s results. However, there are also some slight differences in the agreement of classifying students between the CAT and PBT versions. First of all, while classifying students at different percentiles, the ability level and test termination criterion rules seemed to interact with each other. In the public schools, the SE threshold exhibited less agreement with the PBT version. On the other hand, agreement is quite high between the CAT and PBT versions of the test for high ability groups. This could be explained by the number of items used in public schools when a fixed SE threshold was used. Compared to other school types, an average of 14 items was used in the public schools. Moreover, there is an obvious mismatch between ability level of this groups and test items’ difficulty level. The mean theta in this group was 0.07 and the mean item difficulty in the science subtest 1.66. In general, it could be said that although there are slight differences in terms of the classification agreement, almost all of the CAT procedures provided defendable results compared to the PBT version of the test.
The live CAT administration produced a correlation that was not as high as in the simulation studies. In the present study, the correlation between the two types of tests is more than moderate. The major concern concerning the live CAT administration is its relatively smaller ability estimations compared to the PBT. This finding was also found in the simulations, in which almost CAT’s ability estimations were smaller than those of the PBT in all the school types. There are two possible explanations for the higher ability estimations in the full length test. First, a number of the items might have been quite easy, especially for the higher ability group, thereby rendering the PBT’s ability to estimate ability being higher than the that of CAT. As previously stated, the CAT tailors the test difficulty according to test takers’ abilities. Items providing the highest information at a given ability level are used during testing and it is not likely for items that are too easy or difficult
for the examinees to be used (Wei & Lin, 2015; Weiss, 1973). Second, although
students in Anatolian high schools and private schools, as well as the group that took the live version of the test, are considered to have a high ability level, some of the items might also have been difficult for them. However, they may have been able to correctly guess the right answer. Thus, the greater abilility estimations may partly include students’ ability to correctly guess in the full length test. In either case, there is still need to study this difference in greater detail. On the other hand, although the ability estimations are different between the two versions of the test, students were ranked in almost the same order, which is the major purpose of the HETE. In the live CAT, correlation of 0f is still high enough to defend the same rankings across the two versions of the test. Since ranks, rather than measuring individual ability, is important for the HETE, using CAT will not dramatically change test results for this particular subtest.
When using both CAT and a PBT test, it is of high importance to ensure fairness (Schaeffer et al., 1995; Wang et al., 2008). However, comparability between the PBT and CAT versions of the SSE is a challenging issue due to mode effect (Wang & Shin, 2010). There are many factors that might affect comparability, including (i) test items delivered to individuals, (ii) test scoring, (iii) testing conditions, and (iv) examinee groups (Kolen, 2000). The results of both the simulation and live CAT administration further supported the comparability of the two ability estimations obtained from the two versions of the test. The PBT and CAT versions of the test result in very similar ability estimations with correlations between the two versions’ ability to estimate students’ ability being defendable. Moreover, both tests classify a high rate of examinees into the same percentile groups. However, the CAT version of tests seems to be more difficult than the paper and pencil version, as indicated by lower ability estimations. The major reason for this particular finding is that CAT delivers only individually tailored items to examinees (Wei & Lin, 2014; Weiss, 1973).
One of the criticisms about using computers as the testing medium is that individuals may have computer anxiety or have varying degrees of computer experience (Wang & Kollen, 2011). However, the findings suggest that issues such as computer inexperience or test/computer anxiety seem not to constitute a problem. Studies by Mills (2002) and Smith and Caputi (2007) found no relationship between computer experience/anxiety and student performance. Eid (2004) found that student performance on a math test did not differ between computer-based and paper-based tests.
There are a number of limitations in the present study. The first limitation concerns the size of the item bank used in the post hoc simulation. Although using a real data set is an asset, the simulation was severely restricted due to it only containing 45 items, especially for certain ability levels and school types. On the other hand, a larger item bank was used for the live CAT, which allowed for more freedom in matching the group’s ability with item difficulty. With this being said, however, the group that participated in the live CAT study is not a representative sample of everyone who takes the test. The findings are only valid for the high ability group in this particular analysis. Further studies need to test live CAT administrations using groups of different abilities. In the present study, only the science subtest was used, which is one of the more difficult subtests used in Turkey’s university admission system. Thus, the results are only valid for a similar test with the same content and difficulty level. In the live CAT administration, since the subjects in the study had previously taken the admission tests, they might have remembered the items that they had previously answered, another factor that might also affect the results. In both the post hoc simulation and live CAT administration, the items included in the science subtest were found to be difficult, especially for the public school students. If the HETE is to be administered using a CAT format, a larger distribution in the item difficulty strata is needed to fulfill the requirement of matching individuals’ ability with test item difficulty.
References
American Psychological Association, American Educational Research Association, & National Council on Measurement in Education. (1999). Standards for educational and psychological testing. Washington, DC: American Psychological Association.
American Psychological Association, American Educational Research Association, & National Council on Measurement in Education. (2015). Standards for educational and psychological testing. Washington, DC: American Psychological Association.
Allen, M. J., & Yen, W. M. (1979). Introduction to measurement theory. Prospect Heights IL: Waveland Press.
Babcock, B., & Weiss, D. J. (2009). Termination criteria in computerized adaptive tests: Variable-length CATs are not biased. In D. J. Weiss (Ed.), Proceedings of the 2009 GMAC Conference on Computerized Adaptive Testing (pp. 1–21). Retrieved from http://publicdocs.iacat.org/cat2010/ cat09babcock.pdf
Baker, B. B., & Kim, S. (2004). Item response theory: Parameter estimation techniques. New York, NY: Marcel-Dekker.
Berberoglu, G. (2012). Üniversiteye giriş nasıl olmalıdır? [How should university admission system to higher education be?]. Cito Eğitim: Kuram ve Uygulama, 12(16), 15–18.
Binet, A., & Simon, T. A. (1905). Méthode nouvelle pour le diagnostic du niveau intellectuel des anormaux [New method for the diagnosis of the intellectual level of the abnormal]. L’Année Psychologique, 11, 191–244.
Birnbaum. A. (1968). Some latent ability models and their use in inferring an examinee’s ability. In F. M. Lord & M. R. Novick (Eds.), Statistical theories of mental test scores (pp. 397–479). Reading MA: Addison-Wesley.
Bock, R. D., & Aitken, M. (1981). Marginal maximum likelihood estimation of item parameters: An application of an EM algorithm. Psychometrika, 46, 179–197.
de Ayala, R. J. (2009). The theory and practice of item response theory. New York, NY: Guilford Press. de la Torre, J. (2009). A cognitive diagnosis model for cognitively based multiple- choice options.
Applied Psychological Measurement, 33, 163–183.
de la Torre, J., & Douglas, J. A. (2004). Higher-order latent trait models for cognitive diagnosis. Psychometrika, 69, 333–353.
Eignor, D. R., & Schaeffer, G. A. (1995, April). Comparability studies for the GRE General CAT and the NCLEX using CAT. Paper presented at the meeting of the National Council on Measurement in Education, San Francisco.
Embretson, S. E., & Reise, S. P. (2000). Item response theory for psychologists. Mahwah, NJ: Lawrence Erlbaum Associates.
Forbey, J. D., & Ben-Porath Y. S. (2007). Computerized adaptive personality testing: A review and illustration with the MMPI-2 computerized adaptive version. Psychological Assessment, 19(1), 14–24.
Glas, C. A., W., & van der Linden, W. J. (2001). Modelling variability in item parameters in item response models (Research Report 01–11). Enschede: University of Twente.
Gu, L., & Reckase, M. D. (2007). Designing optimal item pools for computerized adaptive tests with Sympson-Hetter exposure control. In D. J. Weiss (Ed.), Proceedings of the 2007 GMAC Conference on Computerized Adaptive Testing (pp. 1–44). Retrieved from http://publicdocs. iacat.org/cat2010/cat07gu-reckase.pdf
Hambleton, R. K., Swaminathan, H., & Rogers, H. J. (1991). Fundamentals of item response theory. Newbury Park, CA: Sage.
Han, K. T. (2012). SimulCAT: Windows software for simulating computerized adaptive test administration. Applied Psychological Measurement, 36(1), 64–66.
Harwell, M., Stone, C. A., Hsu, T. C., & Kirisci, L. (1996). Monte Carlo studies in item response theory. Applied Psychological Measurement, 20, 101–125.
Hessling, R., Schmidt, T., & Traxel, N. (2004). Floor Effect. In M. S. Lewis-Beck, A. Bryman, & T. F. Liao (Eds.), The SAGE Encyclopaedia of Social Science Research Methods (pp. 391–392). Thousand Oaks, CA: Sage Publications, Inc.
Kalender, I. (2015). Simulate_CAT: A computer program for post-hoc simulation for computerized adaptive testing. Journal of Measurement and Evaluation in Education and Psychology, 6(1), 173–176.
Kolen, M. J. (2000). Threats to score comparability with applications to performance assessments and computerized adaptive tests. Educational Assessment, 6, 73–96.
Kolen, M. J., & Brennan, R. L. (2004). Test equating, scaling, and linking. New York, NY: Springer Verlag.
Lord, F. M. (1968). An analysis of the verbal scholastic aptitude test using Birnbaum’s three-parameter model. Educational and Psychological Measurement, 28, 989–1020.
Lord, F. M. (1980). Applications of item response theory to practical testing problems. Hillsdale, NJ: Lawrence Erlbaum Associates.
Mardberg, B., & Carlstedt, B. (1998). Swedish enlistment battery: Construct validity and latent variable estimation of cognitive abilities by the CAT-SEB. International Journal of Selection and Assessment, 6, 107–114.
Öğrenci Seçme ve Yerleştirme Merkezi. (2015). Higher education statistics. Retrieved from www. osym.gov.tr
Mills, C. N. (Ed.). (2002). Computer-based testing: Building the foundation for future assessment. NJ: Lawrence Erlbaum.
Moreno, K. E., & Segall, O. D. (1997). Reliability and construct validity of CAT-ASVAB. In W. A. Sands, B. K. Waters, & J. R. McBride (Eds.), Computerized adaptive testing: From inquiry to operation (pp. 169–179). Washington, DC: American Psychological Association.
Nydick, S. W., & David J. W. (2009). A hybrid simulation procedure for the development of CATs. In D. J. Weiss (Ed.), Proceedings of the 2009 GMAC Conference on Computerized Adaptive Testing (pp. 1–23). Retrieved from http://iacat.org/content/hybrid-simulation-procedure-development-cats Paek, P. (2005). Recent trends in comparability studies (PEM Research Report 05-05). Retrieved
from http://www.pearsonedmeasurement.com/downloads/research/RR_05_05.pdf
Raîche, G., & Blais, J. G. (2002, April). Practical considerations about expected a posteriori estimation in adaptive testing: Adaptive a priori, adaptive correction for bias, and adaptive integration interval. Paper presented at the 11th International Objective Measurement Workshop, Nouvelle-Orleans.
Rudner, L. (1998). Item banking. Practical Assessment, Research & Evaluation, 6(4). Retrieved from http://PAREonline.net/getvn.asp?v=6&n=4
Samejima, F. (1969). Estimation of latent ability using a response pattern of graded scores (Psychometric Monograph No. 17). Richmond, VA: Psychometric Society. Retrieved from http://www.psychometrika.org/journal/online/MN17.pdf
Sands, W. A., Waters, B. K., & McBride, J. R. (Eds.) (1997). Computerized adaptive testing: From inquiry to operation. Washington, DC: American Psychological Association.
Schaeffer, G. A., Steffen, M., Golub-Smith, M. L., Mills, C. N., & Durso, R. (1995). The introduction and comparability of the computer-adaptive GRE General Test (Research Rep. No. 95-20). Princeton NJ: Educational Testing Service.
Segall, D. O. (1995, April). Equating the CAT-ASVAB: Experiences and lessons learned. Paper presented at the meeting of the National Council on Measurement in Education, San Francisco. Smith, B., & Caputi, P. (2004). The development of the attitude towards computerized assessment
Thissen, D., & Mislevy, R. J. (2000). Testing algorithms. In H. Wainer, N. Dorans, D. Eignor, R. Flaugher, B. Green, R. Mislevy, ... D. Thissen (Eds.), Computerized adaptive testing: A primer (2nd ed., pp. 101–131). Hillsdale, NJ: Lawrence Erlbaum Associates.
Thompson, N. A. (2007). A practitioner’s guide for variable-length computerized classification testing. Practical Assessment Research & Evaluation, 12(1). Retrieved from http://pareonline. net/getvn.asp?v=12&n=1
Thompson, N. A., & Weiss, D. J. (2011). A framework for the development of computerized adaptive tests. Practical Assessment, Research & Evaluation, 16(1). Retrieved from http:// pareonline.net/getvn.asp?v=16&n=1
van der Linden, W. J., & Hambleton, R. K. (1997). Handbook of modern item response theory. New York, NY: Springer.
Vang, T. (1997, March). Essentially unbiased EAP estimates in computerized adaptive testing. Paper presented at the annual meeting of the American Educational Research Association, Chicago. Veldkamp, B. P., & Matteucci, M. (2013). Bayesian computerized adaptive testing. Revista Ensaio:
Avaliação e Política Públicas em Educação, 21(78), 57–82.
Veerkamp, W. J. J., & Berger, M. P. F. (1997). Some new item selection criteria for adaptive testing. Journal of Educational and Behavioral Statistics, 22, 203–226.
Vispoel, W. P., Rocklin, T. R., & Wang, T. (1994). Individual differences and test administration procedures: A comparison of fixed-item, computerized-adaptive, and self-adapted testing. Applied Measurement in Education, 53, 53–79.
Wainer, H. (2000). Computerized adaptive testing: A Primer (2nd ed.). Mahwah, NJ: Lawrence Erlbaum Associates.
Wang, H., & Shin, C.D. (2010). Comparability of computerized adaptive and paper-pencil tests. Test, Measurement and Research Services Bulletin, 13, 1–7.
Wang, S., Jiao, H., Young, M. J., Brooks, T., & Olson, J. (2008). Comparability of computer-based and paper-and-pencil testing in K12 reading assessment: A meta-analysis of testing mode effects. Educational and psychological measurement, 68(1), 5–24.
Wang, T., & Kolen, M. J. (2001). Evaluating comparability in computerized adaptive testing: Issues, criteria and an example. Journal of Educational Measurement, 38, 19–49.
Wang, X. B., Pan, W., & Harris, V. (1999). Computerized adaptive testing simulations using real test taker responses (LSAC Computerized Testing Report 96-06). Newtown, PA: Law School Admission Council.
Wei, H., & Lin, J. (2015). Using out-of-level items in computerized adaptive testing. International Journal of Testing, 15(1), 50–70.
Weiss, D. J. (1973). The stratified adaptive computerized ability test (Research Report 73-3). Minneapolis: University of Minnesota, Department of Psychology, Psychometric Methods Program, Computerized Adaptive Testing Laboratory.
Weiss, D. J. (2005). Manual for POSTSIM: Post hoc simulation of computerized adaptive testing (Version 2.0) [Computer software]. St. Paul, MN: Assessment Systems Corporation.
Weiss, D. (2011). Better data from better measurements using computerized adaptive testing. Journal of Methods and Measurement in the Social Sciences, 2(1), 1–27.
Wilson, D., Wood, R. L., & Gibbons, R. (1991). TESTFACT: Test scoring, item statistics, and item factor analysis [Computer software]. Chicago, IL: Scientific Software.
Wise, S. L., & Kong, X. (2005). Response time effort: A new measure of examinee motivation in computer-based tests. Applied Measurement in Education, 18, 163–183.
Zimowski, M. F., Muraki, E., Mislevy, R. J., and Bock, R. D. (1996). BILOGMG: Multiple-group IRT analysis and test maintenance for binary items [Computer software]. Chicago, IL: Scientific Software, Inc.