Comparing the performances of prediction models: A study on growth
of lambs
*Özlem GÜLLÜ
1, İsmayil Safa GÜRCAN
21Ankara University, Faculty of Science, Department of Statistics; 2Faculty of Veterinary Medicine, Department of Biostatistics,
Ankara, Turkey.
Summary: The aim of this study is to assess the impact of the birth weight variable on the performance of the model through the use of the classical methods employed to evaluate the performances of prediction models, namely, coefficient of determination, Brier score, area under the ROC curve (AUC), and two new alternative methods, namely, Net Reclassification Improvement (NRI) and Integrated Discrimination Improvement (IDI). The material of the study consists of the data on the growth of 433 lambs in Sivas-Ulaş Agricultural Enterprise between 1996 and 1997. The study examines the impact of birth weight on the model's performance in the classification of lambs as those having and not having the desired weaning weight (WW). The results indicate that the contribution of birth weight to the discrimination of the model is 2.1% according to AUC. NRI was found to be 11.6% (p<0.001). Thus, when the birth weight variable is added, the probability of lambs with the desired WW to be included in the low risk category is 11.6% higher than the probability of those lambs to be included in the high risk category. Categorical independent IDI was calculated to be 3.3% (p<0.001). In conclusion, NRI indicates the impact of birth weight more sensitively than AUC by measuring the change on the basis of the risk categories. These performance indexes (NRI and IDI) newly developed in the literature produce more sensitive results compared to the classical approach (AUC).
Keywords: AUC, IDI, model performance measures, NRI, reclassification.
Tahmin modellerinin performanslarının değerlendirilmesi: Kuzularda büyüme üzerine bir çalışma
Özet: Bu çalışmanın amacı, tahmin modellerinin performanslarının değerlendirilmesinde kullanılan klasik yöntemler: Belirtme katsayısı, Brier skor, eğri altında kalan alan (EAKA) ve bu yöntemlere alternatif olarak sunulan iki yeni yöntem: Net Tekrar Sınıflandırma İyileştirmesi (NTSİ) ve Bütünleşik Ayrımsama İyileştirmesi (BAİ) ile doğum ağırlığı değişkeninin model performansına etkisinin incelenmesidir. Çalışmanın materyalini 1996-1997 yılları arasında Sivas-Ulaş Tarım İşletmesindeki 433 kuzunun büyüme özelliğine ait veriler oluşturmuştur. Çalışmada, istenilen sütten kesim ağırlığına (SKA) sahip olan ve olmayan kuzuların sınıflandırılmasında doğum ağırlığının model performansına etkisi incelenmiştir. Sonuçlara göre doğum ağırlığının modelin ayırt edebilirliğine katkısı EAKA’ya göre %2.1’dir. NTSİ %11.6 (p<0.001) olarak bulunmuştur. Böylece doğum ağırlığı belirteci eklendiğinde, istenilen SKA’da olan bireylerin düşük risk kategorisine geçme olasılığı, yüksek risk kategorisine geçme olasılığından %11.6 daha fazladır. Kategoriden bağımsız BAİ ise %3.3 (p<0.001) olarak hesaplanmıştır. Sonuç olarak NTSİ, doğum ağırlığının etkisini risk kategorileri bazında meydana gelen değişimi ölçerek EAKA’ya nazaran daha hassas bir şekilde göstermiştir. Literatürde yeni geliştirilen bu performans ölçüleri (NTSİ ve BAİ) klasik yaklaşıma (EAKA) nazaran daha duyarlı sonuçlar üretmektedirler.Anahtar sözcükler: BAİ, EAKA, model performans ölçüleri, NTSİ, tekrar sınıflandırma.
Introduction
Prediction models have recently started to be used in addition to various diagnosis methods and laboratory tests for distinguishing sick and healthy individuals in applied health sciences. In studies where the response variable is binary, Logistic Regression and Cox Regression models are the most commonly used prediction models. According to the variables in these models, a risk prediction is obtained for each individual. The objective of prediction model is to classify individuals properly
* This study is produced from the PhD thesis of Özlem GÜLLÜ
based on the associated risk categories. The risk information obtained from here guides the researcher in making a decision. Furthermore, these models are also employed to formulate policies for taking measures so as to protect individuals from undesirable incidents, monitoring the course of condition of individuals in the high risk group, and selecting individuals to be included into treatment (9).
Prediction models are used in many studies in the field of veterinary medicine. In their study, Ateca et al. (3)
examined, through survival analysis, the risk factors that might play a role in determining prognosis in hypotensive dogs with and without hyperlactatemia, the data of which were obtained from the medical records between 2006 and 2011. In a study conducted by Oguzoglu et al. (11), the risk factors that cause chronic diseases in the digestive system, urinary tract and respiratory system of domestic and stray cats living in Ankara were assessed through logistic regression method. Çoban and Tüzemen (7) employed the logistic regression method to determine the relationships between factors such as breed, lactation sequence, lactation period, calving season, operational activities and the occurrence of subclinical mastitis in Brown Swiss and Holstein cows. Akcay et al. (2) used the logistic regression method to determine the risk factors associated with broiler coccidiosis in Turkey. In another study, King et al. (10) calculated the probability of survival of severely ill dogs after 30 days of treatment in an intensive care unit.
AUC is the most commonly used method for assessing the contribution of a marker to the performance of the model (5). However, the clinical and epidemiological studies conducted argue that AUC has some restrictions and is not sufficiently explanatory in assessing the clinical usefulness of a newly added marker (6). AUC is also limited if one wishes to use a specific threshold value. Particularly, a slight increase that occurs in AUC when a new marker is added into the model may not suffice to explain the usability of this marker (13). For such problems, Cook et al. (4) suggested the use of reclassification table that compares the probabilities obtained from the two prediction models that contain and does not contain the new marker by their risk categories, and Pencina et al. (12) suggested the use of two new performance measures in relation to this table, in addition to AUC. These measures are Net Reclassification Improvement (NRI) and Integrated Discrimination Improvement (IDI).
The present study aims to compare the classical measures with two alternative measures for assessing the effect of birth weight on the performance of prediction models, using the growth data of Akkaraman, Sakız x Akkaraman F1, and Kıvırcık x Akkaraman F1 sheep.
Materials and Methods
The material of the study consists of the growth data of 111 Akkaraman, 210 Sakız x Akkaraman F1, and 121 Kıvırcık x Akkaraman F1 lambs, obtained from a study conducted by Akcapinar et al. (1) for a period of 90 days. The dependent variable in the study was the weaning weight (WW) of lambs on the 90th day. Lambs were divided into two groups, namely, those with less weight than WW (1: high risk group) and those with more weight than WW (0: low risk group). Among the risk factors that
affect the weight of each lamb on the 90th day, genotype, year of birth, sex and type of birth constitute the reference model. The birth weight variable, whose impact on the reference model would be investigated, was added as a variable, and thus the improved model was obtained.
By using estimated probabilities obtained from the model developed through logistic regression method, the model's performance was assessed on the basis of classical performance measures, namely, Brier Score, Nagelkerke R2, AUC, and novel performance measures suggested in the literature, namely, NRI and IDI. The significance of the increase in AUC was assessed using De-Long test.
Reclassification table and NRI: NRI is an index that
measures the movements of individuals with a desired/undesired condition in the reclassification table (cross tabulation) obtained from the reference and improved model between risk categories by using the concepts of upward movement and downward movement. While upward movement is the classification of an individual with an undesired condition in the higher risk group, downward movement is the classification of an individual with a desired condition in the lower risk group by the improved model (8). If the following definition is made: D1 = The relevant condition exists; D0 = The relevant condition does not exist, then NRI can be calculated as follows (12):
NRI = P(up D=1) P(down D=1) P(up D=0) P(down D=0) (1)
IDI: It equals to the difference between the mean of
sensitivity values in the reference and improved model that correspond to all possible threshold values between 0 and 1, and the mean of "1-specificity" values (12). IDI can be calculated as follows in this study:
1 0 improved model 1 0 reference model
ˆ
(
ˆ
ˆ
)
(
ˆ
ˆ
)
D D D D
IDI
p
p
p
p
(2) SPSS for Windows 14.01 (License Number: 9869264) software package was used to conduct the logistic regression analysis and calculate the risk factors, whereas R (Version i386 3.1.3) software was used in combination with Predict ABEL, Hmisc, ROCR and Clinfun to assess the model performance measures.
Results
Descriptive statistics for the variables in the data set are given in Table 1. The mean of the continuous variable birth weight (kg) in the data set, its ± standard deviation and range were calculated to be 4.76±0.711 kg, 2.4-6.7 kg, respectively. Among the risk factors that may affect WW, the variables genotype, sex, type of birth, year of birth and birth weight were assessed using logistic regression analysis, and all variables were found to be significant at the 5th step through backward elimination method.
Table 1. The proportional distribution of lamb according to variable of categories and distribution of birth weight according to variable of categories.
Tablo 1. Değişken kategorilerine göre kuzuların oransal dağılımı ve doğum ağırlığının değişken kategorilerine göre dağılımı.
Variables n % n Mean Std.Deviation
90th day live weight (kg) ≤23.37 218 50.3
>23.37 215 49.7 Genotype Akkaraman 102 23.6 4,86 0,56 Sakız x Akkaraman F1 210 48.5 4,71 0,77 Kıvırcık x Akkaraman F1 121 27.9 4,86 0,70 Sex Male 216 49.9 4,88 0,72 Female 217 50.1 4,65 0,68
Type of birth Single 234 54.0 5,02 0,65
Twin 199 46.0 4,46 0,65
Year of birth 1996 141 32.6 4,71 0,75
1997 292 67.4 4,79 0,69
Table 2. The results of the traditional performance measures for the reference and the improved models. Tablo 2. Referans ve geliştirilmiş modele ilişkin klasik performans ölçülerinin sonuçları.
Performance Measures Reference Model Improved Model
Traditional measures Brier 0.193 0.185 Brier’s score 22.6% 25.8% Nagelkerke R2 29.3% 33.8% ROC-AUC 0.772 [ 0.729 - 0.816 ] 0.793 [ 0.751 - 0.834 ] Discrimination slope 0.227 0.260 Calibration H-L Goodness-of-fit test 6.075 8.213 p=0.639 p=0.413 H-L: Hosmer-Lemeshow.
Table 3. The results of ROC analysis of the reference and the improved models*. Tablo 3. Referans ve geliştirilmiş modele ilişkin ROC analiz sonuçları.
Prediction Models Sensitivity (TPR) Specificity (TNR) Accuracy
Reference model 0.908 0.330 0.621
Improved model 0.908 0.446 0.713
*Cut-off: 0.30.
The performances of the reference model and the improved model into which the birth weight variable was added were assessed through classical measures. The results are given in Table 2. The distinguishability of lambs with high and low WW by each predictive model in the first stage was assessed by calculating the AUC values of both models. In order to measure the usability of the marker in the study more sensitively, Type I error was accepted to be 1%, and the difference between the AUC values of the two models was found to be statistically insignificant (p=0.035).
The sensitivity, specificity and accuracy values of the estimated probabilities obtained from the models are given on the basis of the threshold value 0.30, where NRI
was found to be significant, in Table 3. NRI values of lambs in relation to WW were examined on the basis of different threshold values and risk categories, and the threshold value 0.30 was found the statistically significant. According to the results, no increase was observed in the sensitivity value of the improved model, whereas its specificity value and correct classification rate increased. Table 4 gives the classification of estimated probability values obtained from the reference and improved models. According to the values obtained in Table 4, the addition of the birth weight variable into the model did not cause any change in the number of individuals within the high risk group that actually do not have the desired WW (low WW) (198/218 = 91% -
reference model; 198/218 = 91% - improved model), whereas a decrease of 12% was observed in the number of individuals classified in the high risk group despite having the desired WW (high WW) (144/215 = 67% - reference model; 119/215 = 55% - improved model).
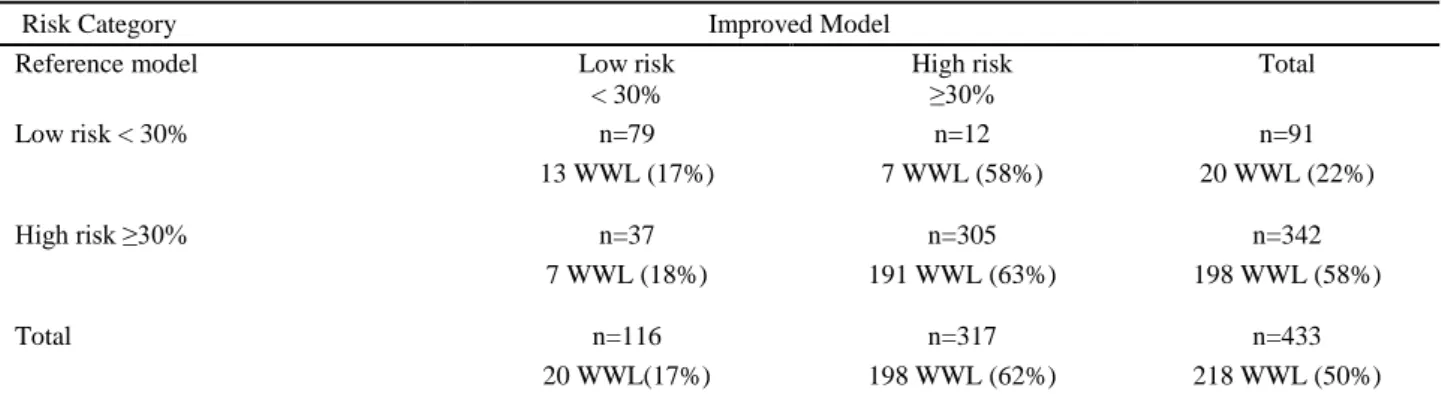
The reclassification table given in Table 5 shows the change in the risk categories caused by the birth weight variable added into the reference model.
In Table 6, the improved model in with the desired WW classified 7 individuals in the high risk group and 7 individuals in the low risk group. The improved model in without the desired WW classified 5 individuals in the
high risk group and 30 individuals in the low risk group. According to Equation (1), the NRI value was found to be 0.116. Therefore, the improved model did not provide any improvement in the classification of individuals with less weight than the desired WW, whereas the probability of individuals with the desired WW (high WW) to move from the high risk group to the low risk group increased by 11.6%. According to Equation 2, IDI value was calculated to be 3.3%. This indicates that the addition of birth weight into the model increased the mean risk difference between the mean estimated probability values of lambs with and without the desired WW by 3.3%.
Table 4. The classification of the probability estimates of the reference and the improved models. Tablo 4. Referans ve geliştirilmiş modelin tahmini olasılıklarının sınıflandırılması.
Risk Category State
Re fe re n ce m o d el WW WWL Total Low risk < 30% 71 (%33) 20 (%9) 91 (%22) High risk ≥ 30% 144 (%67) 198 (%91) 342 (%58) Im p ro v ed m o d el Low risk < 30% 96 (%45) 20 (%9) 116 (%17) High risk ≥30% 119 (%55) 198 (%91) 317 (%62)
*WWL: low weaning weight, WW: weaning weight.
Table 5. Reclassification table of the reference and the improved models. Tablo 5. Referans ve geliştirilmiş modelin tekrar sınıflandırma tablosu.
Risk Category Improved Model
Reference model Low risk
< 30% High risk ≥30% Total Low risk < 30% n=79 n=12 n=91 13 WWL (17%) 7 WWL (58%) 20 WWL (22%) High risk ≥30% n=37 n=305 n=342 7 WWL (18%) 191 WWL (63%) 198 WWL (58%) Total n=116 n=317 n=433 20 WWL(17%) 198 WWL (62%) 218 WWL (50%)
*WWL: low weaning weight, WW: weaning weight.
Table 6. The classification table of the lambs with and without required weaning weight. Tablo 6. İlgilenilen olaya sahip olan ve olmayan bireylerin sınıflandırma tablosu.
Improved Model with required WW
Reference model <30% ≥30% Total
< 30% 13 7 20
≥ 30% 7 191 198
Total 20 198 218
Improved Model
without required WW Reference model <30% ≥30% Total
< 30% 66 5 71
≥ 30% 30 114 144
Total 96 119 215
Discussion and Conclusion
It is important for breeders to know the risk factors associated with sheep breeding. This study assesses the impact of the birth weight variable, in addition to the risk factors that play a role in the growth of lambs, on the classification of lambs with a low and high WW. Thus, it can be ensured that the lambs with and without the desired WW in the herd can be distinguished, or variables that play a role in this condition can be kept under control.
This study assesses the contribution of the birth weight variable to the model's performance in the classification of lambs with a low and high WW. The improved model was obtained by adding the birth weight variable into the reference model, which contained risk factors such as genotype, sex, type of birth and year of birth. Chi-square value of the improved model obtained by adding the birth weight variable into the reference model rose from 107.42 to 126.46. This increase was found to be statistically significant (p<0.001).
The performances of the predictive models obtained were first assessed using the classical performance measures (Table 2). With the addition of the birth weight variable into the model, the Brier score and Nagelkerke R2 values of the model rose to 25.8% and 33.8%, respectively. Calibration of the models was assessed using Hosmer-Lemeshov test for goodness of fit. According to the results of the test, the variables were found to fit the model well. AUC values for the reference model and the improved model into which birth weight had been added were calculated to be 0.772 and 0.793, respectively. Accordingly, the contribution of the birth weight variable to the distinguishability of lambs by the model was 2.1%. This difference between the AUC values was not found to be statistically significant at a confidence level of 99% (p=0.035). However, the birth rate variable was found to be statistically significant and was included into the predictive model.
Furthermore, the sensitivity value of the improved model did not change, whereas its specificity value rose from 0.330 to 0.446 and accuracy rose from 0.621 to 0.713. Therefore, the addition of the birth weight variable into the model did not result in any change in the ratio of true positives, but caused an increase in the ratio of true negatives in the classification of lambs with a low and high WW. In other words, the improved model is a model that is capable of distinguishing the individuals with the desired condition (high WW). Additionally, the correct classification rate increased by 9.2%.
Secondly, the model performances were assessed employing the measures suggested as alternatives to AUC. Using the reclassification tables, the movement of lambs with a low and high WW between risk categories is shown in more detail in Table 5. The reference model classified 91 lambs in the low risk group, 20 of which were actually
lambs with a low WW. The improved model classified 116 lambs in the low risk group, 20 of which were actually lambs with a low WW. Thus, the probability of the improved model to make an incorrect classification fell from 22% to 17%. Similarly, the reference model classified 342 lambs in the high risk group, 198 of which were actually lambs with a low WW. The improved model classified 317 lambs in the high risk group, 198 of which were actually lambs with a low WW. In other words, probability of the improved model to make an correct classification rose from 58% to 62%.
In conclusion, NRI and IDI can produce more sensitive results than the classical approach (AUC). In practice, the method commonly used to measure the accuracy of the classification by predictive models is the area under the ROC curve. However, in addition to AUC, NRI and IDI methods should also be taken into account in deciding whether a new marker whose impact will be investigated should be included into the model or not. These methods categorise the risks, and ensure that the model can distinguish between the individuals in high and low risk categories. They also provide information on the direction of the movement occurring between the risk categories. This study shows that the methods mostly employed to research the impact of a new marker on the diagnosis of diseases in clinical studies can also be employed in the field of livestock raising as well.
References
1. Akçapınar H, Özbeyaz C, Ünal N, et al. (2000): Kuzu eti üretimine uygun ana ve baba hatlarının geliştirilmesinde Akkaraman, Sakız ve Kıvırcık koyun ırklarından yararlanma imkanları I. Akkaraman koyunlarda döl verimi, Akkaraman, Sakiz X Akkaraman F1 ve Kıvırcık X Akkaraman F1 kuzularda yaşama gücü ve büyüme. Turk J Vet Anim Sci, 24, 71-79.
2. Akçay A, Ertuğrul O, Gürcan IS, et al. (2011): Quantification of risk factors of coccidiosis in broilers by using lojistic regression analysis. Vet J Ankara Univ, 58, 195-202.
3. Ateca lB, Dombrowski SC, Silverstein DC (2015): Survival analysis of critically Ill dogs with hypotension with or without hyperlactatemia: 67 cases (2006-2011). Javma, 246, 100-104.
4. Cook NR, Buring JE, Ridker PM (2006): The effect of including c-reactive protein in cardiovascular risk prediction models for women. Ann Intern Med, 145, 21-29. 5. Cook NR (2007): Use and misuse of the receiver operating characteristic curve in risk prediction. JAHA, 115, 928-935.
6. Cui J (2009): Overview of risk prediction models in cardiovascular disease research. Ann Epidemiol, 19, 711-717.
7. Çoban Ö, Tüzemen N (2007): Siyah alaca ve esmer ineklerde subklinik mastitis için risk faktörleri giriş materyal ve metot bulgular. Uludağ University J Fac Vet Med, 26, 27-31.
8. Gu W, Pepe MS (2009): Measures to Summarize and Compare the Predictive Capacity of Markers. UW Biostatistics Working Paper Series University of Washington, 342.
9. Janes H, Pepe MS, Gu W (2008): Assessing the value of risk predictions by using risk stratification tables. Ann Intern Med, 149, 751.
10. King lG, Wohl JS, Manning AM, et al. (2001): Evaluation of the survival prediction index as a model of risk stratification for clinical research in dogs admitted to intensive care units at four locations. AVMA, 62, 948-954. 11. Oğuzoğlu TÇ, Muz D, Timurkan MÖ, et al. (2013): Prevalences of feline coronavirus (FCoV), feline leukaemia virus (FeLV), feline immunodeficiency virus (FIV) and feline parvovirus (FPV) among domestic cats in Ankara, Turkey. Revue Med Vet, 164, 511-516.
12. Pencina MJ, D’Agostino Sr RB, D’Agostino Jr RB, et al. (2008): Evaluating the added predictive ability of a new marker: From area under the ROC curve to reclassification and beyond. Statist Med, 27, 157-172.
13. Steyerberg EW, Vickers AJ, Cook NR, et al. (2010): Assessing the performance of prediction models: a framework for traditional and novel measures. Epidemiology, 21, 128-38.
Geliş tarihi: 09.11.2015/Kabul tarihi: 06.06.2016 Address for correspondence:
Özlem GÜLLÜ, Dr.(PhD).
Department of Statistics, Ankara University, Faculty of Sciences, Ankara, Turkey, Tel:+90554 4152998