Pt/CeO
x
/ZrO
x
/
γ-Al
2
O
3
Ternary Mixed Oxide DeNO
x
Catalyst: Surface
Chemistry and NO
x
Interactions
Stanislava Andonova,
†Zehra Aybegüm Ok,
‡Nikola Drenchev,
†Emrah Ozensoy,
*
,‡,§and Konstantin Hadjiivanov
*
,†,∥†Institute of General and Inorganic Chemistry, Bulgarian Academy of Sciences, 1113 Sofia, Bulgaria ‡Chemistry Department, Bilkent University, 06800 Bilkent, Ankara, Turkey
§UNAM-National Nanotechnology Center, Bilkent University, 06800, Ankara, Turkey ∥Bulgarian Academy of Sciences, Sofia 1040, Bulgaria
*
S Supporting InformationABSTRACT: Surface chemistry and the nature of the adsorbed NOx species on a Pt/CeO2−ZrO2/Al2O3 catalyst
were investigated by IR spectroscopy, X-ray diffraction, H2 -temperature programmed reduction, and NOx-temperature
programmed desorption. Parallel studies were also carried out with benchmark samples such as CeO2/Al2O3, ZrO2/Al2O3,
CeO2−ZrO2/Al2O3 and Pt-supported versions of these materials. All samples were studied in their reduced and nonreduced forms. The use of CO as a probe molecule revealed that during the synthesis of the mixed-metal oxide systems, deposited zirconia preferentially interacted with the
alumina hydroxyls, while deposited ceria was preferentially located at the Lewis acid sites. Despite the limited extent of Zr4+ions incorporated into the CeO2lattice, the reduction of ceria was promoted and occurred at lower temperatures in the presence of zirconia. When deposited on ZrO2/Al2O3, platinum formed relatively big particles and existed in metallic state even in the
nonreduced samples. The presence of ceria hindered platinum reduction during calcination and yielded a high platinum dispersion. Subsequent reduction with H2 led to the production of metallic Pt particles. Consequently, NO adsorption on
nonreduced Pt-containing materials was negligible but was enhanced on the reduced samples because of Pt0-promoted NO
disproportionation. The nature of the nitrogen-oxo species produced after NO and O2coadsorption on different samples was
similar. Despite the high thermal stability of the NOx adsorbed species on the ceria and zirconia adsorption sites, the NOx reduction in the presence of H2was much more facile over Pt/CeO2−ZrO2/Al2O3. Thus, the main differences in the NOx
reduction functionalities of the investigated materials could be related to the ability of the catalysts to activate hydrogen at relatively lower temperatures.
1. INTRODUCTION
One of the most serious environmental problems facing society is the control of atmospheric air pollution consisting of carbon monoxide (CO2), sulfur oxides (SOx), nitrogen oxides (NOx), particulate matter, and unburnt hydrocarbons which are released in significant quantities through exhaust gases from stationary and mobile sources. They have been found to have a serious negative impact on atmosphere, on global ecosystem, and especially on human health. Generation and accumulation of noxious substances in the atmosphere as a result of human activity has necessitated the introduction of stringent emission limits for a number of pollutants, in particular for NOxandfine particulate matter.
Some of the most prominent DeNOx technologies that are
currently utilized/developed for the control of lean-NOx
emissions from mobile sources are selective catalytic reduction (SCR) of NOx by urea/ammonia and NOx storage/reduction
(NSR). These two different types of heterogeneous catalytic
approaches have different potentials for application depending on the vehicle type and engine size. Among them, urea/ ammonia-SCR is a widely commercialized technology for NOx
removal in stationary sources and heavy-duty vehicles.1,2 However, SCR technology which works very effectively for diesel-engine applications suffers from economic/ergonomic penalties associated with the use of a reducing agent (typically urea) that needs to be externally added to the catalytic system. Thus, its adoption to lean-burn engines requires complex exhaust after-treatment systems. NSR technology was first developed by Toyota and does not require an additional reducing agent.3−5In the NSR technology, NOxemissions are
first trapped in the storage materials of NSR catalysts under Received: April 4, 2018
Revised: May 22, 2018
Published: May 30, 2018
pubs.acs.org/JPCC
lean conditions and then reduced by reducing agents under rich conditions.
Ceria (CeO2)- and/or M/ceria−alumina-based materials (M
= Pt, Pd, Rh) serve as the key components for a variety of catalytic processes. Examples for such processes include H2
generation via water−gas shift and/or hydrocarbon steam-reforming reactions,6 three-way catalysis,7 NSR catalysis,8−10 and low-temperature NH3-SCR catalysis.11The significance of
CeO2 in such catalytic processes originates from its superior
oxygen storage capability (OSC) because of the facile creation/ filling of oxygen vacancies during redox reactions, arising from the ability of cerium to easily switch between 3+ and 4+ oxidation states.12,13As an important component in three-way catalysts, CeO2plays a key role by providing a high OSC and
enabling high precious metal dispersion.14 It was also found that CeO2can be an effective promoter leading to a significant improvement in the NOx reduction, sulfur regeneration, and
thermal resistance properties of the NSR catalysts.6,15−17 Ceria-based systems are also studied for their low-temperature NOx
storage capabilities due to the anionic vacancies that can be formed in thefluorite crystal structure,18−21which have been found to facilitate the NOxadsorption.22,23
In an attempt to improve the catalytic performance of (Pt, Pd, Rh)/ceria−alumina-based materials, many efforts were made by different researchers.24,25 Their studies focused on various points such as the improvement of the OSC and thermal stability of ceria and incorporation of foreign cations (with different sizes and oxidation states) into the cubic fluorite lattice of CeO2. In particular, numerous studies26,27dealt with
the performance of (Pt)/CeO2−ZrO2/γ-Al2O3 as DeNOx
catalysts under conditions simulating the NOx reduction
process. This catalytic architecture was found to have potential for the NOx elimination process because of the pronounced redox properties of ceria and its strong interaction with transition metals.28
Incorporation of zirconium in the ceria component is known to improve the catalytic performance by enhancing the resistance of the material to sintering, and boosting the reducibility of ceria, leading to a greater population of oxygen vacancies which are responsible for the activity of the catalyst toward oxygen-containing molecules. The presence of ZrO2 inhibits the undesirable interaction of CeO2 with Al2O3, preventing the deactivation of the Ce(IV)/Ce(III) redox couple due to formation of CeAlO3.
14
Superior oxygen storage capacity of CeO2−ZrO2mixed oxides as opposed to pure ceria
has been attributed to the enhanced reducibility of Ce(IV) in Zr-doped CeO2, which is a consequence of the high oxygen
mobility inside the lattice. The reason for the increased mobility
lies in the highly defective structure and the lattice strain, which are due to the introduction of the smaller isovalent Zr(IV) cation into the CeO2lattice. Zr(IV) has an ionic radius of 0.84
Å, smaller than that of Ce(IV) in the same coordination environment (0.97 Å).29 Moreover, the Ce1−xZrxO2 mixed
oxide is known to have a high NOxadsorption capacity due to the various basic centers on its surface.30
Despite the numerous investigations on DeNOx processes carried out with (Pt)/CeO2−ZrO2/Al2O3mixed ternary oxide
systems,28,31,32 discrete effects induced both by ceria and zirconia as well as the influence of their simultaneous presence are still not sufficiently well-known. Thus, the efforts of the current work were focused on (i) detailed characterization of the state and location of the alumina-supported species by using CO as an IR probe molecule and (ii) studying the nature and reduction behavior of the NOx species on Pt/CeO2−ZrO2/
γ-Al2O3ternary oxide surface by using in situ Fourier transform
infrared (FTIR) spectroscopy. The present manuscript reports our recent studies on the Pt/CeO2−ZrO2/γ-Al2O3system and its constituents as components of DeNOx catalysts. The Pt/
CeO2−ZrO2/γ-Al2O3system not only is composed of some of the most critical functional components of a typical NSR catalyst (e.g., Pt active sites, CeO2−ZrO2promoter and Al2O3 support material) but also is quite relevant to other catalytic converter technologies such as three-way catalysts. Thus, currently presented results reveal valuable fundamental information that can find application in different automotive after-treatment technologies. Our aim is to unravel the surface chemistry of these catalytic systems by starting from relatively simple compositions followed by more complicated ones in a gradual fashion. Therefore, we report our results on the interaction of NO2, NO, and NO + O2with reduced catalyst and also provide data on the stability and reactivity of the surface NOxspecies formed in the presence of H2. The results were compared with the data obtained for Pt/CeO2/γ-Al2O3
and Pt/ZrO2/γ-Al2O3 binary oxide benchmark samples. A series of complementary characterization experiments were also carried out, such as specific surface area, X-ray diffraction (XRD), H2-temperature programmed reduction (H2-TPR), and
NOx-temperature programmed desorption (NOx-TPD) meas-urements in order to obtain a comprehensive picture on the investigated materials.
2. EXPERIMENTAL SECTION
2.1. Sample Preparation. Commercialγ-alumina (γ-Al2O3,
200 m2g−1, SASOL Puralox SBa-200) was used as the primary support material in the synthesis of all of the investigated materials. Ceria and/or zirconia were deposited on γ-alumina Table 1. Composition of the Synthesized Samples, Specific Surface Area (SBET), and Calculated Parameters via XRD (Pt
Average Particle Size, Metal Dispersion) and H2-TPR (Total H2Consumed)
samples CeO2, wt % ZrO2, wt % γ-Al2 O3, wt % Pt, wt % SBET,
m2g−1 Pt average particle size,nma MDPt
b H 2-TPR total H2consumed (mol gcat−1)× 10−2 γ-Al2O3 100 200 Zr/Al 20 80 179 Ce/Al 20 80 160 2.7 Ce−Zr/Al 10 10 80 174 1.3 Pt/Ce/Al 20 80 1 133 24 0.46 4.1 Pt/Zr/Al 20 80 1 152 37 0.30 0.4 Pt/Ce−Zr/Al 10 10 80 1 142 29 0.38 2.2
aAverage Pt particle size values were determined via XRD.bTo evaluate the noble metal dispersion (MD
Pt), the relationship between mean Pt particle size and the dispersion was used.
by conventional incipient wetness impregnation. For this purpose, appropriate amounts of aqueous solutions of Ce-(NO3)3·6H2O (Sigma-Aldrich, 99.99%) and/or ZrO(NO3)2· xH2O (Sigma-Aldrich 99.99%) were used to achieve 20 wt % of
CeO2(ZrO2) or 10 wt % of CeO2+ 10 wt % of ZrO2in the final product. The precursor solutions were mixed with γ-Al2O3
and the slurry was continuously stirred followed by evaporation at 350 K until the water from the suspension was completely removed. The resulting solids were then dried and calcined at 873 K for 2 h. These mixed oxide support materials were further functionalized with addition of platinum. For this purpose, a Pt precursor solution (Pt(NH3)2(NO2)2, 3.4 wt % in
dilute ammonium hydroxide, Sigma-Aldrich) was prepared, and then, the support material was slowly added to the solution under constant stirring at room temperature (RT). Next, the slurry was continuously stirred, and the solvent was evaporated at 350 K. Finally, the products were ground into afine powder form and calcined at 973 K for 2.5 h. The nominal noble metal loading (1 wt % Pt) was kept constant for all samples. For convenience, the notations of the different samples as well as some basic characteristics are summarized inTable 1.
2.2. Characterization Techniques. The Brunauer− Emmett−Teller (BET)-specific surface areas (SBET, m2 g−1)
of the calcined samples were determined by low-temperature isothermal adsorption−desorption of N2using a Micromeritics
TriStar 3000 apparatus. The measurements were performed on previously degassed samples (573 K for 2 h) using nitrogen adsorption data within the relative equilibrium pressure interval of 0.03−0.3P/P0 according to the standard 5-point BET procedure.
The XRD patterns were obtained with a Rigaku di ffrac-tometer, equipped with a Miniflex goniometer and an X-ray source with Cu Kα radiation, at λ = 1.5418 A, 30 kV, and 15 mA. Diffraction patterns of the samples were recorded in 2θ range between 10 and 80° with a step size of 0.01° s−1. The patterns were assigned using Joint Committee on Powder Diffraction Standards (JCPDS) cards supplied by the Interna-tional Centre for Diffraction Database (ICDD). To evaluate the surface metal dispersion (MDPt) of the Pt catalysts, the
relationship between the mean Pt particle size (dPt) and dispersion was used.33Thus, the MD was estimated according toeq 1as follows
= v a
d
MDPt 6( /m m)
Pt (1)
where the volume vmoccupied by an atom Pt in the bulk of
metal is given by the equation: vm= M/ρNA, where M is the atomic mass of Pt, ρ the mass density, and NA Avogadro’s
number. In the case of platinum (M = 195.08 g mol−1; ρ = 21.45 g cm−3), vm= 15.10 A3. The surface area amoccupied by
an atom Pt on a polycrystalline surface is 8.07 A2.
The specimens for transmission electron microscopy (TEM) were prepared by ultrasonically suspending the finely ground sample particles in ethanol and by dispersing this suspension on a standard carbon film-coated copper TEM grid. TEM measurements were carried out in bright field mode using a TEM JEOL 2100 microscope, equipped with a charge-coupled device camera Gatan ORIUS 1000. The operating voltage of the microscope was 200 kV during TEM imaging.
H2-TPR experiments were performed in a conventional
semi-automatic analyzer (ChemBET TPR/TPD, Quantachrome Instruments) consisting of a vertical quartz U-tube reactor
mounted in an electric furnace and connected to a thermal conductivity detector (TCD) measuring the hydrogen consumption. In each experiment, the sample loaded in the quartz reactor (ca. 0.1 g powder with an average particle size within 0.4−0.25 mm) was exposed to 20 mL min−15% H2+
95% He (v/v) gasflow and heated from RT to 1273 K with a heating rate of 10 K min−1. The changes in the H2
concentration were monitored by an online TCD connected directly to the exit of the reactor. A cooling trap placed between the sample and the detector retained the water formed during the reduction process. The H2-TPR curves were used to
calculate the total amount of H2 consumed during the
reduction. TCD was calibrated by injections of a known volume of pure H2through the analyzer septum using a syringe.
NOx-TPD experiments were performed by using a quadru-pole mass spectrometer (QMS, SRS RGA200) that is directly connected to the custom-designed TPD-in situ FTIR spectroscopic system. In the TPD experiments, the sample (ca. 20 mg offinely ground powder) was pressed onto a high transmittance lithographically etchedfine-tungsten grid which was mounted on a copper sample holder assembly that is attached to a ceramic vacuum feedthrough. A K-type thermocouple was spot-welded to the surface of a thin tantalum plate attached on the W-grid to monitor the sample temperature. The sample temperature was controlled within 298−1100 K via a computer-controlled dc resistive heating system using the voltage feedback from the thermocouple. To minimize the effect of NO oxidation/adsorption/disproportio-nation on Pt which could affect the total amount of NOx adsorbed species, the NOxstorage ability tests over Pt samples
were thus performed by using of NO2as the adsorbent. Prior to each experiment, to obtain a surface that is free of adsorbed NOxand other adsorbates (such as carbonates), the sample was
heated to 1023 K in vacuum with a constant rate of 12 K min−1 and, after cooling to 323 K, NOx storage experiments were
performed. Before the NOx-TPD experiments, the samples were exposed to 5 Torr of NO2for 10 min until equilibrium
was reached. After this exposure/saturation step, the sample was outgassed to ∼10−7 Torr to remove weakly adsorbed (physisorbed) NOxspecies, and subsequently, a TPD analysis
was carried out to 973 K with a heating rate of 12 K min−1. The contents of N2, NO, O2, N2O, and NO2 in the desorbing gas
mixture were monitored online by following the desorption signals corresponding to the mass-to-charge ratio (m/z) values of 28, 30, 32, 44, and 46, respectively. The NOx adsorption
ability of the catalysts was estimated by calculating the total integrated areas under NOx-related desorption features in the
TPD profiles after considering fragmentation patterns of all of the major NOx desorption species (i.e., NO2, NO, N2, and
N2O). Thus, to normalize the data, the intensity of the signals for each gas was corrected by a factor using the standard mass spectroscopic fragmentation databases of the National Institute of Standards and Technology (NIST) (see Supporting Information).34
FTIR spectroscopic measurements were carried out in a transmission mode using Nicolet Avatar 6700 FTIR spec-trometer, equipped with a Hg−Cd−Te (MCT) detector. The experiments were performed in a batch-type IR cell equipped with optically polished CaF2windows allowing data acquisition
at low (100 K) and ambient temperatures. The cell was directly connected to a vacuum-adsorption apparatus (Pfeiffer vacuum turbo molecular/rotary pumps) with a residual pressure lower than 1× 10⁻⁶Torr.
For the FTIR experiments, self-supporting pellets (ca. 10 mg cm−2) were used. They were prepared by pressing the sample powders at a pressure of ∼5 ton cm−2, applied for 1−2 min. Then, the pellets were placed inside the IR cell using a custom-made movable sample holder that allows insertion of the sample in the middle of the heated zone of the IR cell. Thus, the spectra were registered in situ after each thermal treatment of the sample at different temperatures and atmospheres. Each FTIR spectrum was acquired within the 4000−800 cm−1 spectral region by accumulating up to 64 scans at a spectral resolution of 2 cm−1 and accuracy of 0.01 cm−1. The background and gas-phase corrections were performed using OMNIC software.
The samples were analyzed in activated and reduced forms. The activation was performed by heating the self-supporting pellets at 673 K in air for 1 h with a subsequent evacuation at the same temperature to a residual pressure∼2.2 × 10⁻⁶Torr. The reduced forms were obtained by heating the pellets at 723 K in 22.5 Torr H2for 1 h followed by evacuation at 673 K to a residual pressure around 2.2× 10⁻⁶Torr.
FTIR investigations were performed before and after adsorption of different gases on the catalyst surfaces either at RT or at low temperature (100 K). Carbon monoxide/nitrogen monoxide (CO, NO, >99.9% pure) were supplied by Air Liquide, France, whereas oxygen and hydrogen (O2, H2, >99.9% pure) were from Messer. Prior to the experiments, CO, O2, and H2were purified by passing through a liquid nitrogen
trap while NO was additionally purified by fractional distillation.
3. RESULTS AND DISCUSSION
3.1. Preliminary Structural Characterization: SBET
Surface Area and XRD. The BET specific surface areas (SBET) of Pt-free Ce/Al, Zr/Al, and Ce−Zr/Al samples were
found to vary between 160 and 180 m2g−1(seeTable 1). This
is about 10−20% lower compared with pure γ-Al2O3(200 m2
g−1) which was used as the primary support material in the synthesis. It is seen that the effect of ceria on the SBETdecrease
is more pronounced. Deposition of Pt leads to an additional decrease in SBET by 15−18%. All these effects are associated
with partial blocking of the γ-Al2O3 pore structure by oxide-and Pt-containing crystallites.
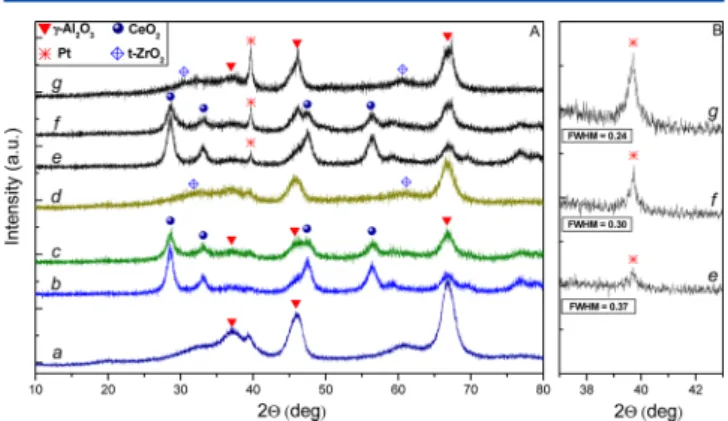
XRD patterns of the samples are shown inFigure 1A. XRD patterns of all Pt-free samples (b−d) exhibit typically broad
diffraction peaks at 2θ = 47.5° and 66.3° because of γ-Al2O3 (a). In the XRD patterns of the Ce/Al sample (b), additional intense reflections at 2θ = 28.5°, 33.1°, 47.6°, and 56.3° are also seen. They are characteristic of the fluorite structure of CeO2
(JCPDS 004-0593). XRD pattern of the Ce−Zr/Al sample (c) also contains the features of CeO2, although with lowered
intensity, as expected. Reflections related to the presence of ZrO2 were not clearly detectable in the XRD profiles of both Ce−Zr/Al (c) and Zr/Al (d) samples. Very poorly defined features at 2θ ≈ 61° could be tentatively attributed to the presence of t-ZrO2(JCPDS 80-2155). This may suggest that in
both Zr-containing materials, zirconia exists as a disordered oxide, amorphous mixed oxide, and/or a highly dispersed oxide phase with small particulate size and thus cannot be detected with XRD.
A more detailed analysis of the XRD data (see the
Supporting Information, Figure S1) showed a slight shift and broadening of the main diffraction peak of Ce(111) at 2θ = 28.7° in the XRD pattern of the Ce−Zr/Al sample with respect to the Ce/Al system. Usually, the shift of the Ce(111) diffraction signal to higher values is indicative of lattice contraction resulting from the substitution of Ce4+ (∼0.097
nm) by the smaller Zr4+ (∼0.084 nm) ions due to the
formation of a CeO2−ZrO2 solid solution.35−38 However,
current results (Figure S1) show that the corresponding shift of the Ce(111) diffraction signal in the Ce−Zr/Al mixed ternary oxide sample is very small. This indicates a limited extent of Zr4+ion incorporation into the ceria lattice.
It is seen inFigure 1A that all of the Pt-containing samples (patterns e−g) show an additional peak at 2θ = 39.7°, which can be assigned to metallic Pt (JCPDS 004-0802). The other Pt peaks (2θ = 46.1° and 67.4°) are masked by the strong features of alumina.
It is also evident that a significant amount of metal platinum species exists on the Pt/Zr/Al sample while the amount of metallic platinum is much lower on the Pt/Ce/Al sample (the Pt/Ce−Zr/Al sample holds intermediate positions). The major diffraction signal of Pt(111) at 2θ = 39.7° can be utilized to calculate the average Pt particle size using the Scherrer equation.39 Pt average particle size on Pt/Ce/Al, Pt/Ce−Zr/ Al, and Pt/Zr/Al were found to be 24, 29, and ∼37 nm, respectively. The noble metal surface dispersion (MDPt) on Pt/
Ce/Al, Pt/Ce−Zr/Al, and Pt/Zr/Al were found to be 0.46, 0.38, and 0.3, respectively.
Representative bright-field TEM images of the Pt/Ce−Zr/Al, Pt/Ce/Al, and Pt/Zr/Al catalysts are shown in Figure S2 (Supporting Information). The imaging revealed morphology with a complex of features with poorly defined lighter and more ordered darker areas, showing that the material presents a relatively inhomogeneous Pt particle distribution. The crystal-line areas which usually appear darker than the amorphous was indicative for the presence of both well-dispersed smaller Pt particles with a range of ∼15−20 nm in size and also some crystallites that are more aggregated with sizes of∼40−50 nm. 3.2. H2-TPR. The redox behavior of the catalysts was studied
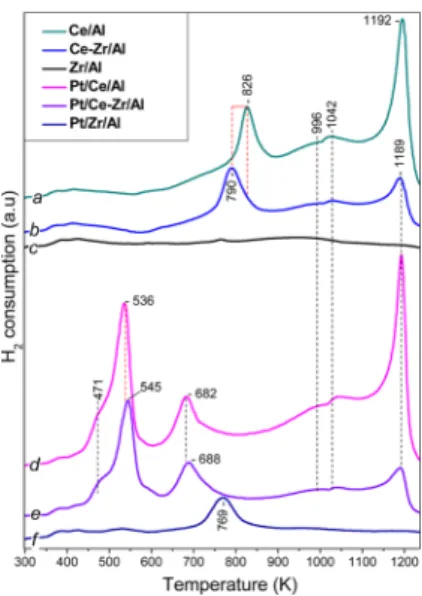
by H2-TPR (Figure 2). The total H2consumed during the TPR
is presented inTable 1. Reduction of the Ce/Al sample resulted in the appearance of two major features in the TPR profile (curve a): a low-temperature peak at ca. 826 K and an additional strong asymmetric TPR signal with a maximum at ca. 1192 K. In addition, weak and broad features at ∼996 and ∼1042 K are also discernible.
Figure 1.(A) XRD patterns of (a)γ-Al2O3; (b) Ce/Al; (c) Ce−Zr/Al; (d) Zr/Al; (e) Pt/Ce/Al; (f) Pt/Ce−Zr/Al; and (g) Pt/Zr/Al. (B) Changes in the intensity and the full width at half-maximum of the Pt(111) diffraction signal.
The TPR profiles of alumina-supported ceria have been thoroughly discussed in former studies.40−43 On the basis of these reports, thefirst TPR signal with a maximum at ca. 826 K is assigned to the reduction of surface Ce4+ to Ce3+ species because of the removal of oxygen anions coordinated to surface Ce4+sites. The amount of H2consumed was near 7.5× 10⁻³
mol gcat−1. The second high temperature peak at 1192 K is ascribed to the removal of bridging oxygen anions between Ce4+and Al3+sites that are located in the interface between the
CeO2and Al2O3domains. The consumed H2corresponding to
the peak at 1192 K was near to 9.5 × 10⁻³mol gcat−1. Two minor features appearing at 996 and 1042 K can be tentatively assigned to the reduction of bulk CeO2domains.
Comparison of Figure 2a,b reveals the effect of Zr incorporation to the Ce/Al system. Although the Ce−Zr/Al sample (Figure 2, profile b) exhibits a reduction behavior similar to that of Ce/Al (a), there are some noticeable differences: (i) the major reduction signal at 826 K for Ce/Al (a) is shifted toward a lower temperature (790 K) for Ce−Zr/ Al (b); (ii) despite the lower CeO2 content (10 wt % Ce) in
the mixed Ce−Zr/Al system, the signal intensity at 790 K was found to be almost identical to that of 826 K in Ce/Al (a); and (iii) the intensity of the feature at 1190 K significantly attenuated in Ce−Zr/Al (b) as compared to Ce/Al (a). The amount of H2consumed for the Ce−Zr−Al sample at 1190 K is near∼2.8 × 10⁻³mol gcat−1.
On the basis of these observations, it can be concluded that ceria in the Ce−Zr/Al sample is mostly in the form of a highly dispersed defective phase because of the interaction of ceria, zirconia, and alumina domains. As a result, the reduction of this defective ceria phase occurs at lower temperatures (ca. 790 K) and in a facile manner. These results are in a good agreement with former reports,28,44,45 showing the promotional effect of zirconia incorporated into the ceria lattice on ceria reduction. It is well-established that the substitution of Ce4+ by Zr4+ in
CeO2−ZrO2solid solution significantly decreases the reduction
temperature of ceria.
Furthermore, attenuated intensity of the TPR signal at 1190 K corresponding to Ce4+in the alumina−ceria interfacial sites
after Zr incorporation and the lower ceria loading in Ce−Zr/Al
suggest a decreased extent of ceria interaction with alumina domains. This considerably decreases the total amount of H2
consumed during the reduction, as presented inTable 1. Influence of Pt incorporation on the redox functionalities of the synthesized mixed oxide systems can also be inferred from
Figure 2. TPR profiles of Pt/Ce/Al and Pt/Ce−Zr/Al catalysts (Figure 2, profiles d and e) indicate that as in the case of Pt-free Ce/Al and Ce−Zr/Al samples, they also contain TPR features at∼996, 1042, and 1193 K. However, Pt/Ce/Al and Pt/Ce− Zr/Al TPR profiles (Figure 2d,e) exhibit three additional reduction signals. For the Pt/Ce−Zr/Al sample (profile e), they appear as a shoulder at∼471 K, a strong asymmetric peak at ca. 545 K, and an additional reduction feature at ca. 688 K. For the Pt/Ce/Al sample, these features are slightly shifted to lower temperatures by ca. 10 K.
The well-known promotional effect of noble metals (e.g. Pt, Rh, and Pd) leading to a decrease in the ceria reduction temperature has been thoroughly discussed in the litera-ture.15,46,47It is generally adopted that two different types of ceria domains exist in noble metal-promoted ceria systems. The first one is in the form of a well-dispersed CeO2domain, where
Pt species are preferably located. Consequently, on these domains, Pt sites are located in close proximity of the Ce4+ions and interact strongly with them. In the second type of ceria domains, ceria is far from the noble metal particles and exist on the surface as segregated CeO2crystallites. Thus, the presence
of Pt may significantly alter the surface morphology of ceria leading to lowering of the reduction temperature and splitting of the reduction process into two different temperature regions. The low-temperature region is associated with reduction of the Pt oxide phase and Ce4+ ions of the well-dispersed CeO
2
surface species in the vicinity of the Pt sites. In contrast, reduction of segregated CeO2domains positioned far from the
noble metal sites occurs at higher temperatures. Indeed, it is known that noble metals supported on ceria, when reduced, may undergo a change in the metal−support interface because of the strong metal−support interaction (SMSI) effect.48It was found that such a type of interaction may lead to alloy formation between Pt and Ce, decoration or encapsulation of Pt by partially reduced ceria, and/or structural reorganization of ceria−zirconia.48,49
On the basis of previous studies,15,46,47the TPR data of the Pt-containing samples presented in Figure 2 can readily be interpreted as follows: the most prominent TPR signal in
Figure 2e (Pt/Ce−Zr/Al) with a maximum at ∼545 K and the shoulder at∼471 K can be assigned to the reduction of the Pt oxide phase and surface Ce4+ ions closely interacting with the noble metal particles, while the feature at ca. 688 K can be associated with the reduction of surface ceria species that are far from Pt sites. Slightly higher reduction temperatures and lower TPR signal intensities for Pt/Ce−Zr/Al (Figure 2e) as compared to Pt/Ce/Al (Figure 2d) can be attributed to the slightly higher Pt crystallinity and lower Pt dispersion (0.38) on Pt/Ce−Zr/Al. The amount of H2consumed for the Pt/Ce−
Zr/Al sample is near 7.1× 10⁻³mol gcat−1at 545 K and 4.6× 10⁻³mol gcat−1at 688 K, respectively. While the consumed H2
for the Pt/Ce/Al was estimated near to 9.6× 10⁻³mol gcat−1at 545 K and 6.8× 10⁻³mol gcat−1at 688 K, respectively This is
consistent with the relatively lower ceria content of the Pt/Ce− Zr/Al sample limiting Pt dispersion, as shown by XRD (Figure 1B). The situation with the Pt/Zr/Al sample is different (Figure 2f). In this case the peak at ca. 769 K could be associated with reduction of residual ionic platinum species.
Figure 2.H2-TPR of the samples: (a) Ce/Al; (b) Ce−Zr/Al; (c) Zr/ Al; (d) Pt/Ce/Al; (e) Pt/Ce−Zr/Al; and (f) Pt/Zr/Al. H2-TPR is performed in the range of 298−1273 K at a ramp of 10 K min−1with a flow (20 mL min−1) of 5% H
2−95% He (v/v) mixture.
The relatively high reduction temperature could be associated with particular stabilization of these species and the lack of promotional effect of ceria.
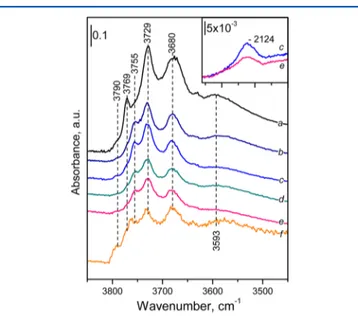
3.3. In Situ FTIR Spectroscopic Adsorption Studies. 3.3.1. Background FTIR Spectra. The FTIR spectra of the activated and reduced samples in the hydroxyl stretching region are presented in Figure 3. The spectrum of γ-Al2O3 (a) is
consistent with literature reports50,51 and contains three well-resolved bands with maxima at 3769, 3729, and 3680 cm−1. These bands can be assigned on the basis of recent reviews.50,51 The most prominent band at 3729 cm−1 is assigned to hydroxyls bound with a bridging configuration to two Al3+sites
having an octahedral coordination (type-IIa hydroxyl), while the band at 3680 cm−1is attributed to OH groups bound to three octahedrally coordinated Al3+ sites (type-III hydroxyl). The band at 3769 cm−1 is associated with the terminal OH groups (type-Ia hydroxyl) on the single tetrahedrally coordinated Al3+ sites that can exist on two different
crystallographic orientations (i.e., (111) and (110)) of the γ-Al2O3 surface. In addition, a shoulder at ∼3790 cm−1 and a broad band around 3593 cm−1are also visible. The feature at ∼3790 cm−1is attributed to the presence of hydroxyls bound to
a single octahedrally coordinated Al3+sites (type-Ib hydroxyl), while the broad feature at∼3593 cm−1characterizes H-bonded hydroxyls.
The hydroxyl spectra of the other samples (b−f) are similar to the spectrum of alumina (a), which is the main component in all materials. The IR spectra of the Pt-free mixed oxide supports (not shown) were similar to that of alumina, albeit revealing lower IR signal intensities, where IR intensities decreased in the following order Ce/Al > Zr/Al > Ce−Zr/Al. Implications of the attenuated −OH vibrational signal intensities provide important insights regarding the coordina-tion of Al3+, Ce4+, and Zr4+sites, which will be further discussed
along with CO adsorption experiments.
The spectra of the Pt-containing samples (activated/ reduced) (Figure 3, spectra b−f) reveal very similar IR features as compared to that of alumina. In other words, the hydroxyl stretching region of the IR spectra of all Pt-containing samples seem to be hardly sensitive to Ce and/or Zr incorporation as well as pretreatment steps (activation/reduction) used in the current work. It can also be seen that the band at 3769 cm−1in the spectrum ofγ-Al2O3(a) is shifted toward lower frequencies
at 3755 cm−1in the spectra of the Pt samples. These results indicated that during Pt deposition part of the hydroxyl groups of the support (those characterized by a band at 3769 cm−1) have reacted with the deposited species.
Note that IR spectroscopy is a very efficient technique to follow the degree of ceria reduction. The forbidden2F5/2−2F7/2
electronic transition of Ce3+ions is observed in the IR region at
ca. 2124 cm−1, and this band can be associated with the presence of oxygen vacancies.52,53 The spectra presented in
Figure 3[inset, spectra (c,e)] clearly indicate the existence of Ce3+ species on the reduced Pt/Ce/Al and Pt/Ce−Zr/Al
samples.
3.3.2. CO Adsorption at Low Temperature (100 K). Carbon monoxide is one of the most commonly used IR probe molecules and gives information on the existence and state of different surface acid and metallic sites.54Figure 4presents the
FTIR spectra in theν(CO) stretching region registered after low-temperature adsorption of CO (2.25 Torr CO equilibrium pressure) on pure γ-Al2O3 (used as a reference) and on activated and reduced forms of the Pt-containing samples.
Adsorption of CO on γ-Al2O3 at 100 K leads to the appearance of two main IR bands: Al3+−CO at 2187 cm−1and OH−CO at 2157 cm−1 (Figure 4, spectrum a).55 The same bands were also detected on the Pt-free Ce/Al, Zr/Al, and Ce− Zr/Al supports (not shown) and the Pt-containing samples (Figure 6, spectra a−c), although with different intensities.
Figure 3. FTIR background spectra of the activated and reduced samples in theν(O−H) stretching region. Spectra of the support: (a) pureγ-Al2O3and spectra of the Pt samples: (b,c) activated/reduced Pt/Ce/Al; (d,e) activated/reduced Pt/Ce−Zr/Al, and (f) reduced Pt/ Zr/Al. The inset of thefigure shows the spectra of the reduced (c) Pt/ Ce/Al and (e) Pt/Ce−Zr/Al samples within the spectral region 2260− 2000 cm−1.
Figure 4.FTIR spectra in theν(C−O) stretching region of CO (2.25 Torr CO equilibrium pressure) adsorbed at 100 K on activated (blue) and reduced (red) samples: (spectrum a) pureγ-Al2O3; (spectra b,c) Pt/Zr/Al; (spectra d,e) Pt/Ce/Al; (spectra f,g) Pt/Ce−Zr/Al. The insets of the figure show the spectral changes in the ν(C−O) stretching region of the reduced Pt samples (spectra c,g,e). The spectra are background- and CO gas-phase-corrected.
With the Pt-containing samples which were initially activated by calcination, all of the carbonyl bands formed after CO adsorption at 100 K disappeared after evacuation (data not shown) indicating weak adsorption. This also implies the absence of Ptn+−CO species which are known to demonstrate high stability. Therefore, on the activated samples, supported Ptn+sites were either coordinatively saturated or inaccessible.
The relative intensities of Al3+−CO (2187 cm−1) and OH−
CO (2156 cm−1) bands obtained after CO adsorption can also yield valuable insights regarding the interaction of ceria, zirconia and ceria−zirconia domains on alumina and its hydroxyls. Note that CO extinction coefficient for carbonyls without back π-donation hardly depends on the stretching frequency.54Therefore, it can be argued that a relatively high I2157cm−1/I2187cm−1 intensity ratio points out the extensive
presence of available hydroxyl groups that can interact with the CO probe molecule and relative scarcity of available Al3+
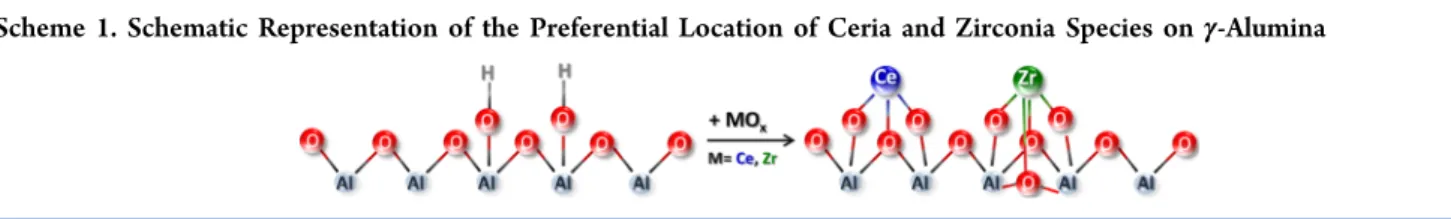
sites that can coordinate CO. Along these lines, it can be suggested that on the Pt/Ce−Zr/Al and Pt/Ce/Al samples, ceria has preferentially interacted with the alumina Lewis acid (Al3+) sites, whereas on the Pt/Zr/Al sample, zirconia mainly
affected the hydroxyl coverage (Scheme 1). The same conclusions are supported when analyzing the hydroxyl spectra of the samples (Figure 3). On the Pt/Ce−Zr/Al surface both Al3+−CO and OH−CO reveal attenuated intensities signifying a high dispersion of ceria and zirconia domains strongly interacting with alumina support.
With the Ce-containing materials (Pt/Ce/Al and Pt/Ce−Zr/ Al, spectra d,f) a new carbonyl band is detected at 2178 cm−1 (Figure 4, spectra d,f). This band is attributed to Ce4+−CO species. Indeed, it diminishes after the reduction of Ce4+ions to Ce3+(Figure 4, spectra e,g), which is in line with the proposed
assignment.
Finally, a weak feature around 2099 cm−1was observed with the Pt/Zr/Al sample (Figure 4, spectrum b) and will be discussed below.
Adsorption of CO on reduced Pt-containing samples (Figure 4, spectra c,e,g) results in the formation of Pt0−CO species as evident by the appearance of IR features within the 2100−2050 cm−1region. These bands are also shown in more detail in the inset ofFigure 4.
The highest intensity of the platinum−carbonyl band was registered with the Pt/Ce/Al sample (Figure 4, spectrum e). The maximum of the band is at 2072 cm−1, but a tail toward lower frequencies is detected (Figure 4, spectrum e). The 2072 cm−1 band is attributed to Pt−CO species and its relatively higher intensity indicates a high Pt dispersion. It is well-known thatν(CO) frequency is sensitive to the Pt coordination and shifts to lower frequencies when the Pt coordination decreases.56,57In particular, we assign the band at 2086 cm−1 to CO adsorption on terrace sites of the Pt(111) surface of large platinum crystallites,58while the feature at∼2060 cm−1is mainly due to CO adsorbed on the (111) facets of smaller Pt nanoparticles.56 The small feature at around 2099 cm−1 is ascribed to the CO species on-top at Pt(111) at high CO coverage.59
On the Pt/Ce−Zr/Al sample (Figure 4, spectrum g), the band at 2086 cm−1is less intense as compared to the case of the Pt/Ce/Al sample. This suggests either a low Pt dispersion (confirmed by the high CO stretching frequency) and/or covering of the Pt sites by the reducible oxide domains (e.g., ceria) exhibiting a dynamic surface morphology which is also known as the SMSI effect.48,60Clear evidence that this could influence the adsorptive properties of Pt species can be seen from the IR spectra of CO adsorption. The strong interaction of Pt oxide phase with Ce4+ ions into the Ce-containing
systems decreases the platinum and ceria reduction temper-ature. Thus, the adsorption of CO on the noble metal sites is much more pronounced. On the other hand, the intensity of the platinum−carbonyl band with the Pt/Zr/Al sample is very low. This, together with the high CO stretching frequency, indicates low Pt dispersion. Note that with this sample some metallic Pt sites were detected also with the activated sample and reduction has only resulted in the increase in the amount of the metallic species. As a conclusion, CO adsorption experi-ments reveal that for the reduced samples, the highest Pt dispersion is achieved on the Pt/Ce/Al.
3.3.3. Interaction of the Samples with NO at Ambient Temperature. In these experiments, small doses of NO were successively introduced onto the samples at ambient temper-ature (293 K) and the evolution of the adsorbed species on activated and pre-reduced Pt/Ce−Zr/Al, Pt/Ce/Al and Pt/Zr/ Al samples were followed by in situ FTIR spectroscopy (Figure 5). NO adsorption on the activated Pt/Ce/Al sample is Scheme 1. Schematic Representation of the Preferential Location of Ceria and Zirconia Species onγ-Alumina
Figure 5. FTIR spectra in the ν(N−O) stretching region of NO adsorbed (3.75 Torr NO equilibrium pressure) at RT on activated and reduced Pt/Ce−Zr/Al, Pt/Ce/Al, and Pt/Zr/Al samples. Evolution of the spectra during gradual adsorption of small doses of NO (spectra a−e) and NO adsorbed on the reduced and activated samples at 3.75 Torr NO equilibrium pressure (spectra f and f′). The spectra are background- and NO gas-phase-corrected.
negligible and leads to modest changes in the FTIR spectrum (Figure 5, spectrum f′). Several weak bands (at 1915, 1863, 1235, and 1175 cm−1) are observed in the spectra. The band at 1915 cm−1can be attributed to Ptn+−NO species, whereas the
band at 1863 cm−1 is most probably associated with N2O3
formation.61 In contrast, NO adsorption is much more pronounced on the reduced sample (Figure 5, spectra a−f). Immediately after the first NO dose, a strong band at 1778 cm−1 appears. This band is attributed to Pt0−NO species.62 With increasing NO exposure, two bands, at 2250 and 1912 cm−1, became visible. They can be assigned to adsorbed N2O
and Ptδ+−NO species, respectively.62,63The adsorption of NO on the reduced Pt samples reveals the existence of cationic (Ptn+) and metallic platinum. No Ptδ+ species were detected when CO was used as a probe molecule, suggesting that Ptδ+ sites were either formed as a result of oxidation of surface Pt0
sites by NO or the existing Ptδ+ sites were reduced by CO. Furthermore, the band at 1711 cm−1 also grows in intensity along with the band at 1912 cm−1. Therefore, it could be attributed to Pt0−NO complexes affected by the Ptδ+−NO
species. In addition, vibrational features at 1212 and 1165 cm−1 can be ascribed to nitrito species.61
Additional support for the assignment was obtained by analyzing the spectra of adsorbed15NO and14NO +15NO (see
Supporting Information, Figure S3). The isotopic red shift factor observed for the N2O species was 1.033 which coincides
with the expected theoretical factor for N−N bond vibrations.61 Isotopic red shift factors observed for other adsorbed NOx
species range between 1.019 and 1.022 verifying that they are due to N−O bonds (see Supporting Information, Table S1). Note that the appearance of nitrite bands located at 1212 and 1165 cm−1 on the reduced Pt/Ce/Al sample is at first sight surprising because nitrites are products of NO oxidation. However, it seems that these species are formed as a result of NO disproportionation catalyzed by metallic platinum. Indeed, N2O (2250 cm−1) was also detected as a reaction product of such a disproportionation process.
The Pt/Zr/Al sample (Figure 5) shows important differences as compared to Pt/Ce/Al. Relatively intense bands are observed after NO adsorption on the activated Pt/Zr/Al (Figure 5, spectrum f′). Briefly, the bands at 1231 and 1185 cm−1are attributed to nitrates, whereas the other bands in the 1600−1200 cm−1region are attributed to nitrates and possibly nitro species.61A weak feature around 1720 cm−1is attributed to Pt0−NO species. The spectra corresponding to NO adsorption on the reduced Pt/Zr/Al sample resembles those of the activated sample, exhibiting slightly higher IR intensities. These results are consistent with the above-made conclusion on the presence of large metallic platinum particles on both reduced and oxidized Pt/Zr/Al samples, leading to NO disproportionation. The platinum−nitrosyl band with the Pt/ Zr/Al sample has very low intensity compared with that of the Ce-containing samples. This can also be explained considering the promotional effect of the Pt and ceria interaction which enhances the adsorption of NO on noble metal sites. These results are consistent with the conclusion on the presence of large metallic Pt particles on both reduced/oxidized Pt/Zr/Al samples, leading to NO disproportionation. Therefore, we assign the band at 1720 cm−1 to NO on relatively large Pt particles.
For the Pt/Ce−Zr/Al sample (Figure 5), NO adsorption on the activated material is negligible (as with the Pt/Ce/Al sample), but reduction leads to the appearance of Pt0−NO
bands at 1778 and 1711 cm−1and appearance of nitrate/nitrite bands at 1570, 1225, and 1185 cm−1. In addition, N2O was also
formed and its amount was higher than that of the Pt/Ce/Al sample (the band at 2250 cm−1).
3.3.4. Coadsorption of NO and O2 at Ambient
Temper-ature. The nature of the adsorbed NOxspecies was also studied
upon coadsorption of NO and O2. First, NO (ca. 3.75 Torr equilibrium pressure) was introduced at ambient temperature into the IR cell. Then, small doses of O2 were successively added to the system to increase oxygen formal partial pressure up to 6 Torr. Figure 6 represents the evolution of the FTIR
spectra in theν(N−O) stretching region corresponding to the NOxadsorbed species formed upon the gradual increase of the
O2pressure on the activated Pt/Ce−Zr/Al sample. The insets of the figure shows the spectral changes in the ν(O−H) stretching region and in the region of overtones of nitrates and nitrites (2700−2450 cm−1), respectively.
As observed in Figure 6, the introduction of thefirst small doses of O2leads to the appearance of several bands at 1613,
1591, 1464, 1319, 1226, and 1075 cm−1 and shoulders at ∼1220, 1569, and 1621 cm−1. With further increase of the O
2
doses, all bands increase in intensity. However, the bands at 1464, 1319, 1226, and 1075 cm−1reach maximal intensities and then start to decline (Figure 6, spectrum h). In contrast, bands at 1650−1550, 1300−1250, and 1040 cm−1(some of them not initially observed) continue growing. Concomitant to these spectral changes, the process of NO + O2 adsorption is
accompanied by the appearance of three negative bands located in theν(OH) stretching region (the inset ofFigure 6) at 3770, 3756, and 3730 cm−1 and a new broad band at 3541 cm−1 develops. A comparative analysis of the IR spectra depicted in
Figure 6, clearly shows their significant resemblances with the NOxvibrational features reported in the former studies61,64−66
Figure 6.FTIR spectra in theν(N−O) stretching region of NO + O2 coadsorbed (0.5 kPa NO and 0.8 kPa Pa O2equilibrium pressure) at RT on activated Pt/Ce−Zr/Al sample. Evolution of the spectra during gradual adsorption of small doses of O2(spectra a−n) and NO + O2 coadsorbed on the sample surface (spectrum o) at 3.75 Torr NO and 6 Torr O2 equilibrium pressure. The insets of thefigure show the spectral changes in theν(O−H) stretching region and in the region of overtones of nitrates and nitrites. All spectra are background- and NO gas-phase-corrected.
focused on the FTIR spectroscopy preformed upon NOx adsorption on pure γ-Al2O3. Thus, our results can be
interpreted in the light of these numerous former studies in the literature as follows: atfirst, the introduction of small doses of O2 into the NO−Pt/Ce−Zr/Al system leads to an initial
increase in the concentration of the surface nitro/nitrito compounds. This is evidenced by the appearance of the bands at 1464, 1319, 1226, and 1075 cm−1. With increasing oxygen pressure, nitrites are oxidized to nitrates. The later process can be seen with the presence of an isosbestic point at∼1227 cm−1, between the band at 1267 cm−1(characterizing a vibration of bridged nitrates), and the one at 1226 cm−1 (indicating the presence of nitrito compounds). Thus, the bands at 1226 and 1319 cm−1were assigned to originate from the νas andνs, of
bridging nitrites, respectively. The bands at 1464 and 1075 cm−1 correspond to the ν(NO) and ν(N−O) modes, respectively, of nonsymmetric nitrites bound more strongly to the surface via one of the oxygen atoms.
Increasing the amount of O2 introduced enhances the
intensities of the nitrate-related IR bands at the expense of the nitrite features. Thus, in the spectrum acquired under NO + O2
equilibrium pressure (spectrum o) the most intense features are the ones of nitrates. The observed bands (split ν3 modes
around 1600 and 1300 cm−1) were assigned to the formation of different kinds of nitrates (bridged/bidentate).61,64−66
These arguments are further supported by the analysis of the NOx overtone and combination modes. At low oxygen exposures, a band at 2528 cm−1 is detected which is typical of nitrites. Then, various bands at higher frequencies (2580− 2640 cm−1) start to develop due to bidentate (1613, 1621, 1299 and 1591 cm−1) and monodentate (1569 and 1299 cm−1) nitrates. At least part of these nitrates is in vicinity of the alumina OH groups thus affecting the hydroxyl spectra.
To determine the nature of the adsorbed NOx species, we have carried out complementary NO + O2 absorption
experiments also with the Pt/Ce/Al and Pt/Zr/Al samples (Figure S4 “Supporting Information”). Coadsorption
experi-ments were also performed in an identical manner to that of the Pt/Ce−Zr/Al sample. The analysis of the FTIR spectra corresponding to the reference binary mixed oxide Pt-systems did not show any significant differences in the position and/or intensity of the IR bands. No evidence for the presence of bands due to different NOxspecies bonded to ceria or zirconia active sites was found. This was explained by the fact that the characteristic bands identifying the nitrito/nitrato (NO2−/
NO3−) species on the different adsorption sites appear in the
spectral region where the bands are overlapping. Co-adsorption of NO and O2on oxide surfaces may lead to the simultaneous formation of nitrito/nitrato complexes coordinated to the different cationic sites (Al3+, Ce4+, and Zr4+). Thus, this makes
the spectral differentiation between them very difficult and likely impossible.
To investigate the thermal stability of the adsorbed NOx
species, we have also carried out experiments in which the samples with the preadsorbed NO + O2 were evacuated at different temperatures (Figure S5, “Supporting Information”).
The results also did not show any important spectral differences that can be used to discriminate the relative thermal stabilities of adsorbed species on different adsorption sites. With increasing evacuation temperature up to 673 K, all bands decrease in intensity. However, in contrast to the Pt/Zr/Al system, the intensity of the nitrate bands in the spectra of Pt/ Ce−Zr/Al and Pt/Ce/Al samples strongly diminished after 623
K evacuation (Figure S5) and they disappeared almost completely upon evacuation at 673 K.
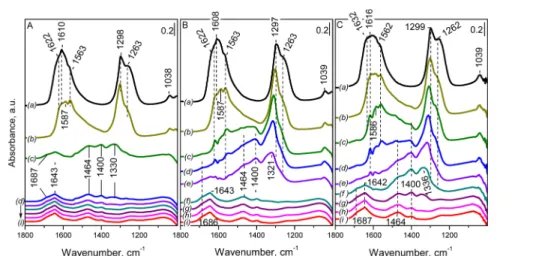
3.4. NOx-TPD. Further information regarding the structure and morphology of the Pt-containing catalysts was acquired from the NOx-TPD analysis carried out in the range of 298− 1100 K. The evolution of the total NOx (NO + NO2)
concentration as a function of temperature during the TPD is presented inFigure 7A. The N2O and O2desorption profiles
during the thermal NOx decomposition are also shown in
Figure 7B,C, respectively. The NOx-TPD curves obtained experimentally were deconvoluted into four peaks (as presented inFigure 7) using a Gaussian curve-fitting method. The obtained area under thefitted peaks was used to compare the different NOx adsorption contribution of the components in ternary/binary oxide systems. The results are presented in
Table 2.
As it can be seen (Figure 7A), in the TPD profile of the Pt/ Ce−Zr/Al sample (b), the decomposition of the surface nitrogen-oxo species initially resulted in an evolution of small amounts of NOx in the low-temperature region with a maximum at ca. 390 K. The obtainedfitted peak showed that
Figure 7. Evolution of the total NOx (NO + NO2 + N2O + N2) concentration as function of the temperature during TPD (panel A) over the Pt/Ce/Al (a); Pt/Ce−Zr/Al (b) and Pt/Zr/Al (c). Panels (B,C) show the N2O and O2concentration profiles during the thermal NOx decomposition. The NOx-TPD curves obtained after deconvo-lution of the experimental curves using a Gaussian curve-fitting method are also plotted in panel (A).
the desorbed NOxspecies is about 7% from the total amounts of NOxdesorbed on the sample (Table 2). Furthermore, with the temperature increase, the desorption process occurred by a release of significantly higher amounts of NOx, revealing two
desorption features in the high-temperature region: a shoulder at ca. 507 K and a peak at ca. 612 K. In addition, on the asymmetric high-temperature tail of the dominant TPD peak, the presence of a shoulder at∼701 K is visible.
The TPD profile (a) corresponding to the Pt/Ce/Al sample showed very similar NOx desorption features. However, in contrast to the Pt/Ce−Zr/Al catalyst, the NOx release was
observed to occur with the evolution of more strongly pronounced NOx desorption signal at ca. 507 K, while the
intensity of the feature at∼701 K is visibly suppressed. This can also be clearly seen from the calculated parameters, presented in Table 2. The TPD of the Pt/Zr/Al sample (profile c) presents also four NOx desorption features. The first very
minor peak was detected at ca. 390 K while the second major signal was registered as a broad and strongly asymmetric NOx desorption feature with several maxima at ca. 507, 612 and 701 K. In addition, it can be also seen in Figure 7B,C that NOx
decomposition is also accompanied by the production of small quantities of N2O and O2with concentration profiles following
a similar trend to that observed for the outlet NOx
concentration curves. Their release is much more pronounced and occurs at lower temperatures on the Pt/Ce-containing samples in comparison with the Pt/Zr/Al system.
The NOx-TPD of pureγ-Al2O3and Pt supported onγ-Al2O3,
CeO2, and CeO2/γ-Al2O3 systems have been thoroughly
discussed in various former reports.36,64,66−69 In agreement with them, the low-temperature TPD signal at ∼390 K in
Figure 7A was associated with the thermal decomposition of the weakly NOx adsorbed species, formed mostly on the Al3+
adsorption sites.
The second NOx desorption feature at ∼507 K, which is suppressed when ceria was partially replaced by ZrO2into the
Ce−Zr/Al system, can be tentatively assigned to the desorption of the more stable nitrates bound to surface CeO2 species
strongly interacting with the Pt. The desorption feature at ca. 612 K is attributed to the decomposition of the NOx species
strongly bonded to bulk CeO2. The shoulder at ∼701 K is much more pronounced into Pt/Zr-containing systems and it is likely due to desorption of more stable NOx ad-species on zirconia. The amount of NOxdesorbed is about 50% from the
total NOxdesorbed from Pt/Ce−Zr/Al and Pt/Zr/Al samples. These results show that the sample is characterized by the presence of at least two different types of NOxspecies adsorbed on ceria and another adsorbed on zirconia with distinctively different thermal stabilities.
Comparing the total integrated areas under the NOx desorption peaks in the TPD profiles (Table 1) indicates that slightly less NOx was stored on the Pt/Ce−Zr/Al sample compared to the reference binary oxide system having higher CeO2content. On the other hand, the Pt/Ce−Zr/Al sample is characterized by NOxstorage ability identical to that of the Pt/
Zr/Al system, indicating its weaker dependence on zirconia loading. Thus, it can be suggested that the NOx adsorption
ability of the Pt/Ce−Zr/Al catalyst is most likely due to the high promoter metal oxide dispersion achieved in the presence of both ceria and zirconia species on the surface, providing additional adsorption sites that are able to store NOx.
Table 2. Calculated Parameters Obtained via NOx-TPD Analysis
NOx-TPD samples atotal integrated areas under NO
x-related desorption features (arb. units)× 10−3 peak-I % peak-II % peak-III % peak-IV %
Pt/Ce/Al 4.5 7.9 25.7 39.7 26.7
Pt/Ce−Zr/Al 3.6 4.8 24.4 19.0 51.8
Pt/Zr/Al 3.6 7.1 18.4 20.2 54.3
aObtained by considering the QMS fragmentation patterns of all of the major NO
xdesorption species (i.e., NO2, NO, N2, and N2O) in the NOx -TPD data (seeSupporting Informationfor details). NOx-TPD curves obtained experimentally were deconvoluted using a Gaussian curve-fitting method. The obtained area under thefitted peaks was used to compute the different NOxadsorption contribution of the components in ternary/ binary oxide systems.
Figure 8.FTIR spectra in theν(N−O) stretching region of reduction of ad-NOxspecies with H2(22.5 Torr H2equilibrium pressure) on activated Pt/Ce−Zr/Al (panel A), Pt/Ce/Al (panel B), and Pt/Zr/Al (panel C) samples (spectrum a at RT) and evolution of the spectra after each step of increasing the temperature in the range of 298−673 K (spectra b−i). The spectra are background- and NO gas-phase-corrected.
3.5. Reduction of the Adsorbed NOx Species by H2:
FTIR Studies. The reducibility of the adsorbed NOx species
was studied by using H2 as a reducing agent. In these
experiments,first, nitrate species were produced on the samples as described above, followed by evacuation at ambient temperature. In the next step, H2 (22.5 Torr equilibrium
pressure) was added to the NOx-saturated samples at RT, and the IR spectra were recorded after different temperatures of interaction between 298 and 673 K. The series of IR spectra collected in the experiments performed with the activated Pt/ Ce−Zr/Al sample are displayed in the ν(N−O) stretching region [Figure 8A (spectra a−i)]. For comparison, the evolution of the FTIR spectra during the reduction process of the adsorbed NOxspecies on the activated Pt/Ce/Al and Pt/ Zr/Al samples are presented inFigure 8B,C, respectively.
The introduction of H2at RT to the Pt/Ce−Zr/Al sample
hardly affects the IR spectrum of the adsorbed species (Figure 8A, spectrum a). Increase in the reduction temperature (323 and 373 K) resulted in the attenuation of the intensity of all nitrate-related IR bands (Figure 8, spectra b,c). Particularly, this can be seen in the spectrum acquired at 373 K in the presence of H2 (spectrum c) where the bands due to NOx adsorbed
species almost completely vanished. The process of reduction of the adsorbed NOx species at 373 K coincides with the
appearance of a new set of bands at 1643, 1464, 1400, and 1330 and a shoulder at 1687 cm−1. These features can also be distinguished in the spectra obtained at temperatures in the range of 423−673 K (spectra d−i). The band at 1643 cm−1is attributed to the bending mode (δH−O−H) of molecularly adsorbed water while the feature at 1464 and the shoulder at ∼1687 cm−1are assigned to deformation vibrations of NH
4+
-adsorbed species.70,71
Previous studies64,72 showed that water strongly affects the spectra of the surface nitrates and it was also proposed that formation of water during the reduction of the adsorbed NOx
species with H2may induce significant phase transformations of
preadsorbed NOx into bulk-like nitrate species. The formation
of this new type of bulk-like nitrate species in our study is supported by the appearance of characteristic broad band at 1330 cm−1 and the features at 1400 and 1320 cm−1 (Figure 8A).64,72The intensities of these features initially increase at the beginning of the reduction process (Figure 8A, spectrum c) and then starts to diminish gradually with a further increase in the reduction temperature (spectra d−i).
Comparison of the spectra presented inFigure 8reveals that the reduction of adsorbed NOx species with H2over the Pt/
Ce−Zr/Al system (Figure 8A) appears to be much easier as compared to the Pt/Ce/Al and Pt/Zr/Al samples (Figure 8B,C). This can readily be seen even at 423 K for Pt/Ce−Zr/Al (Figure 8A, spectrum d) where the nitrate-related bands almost completely vanish, whereas at the same temperature on Pt/Ce/ Al and Pt/Zr/Al samples (Figure 8B,C, spectra d), they are still well visible. The appearance of an intense band at 1643 cm−1 on Pt/Ce−Zr/Al due to molecular adsorbed water at much lower temperatures (373 K) also strongly suggests that the NOx
reduction process is much more facilitated over the Pt/Ce−Zr/ Al system compared with the other two samples. Overall, comparison of the spectra of the Pt/Ce/Al and Pt/Zr/Al samples also showed that the process of reduction of the NOx ad-species with H2is much more facile on the Pt/Ce/Al sample
compared with the Pt/Zr/Al system. This also clearly shows the promotional effect of ceria in the NOxreduction.
Similar results were also obtained in the studies performed from some of us where the reduction of the stored NOxspecies
with H2was investigated over ceria-promoted NSR catalysts.15 The positive effect of ceria-promoted surface on the NOx
reduction has been explained because of the enhancement of the total amount of activated hydrogen on the catalyst surface and lowering of the thermal threshold for hydrogen activation. Direct evidence for this was obtained from the currently presented H2-TPR analysis. In addition, the hydrogen activation was observed to occur in concert with ceria reduction and generation of oxygen vacancies.15It was also found that the effect can be enhanced when ceria and zirconia co-exist into the system.73
4. CONCLUSIONS
The main conclusions of the presented results can be summarized as follows:
(a) The porous and crystalline structure of the synthesized Pt/CeO2−ZrO2/Al2O3 catalyst was found to be only
slightly affected compared with the reference Pt/CeO2/ γ-Al2O3and Pt/ZrO2/γ-Al2O3systems. In the mixed Ce−
Zr-containing material, ceria exists as a crystalline CeO2
phase with afluorite structure while zirconia is presented mostly in a highly disordered amorphous form, and/or a highly dispersed oxide phase with small particulate size. The use of CO as a probe molecule revealed that during the synthesis of the mixed-metal oxide systems, deposited zirconia preferentially interacted with the alumina hydroxyls, while deposited ceria was preferen-tially located at the Lewis acid sites. When deposited on ZrO2/Al2O3, platinum formed relatively big particles and existed in metallic state even in the nonreduced sample. (b) Despite the limited extent of Zr4+ions incorporated into the CeO2 lattice, the reduction of ceria was promoted and occurred at lower temperatures in the presence of zirconia. As revealed by H2-TPR, the presence of Pt may
also significantly alter the reduction behavior of ceria leading to lowering the reduction temperature and splitting of the reduction process into two different temperature regions. The low-temperature region was associated with reduction of the Pt oxide phase and Ce4+
ions of the well-dispersed CeO2 surface species in the
vicinity of the Pt sites. In contrast, reduction of segregated CeO2 domains positioned far from the
noble metal sites occurs at higher temperatures. (c) Nature of the adsorbed NOx species was studied upon
adsorption of NO and co-adsorption of NO and O2. NO
adsorption on nonreduced Pt-containing materials was negligible but was enhanced on the reduced samples because of Pt0-promoted NO disproportionation. Thus, the NO adsorption can be described in the reaction where the presence of metallic Pt into the samples could provoke electron transfer which could lead to the formation of nitrosyl complexes (bands at 1778 and 1912 cm−1 assigned to Pt0−NO and Ptδ+−NO,
respectively). On the other hand, this is expected to weaken the N−O bond, leading to a high probability of NO disproportionation catalyzed by metallic Pt to N2O
formation (band at∼2250 cm−1). The effect is enhanced when ceria and zirconia co-exist into the system. NOxadsorption in the initial steps of O2doses occurs by the formation of nitrites, followed by their conversion to different
type surface nitrates with the increasing O2pressure. Further information regarding the thermal stability of the NOx
-adsorbed species was acquired from the NOx-TPD analysis. These results showed that the Pt/Ce−Zr/Al sample is characterized by the presence of at least two different types of NOx species adsorbed on ceria and another adsorbed on
zirconia with distinctively different thermal stabilities. The relative stability of the NOx species adsorbed on the Pt/Ce−
Zr/Al system increases in the following order: NOx on Al3+
adsorption sites < NOx species on surface CeO2 species
strongly interacting with the Pt < NOxspecies strongly bonded to bulk CeO2< NOx-adsorbed species on zirconia.
(d) To elucidate the catalytic functionality of the ceria and zirconia-promoted Pt/Al2O3catalyst, the reduction of the adsorbed NOx species by using H2as a reducing agent
was studied by in situ FTIR spectroscopy. Despite the higher thermal stability of the NOx-adsorbed species
bonded to ceria and zirconia, NOx reduction in the
presence of H2is much more facilitated over the Pt/Ce− Zr/Al catalyst. Thus, it was suggested that the main difference in the functionality could be related to the ability of the catalysts to initiate the NOx reduction
process through lowering the temperature of hydrogen activation on the catalyst surface.
■
ASSOCIATED CONTENT*
S Supporting InformationThe Supporting Information is available free of charge on the
ACS Publications websiteat DOI:10.1021/acs.jpcc.8b03186. NOx-TPD; main diffraction peak (111) of CeO2 in the XRD patterns of the Pt samples: Pt/Ce-Zr/Al and Pt/ Ce/Al; representative bright-field TEM images of Pt/Ce-Zr/Al, Pt/Ce/Al, and Pt/Zr/Al catalysts; FTIR spectra of 14NO, 15NO, and 14NO + 15NO adsorbed (3.75 Torr NO equilibrium pressure) at RT on reduced Pt/Ce/Al sample; assignment obtained by analyzing the spectra of adsorbed 14NO and 15NO over reduced Pt/Ce/Al sample: band position and isotopic red shift factor; FTIR spectra of NO + O2coadsorbed (0.5 kPa NO and 0.8 kPa Pa O2equilibrium pressure) at RT on activated Pt/
Ce/Al and Pt/Zr/Al samples; and FTIR spectra of NO + O2 coadsorbed (3.75 Torr NO and 6 Torr O2
equilibrium pressure) at RT on activated Pt/Zr/Al, Pt/ Ce/Al, and Pt/Ce-Zr/Al samples and evolution of the spectra after each step of increasing the temperature in the range of 298−673 K under dynamic vacuum (PDF)
■
AUTHOR INFORMATIONCorresponding Authors
*E-mail:[email protected](E.O.). *E-mail:[email protected](K.H.). ORCID
Emrah Ozensoy:0000-0003-4352-3824
Konstantin Hadjiivanov: 0000-0002-7622-4620
Notes
The authors declare no competingfinancial interest.
■
ACKNOWLEDGMENTSThe authors gratefully acknowledge thefinancial support by the Bulgarian National Science Fund (project no. DN 19/2). We also thank the Bulgarian Academy of Sciences (BAS) and
Technical Research Council of Turkey (TUBITAK) (BAS project code: 32-33-41/25.11.2015 and TUBITAK project code: 215M170). E.O. also acknowledges the scientific collaboration with TARLA project founded by the Ministry of Development of Turkey (project code: DPT2006K-120470). Authors acknowledge SASOL GmbH for providing Puralox alumina support materials.
■
REFERENCES(1) Fang, H. L.; DaCosta, H. F. M. Urea thermolysis and NOx reduction with and without SCR catalysts. Appl. Catal., B 2003, 46, 17−34.
(2) Gil, S.; Garcia-Vargas, J. M.; Liotta, L. F.; Vernoux, P.; Giroir-Fendler, A. Single brick solution for lean-burn DeNOx and soot abatement. Perovskites Relat. Mixed Oxides 2015, 35, 797−816.
(3) Matsumoto, S.; Ikeda, Y.; Suzuki, H.; Ogai, M.; Miyoshi, N. NOx storage-reduction catalyst for automotive exhaust with improved tolerance against sulfur poisoning. Appl. Catal., B 2000, 25, 115−124. (4) Yamazaki, K.; Suzuki, T.; Takahashi, N.; Yokota, K.; Sugiura, M. Effect of the addition of transition metals to Pt/Ba/Al2O3catalyst on the NOx storage-reduction catalysis under oxidizing conditions in the presence of SO2. Appl. Catal., B 2001, 30, 459−468.
(5) Hirata, H.; Hachisuka, I.; Ikeda, Y.; Tsuji, S.; Matsumoto, S. NOx Storage-reduction three-way catalyst with improved sulfur tolerance. Top. Catal. 2001, 16/17, 145−149.
(6) Jacobs, G.; Williams, L.; Graham, U.; Thomas, G. A.; Sparks, D. E.; Davis, B. H. Low temperature water−gas shift: in situ DRIFTS-reaction study of ceria surface area on the evolution of formates on Pt/ CeO2fuel processing catalysts for fuel cell applications. Appl. Catal., A 2003, 252, 107−118.
(7) Burch, R. Knowledge and Know-How in emission control for mobile applications. Catal. Rev.: Sci. Eng. 2004, 46, 271−334.
(8) Liu, G.; Gao, P.-X. A review of NOxstorage/reduction catalysts: mechanism, materials and degradation studies. Catal. Sci. Technol. 2011, 1, 552−568.
(9) Roy, S.; Baiker, A. NOx Storage-reduction catalysis: From mechanism and materials properties to Storage-reduction perform-ance. Chem. Rev. 2009, 109, 4054−4091.
(10) Bormann, C.; Rodríguez, N.; Araya, P.; Guerrero, S. Highly active Rb/Cu/YCeO2catalyst for the storage of nitric oxide under lean conditions. Catal. Commun. 2016, 76, 76−81.
(11) Tang, C.; Zhang, H.; Dong, L. Ceria-based catalysts for low-temperature selective catalytic reduction of NO with NH3. Catal. Sci. Technol. 2016, 6, 1248−1264.
(12) Mukherjee, D.; Rao, B. G.; Reddy, B. M. Characterization of ceria-based nano-oxide catalysts by Raman Spectroscopy. Top. Catal. 2017, 60, 1673−1681.
(13) Ganduglia-Pirovano, M. V.; Hofmann, A.; Sauer, J. Oxygen vacancies in transition metal and rare earth oxides: Current state of understanding and remaining challenges. Surf. Sci. Rep. 2007, 62, 219− 270.
(14) Kašpar, J.; Fornasiero, P.; Graziani, M. Use of CeO2-based oxides in the three-way catalysis. Catal. Today 1999, 50, 285−298.
(15) Say, Z.; Vovk, E. I.; Bukhtiyarov, V. I.; Ozensoy, E. Influence of ceria on the NOxreduction performance of NOx storage reduction catalysts. Appl. Catal., B 2013, 142−143, 89−100.
(16) Peralta, M.; Milt, V.; Cornaglia, L.; Querini, C. Stability of Ba,K/ CeO2 catalyst during diesel soot combustion: Effect of temperature, water, and sulfur dioxide. J. Catal. 2006, 242, 118−130.
(17) Kwak, J. H.; Kim, D. H.; Szanyi, J.; Peden, C. H. F. Excellent sulfur resistance of Pt/BaO/CeO2 lean NOx trap catalysts. Appl. Catal., B 2008, 84, 545−551.
(18) Miura, M.; Aoki, Y.; Kabashima, N.; Fujiwara, T.; Tanabe, T.; Morikawa, A.; Ori, H.; Nihashi, H.; Matsui, S. Development of advanced three-way catalyst with improved NOx conversion. SAE Technical Paper, 2015; 2015−01−1002.