HYBRID AND MODEL BASED
APPROACHES FOR NEW BCI SPELLERS
a thesis submitted to
the graduate school of engineering and science
of bilkent university
in partial fulfillment of the requirements for
the degree of
master of science
in
electrical and electronics engineering
By
Suleman Aijaz Memon
July 2019
Hybrid and Model Based Approaches for New BCI Spellers By Suleman Aijaz Memon
July 2019
We certify that we have read this thesis and that in our opinion it is fully adequate, in scope and in quality, as a thesis for the degree of Master of Science.
Yusuf Ziya Ider(Advisor)
Hacı Hulusi Kafalıg¨on¨ul
Ye¸sim Serina˘gao˘glu Do˘grus¨oz
Approved for the Graduate School of Engineering and Science:
Ezhan Kara¸san
ABSTRACT
HYBRID AND MODEL BASED APPROACHES FOR
NEW BCI SPELLERS
Suleman Aijaz Memon
M.S. in Electrical and Electronics Engineering Advisor: Yusuf Ziya Ider
July 2019
Electroencephalography (EEG) based brain-computer interfaces (BCIs), due to their non-invasive, portable and temporal resolution properties, are widely used in the field of neural engineering. In order to make BCI paradigms more practical and feasible for real life applications, new approaches are being tested such as hybrid BCIs and model based BCIs. In the first phase of this study, a novel hybrid speller BCI is proposed, incorporating P300 and code-modulated visual evoked potential (c-VEP) paradigms, with the objective of improving the spelling accuracy and information transfer rate (ITR), compared to individual P300 and c-VEP paradigms. Moreover, fusion techniques have been applied in order to effectively combine the information of P300 and c-VEP at the score level. We have implemented and compared two different approaches, linear discriminant analysis (LDA) and maximum probability estimation (MPE), in order to identify which one works best for this hybrid BCI. The proposed BCI consists of 36 targets presented as 6x6 matrix on screen with a refresh rate of 120 Hz. Seven healthy subjects participated in experiments where each subject performed a training session followed by five test sessions. The P300 and c-VEP signals are obtained by using bandpass filters of 0.5-6 Hz and 6-41 Hz respectively, on the raw hybrid data. For P300, stepwise linear discriminant analysis (SWLDA) is performed on training data from all the 10 EEG channels to obtain the feature vector. For c-VEP, canonical correlation analysis (CCA) is performed on training data to obtain the reference templates for all 36 symbols. In comparison with the accuracy and ITR values of c-VEP alone, that is without simultaneously making use of the P300 data obtained during the hybrid experiments, MPE-based hybrid improved only by 1.1% and 2.1 bits/min, on average, respectively, whereas the values worsened by 12.3% and 19.8 bits/min in the case of LDA-based hybrid. Moreover, the statistical tests on the mean accuracy and ITR values of all the
iv
not statistically different (p=0.293). Although the MPE-based hybrid is not statistically better than the c-VEP alone, it can be highly effective if the primary goal is to only increase the accuracy, using a range of improvements in P300 methods as discussed in conclusion. However, it would not be useful if the purpose is to increase the speed of the speller since the individual c-VEP paradigm, when optimized for timing, has the capability of giving an average ITR of 114.9bits/min or higher, on its own. In the second phase of this study, model based c-VEP BCI is implemented, aimed at improving the training time compared to the case where all the targets are assigned arbitrary pseudorandom binary sequences and training is required for all the symbols separately. For this purpose, moving average model has been implemented to simulate the responses for c-VEP visual stimulation patterns, for 60Hz and 120Hz monitor refresh rate respectively. The average of the correlation between measured response and modeled response for 60Hz and 120Hz is 0.357 and 0.396 respectively. The average accuracy and ITR obtained for model based c-VEP BCI is 87.1% and 76.4 bits/min for 60Hz respectively and 82.1% and 72.4 bits/min for 120Hz respectively. Modeling results suggest that it is possible to perform a training on a single visual stimulus pattern and achieve a good fit model.
Keywords: Brain-computer interface (BCI), Electroencephalogram (EEG), P300, code-modulated visual evoked potential (c-VEP), stepwise linear discriminant analysis (SWLDA), canonical correlation analysis (CCA), maximum probability estimation (MPE), modeling, moving average..
¨
OZET
HIBRIT VE MODEL BAZL˙I YENI HECELEYICI
BEYIN-BILGISAYAR ARAY ¨
UZLERI
Suleman Aijaz Memon
Elektrik ve Elektronik M¨uhendisli˘gi, Y¨uksek Lisans Tez Danı¸smanı: Yusuf Ziya ˙Ider
Temmuz 2019
Elektroansefalografi (EEG) tabanlı beyin-bilgisayar aray¨uzleri (BBA) m¨udahalesiz olması, ta¸sınabilir olması ve zamansal ¸c¨oz¨un¨url¨u˘g¨un¨un iyi olması sebebiyle n¨oral m¨uhendislik alanında sık¸ca tercih edilmektedirler. BBA paradigmalarını g¨unl¨uk uygulamalar i¸cin daha pratik ve uygulanabilir hale getirmek amacıyla, hibrit BBA’lar ve model tabanlı BBA’lar gibi yeni yakla¸sımlar denenmektedir. Bu ¸calı¸smanın ilk a¸samasında, tek ba¸sına P300 ve tek ba¸sına kod mod¨ulasyonlu g¨orsel uyarılmı¸s potansiyel (KMGUP) paradigmalarının elde edebilece˘ginen daha y¨uksek do˘gruluk oranı ve bilgi aktarım hızı (BAH) geli¸stirmek amacıyla gelenek-sel P300 ve KMGUP paradigmalarını birle¸stiren yeni bir hibrit heceleyici BBA ¨
onerilmi¸stir. Buna ek olarak, P300 ve KMGUP verilerini en son karar a¸samasında skor d¨uzeyinde etkili bir ¸sekilde birle¸stirmek i¸cin f¨uzyon teknikleri uygulanmı¸stır. Geli¸stirilen hibrit BBA i¸cin iki farklı yakla¸sım, do˘grusal ayrımcı analizi (linear discriminant analysis (LDA)) ve maksimum olasılık tahmini (maximum prob-ability estimation (MPE)), uygulanmı¸stır ve performansları kar¸sıla¸stırılmı¸stır.
¨
Onerdi˘gimiz BBA, 120 Hz yineleme hızına sahip bir ekranda 6x6 matris dizilim-ine sahip 36 hedeften olu¸smaktadır. Her bir dene˘ge bir e˘gitim seansından sonra be¸s test seansının uygulandı˘gı deneylere 7 sa˘glıklı denek katılmı¸stır. Deneylerde kaydedilen ham EEG’den P300 ve KMGUP sinyalleri sırasıyla 0.5-6 Hz bant ge¸ciren filtre ve 6-41 Hz bant ge¸ciren filtre uygulanarak elde edilmi¸stir. P300 i¸cin, ¨oznitelik vekt¨or¨un¨u elde etmek amacıyla 10 EEG kanalından alınan e˘gitim verileri ¨uzerinde a¸samalı olarak lineer ayırma analizi (stepwise linear discrim-inant analysis (SWLDA)) uygulanmaktadır. KMGUP i¸cin ise 36 hedef i¸cin ¸sablon elde etmek amacıyla e˘gitim verisi ¨uzerinde kanonik korelasyon anal-izi (KKA) uygulanmaktadır. Hibrit deneylerinde elde edilen veriden P300 verisini kullanmayıp sadece kmGUP verisini kullanarak yapılan KMGUP ile kar¸sıla¸stırıldı˘gında MPE-tabanlı hibrit paradigma, do˘gruluk ve BAH de˘gerlerini
vi
ortalamada sırasıyla %1.1 ve 2.1 bit/dk kadar arttırmı¸stır. LDA-tabanlı hib-rit paradigma kullanıldı˘gında ise bu de˘gerlerin %12.3 ve 19.8 bit/dk kadar azaldı˘gı g¨ozlemlenmi¸stir. Bunlara ek olarak, b¨ut¨un deneklerin do˘gruluk ve BAH de˘gerlerinin ortalaması ¨uzerinden yapılan istatistiki testler, MPE-tabanlı hibrit paradigma ve hibrit-tabanlı KMGUP paradigmasının istatistiki olarak farklı ol-madı˘gını g¨ostermektedir (p=0.293). MPE-tabanlı hibrit paradigma her ne kadar istatistiki olarak daha iyi olmasa da temel ama¸c do˘gruluk oranını arttırmak ise bu ¸calı¸smanın sonu¸c b¨ol¨um¨unde tartı¸sıldı˘gı ¨uzere P300 y¨ontemlerinde yapılacak geli¸stirmeler ile beraber bu hibrit paradigmanın kullanılması olduk¸ca etkili ola-caktır. Ote yandan, ama¸c heceleyicinin hızını arttırmak ise bu y¨¨ ontem fay-dalı olmayabilir, ¸c¨unk¨u KMGUP paradigması, zamanlama a¸cısından optimize edildi˘ginde, kendi ba¸sına ortalamada 114.9 bit/dk veya daha fazlası kadar bir BAH elde edebilmektedir. C¸ alı¸smanın ikinci a¸samasında ise, heceleyicideki her hedefe atanan kod sekansının rastgele se¸cildi˘gi ve bu y¨uzden b¨ut¨un hedefler i¸cin ayrı ayrı e˘gitim gerekti˘gi durumda, e˘gitim i¸cin gereken s¨urenin azaltılması amacıyla model-tabanlı bir KMGUP BBA geli¸stirilmi¸stir. Bu ama¸cla, sırasıyla 60 Hz ve 120 Hz monit¨or yineleme hızı i¸cin KMGUP g¨orsel stim¨ulasyonlarına ver-ilen tepkeleri sim¨ule etmek i¸cin hareketli ortalama modeli uygulanmı¸stır. ¨Ol¸c¨ulen tepkeler ile modelden elde edilen tepkeler arasındaki ortalama korelasyon 60 Hz i¸cin 0.357, 120 Hz i¸cin ise 0.396’dır. Model-tabanlı KMGUP BBA’nın ortalama do˘gruluk ve BAH de˘gerleri 60 Hz i¸cin sırasıyla %87.1 ve 76.4 bit/dk, 120 Hz i¸cin sırasıyla %82.1 ve 72.4 bit/dk’dır. Modelleme sonu¸cları, tek bir g¨orsel uyaran d¨uzeninde bir e˘gitim ger¸cekle¸stirdikten sonra elde edilen veriler kullanılarak uy-gun bir model elde etmenin m¨umk¨un oldu˘gunu g¨ostermektedir.
Anahtar s¨ozc¨ukler : Beyin-Bilgisayar Aray¨uz¨u (BBA), Elektroansefalografi (EEG), P300, kod-mod¨ulasyonlu g¨orsel uyarılmı¸s potansitel (KMGUP), stepwise linear discriminant analysis (SWLDA), kanonik korelasyon analizi (KKA), mak-simum olasılık tahmini (MPE), modelleme, ridge regresyonu.
Acknowledgement
First and foremost, I want to express eternal gratitude to my parents for their love and faith in me. They may not be here with me today, but remembering them gives me the strength I need to work harder and chase my dreams. Thank you, Ami and Abu.
I would like to thank my supervisor, Professor Yusuf Ziya ˙Ider of the Department of Electrical and Electronics Engineering, for his guidance, encouragement, and constant feedback. His constructive criticism as well as praise always motivated me to push my limits, and I have been extremely lucky to have a supervisor who cared so much about my work, and who responded to my questions so promptly.
I also want to express my gratitude to Assistant Professor Hacı Hulusi Kafalıg¨on¨ul as his course on neuroscience proved to be very helpful for me during my research.
I am also grateful to the BCI Group members, Abdul Waheed, Muhammad Nabi, and Toygun Ba¸saklar, who have been great friends and mentors, for their valuable support, constant guidance, and smart ideas in the organization and operation of the experiments. My thesis would not have been possible without some fun and they made sure I had it.
I gratefully acknowledge the funding received from the Scientific and Techno-logical Research Council of Turkey (T ¨UB˙ITAK) under Grant 116E153 during my MSc studies.
I also want to thank my friend, Faria, who proofread my thesis several times, and for her continued support and encouragement.
Finally, completing this work would have been all the more difficult were it not for my loving sisters, Shafaque, Laila, and Sara, and guardians, Abujan and Amijan,
Contents
1 Introduction 1
1.1 Background . . . 1
1.1.1 Brain-Computer Interfaces (BCIs) . . . 1
1.1.2 Electroencephalography (EEG) . . . 3
1.1.3 Visual Evoked Potential (VEP) . . . 6
1.1.4 Code-Modulated Visual Evoked Potential (c-VEP) . . . . 6
1.1.5 P300 Evoked Potential . . . 9
1.1.6 Previous Hybrid BCIs . . . 10
1.1.7 Model Based Paradigms for BCI Design . . . 11
1.2 Objective and Scope . . . 12
1.3 Organization of Thesis . . . 14
2 Materials and Methods 15 2.1 Hybrid Stimulus Design . . . 15
CONTENTS ix 2.2 Experimental Setup . . . 19 2.2.1 Subjects . . . 19 2.2.2 Data Collection . . . 19 2.2.3 Experimental Procedure . . . 20 2.3 Signal Processing . . . 23 2.3.1 P300 Detection . . . 24 2.3.2 c-VEP Detection . . . 27
2.3.3 Fusion of P300 and c-VEP Scores . . . 28
2.3.4 Modeling of c-VEP Responses . . . 32
2.4 Performance Evaluation . . . 34
3 Results 35 3.1 Stimulus Measurements . . . 35
3.2 Initial P300 Study . . . 37
3.3 Hybrid Experiment Results . . . 41
3.3.1 P300 Results . . . 41
3.3.2 c-VEP Results . . . 44
3.3.3 Accuracy and ITR of Hybrid BCI Speller . . . 46
CONTENTS x
4 Discussion and Conclusion 52
A Data Acquired During the Experiments 64
List of Figures
1.1 Simple flow diagram of any BCI design . . . 3
1.2 10-20 International Electrode Placement System . . . 5
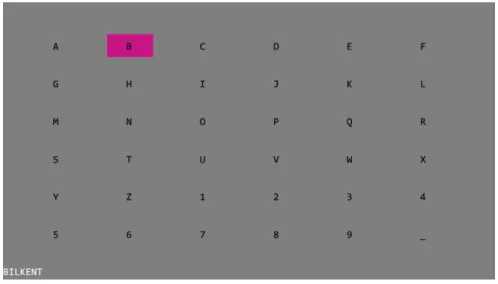
1.3 The figure shows one of the frames of our hybrid BCI speller design where 36 targets (letters/numbers) are presented as 6x6 matrix on screen with each target flickering with its different pseudorandom binary sequence. The first two columns are flashed simultaneously. If the subject performs a mental task at the onset of the flash, it generates the P300-evoked potential. . . 8
LIST OF FIGURES xii
2.1 The figure explains the design and the superimposed hybrid frame. Note that all these frames were captured at different time instants during a test session just to give an idea about the design. The monitor refresh rate was set to 120 Hz and each frame was dis-played on the screen after 1201 = 8.3ms. (a) We turned off the P300 flashes and only the c-VEP stimulus was shown. Here the cell background of each target is green or blue depending on the corresponding bit sequence of each letter/symbol, green if the bit value is ‘1’ and blue if the bit value is ‘0’. (b) This frame shows only the P300 stimulus and at that instance only, second and third rows were flashed. Single flash had the active time (font color be-comes white) of 100 ms and the passive time (font color returns to default black) of 150 ms. (c) This frame shows the superimposed hybrid stimulus frame. P300 set the timing of the hybrid stimula-tion sequence; in the training stage, the seqeunce was repeated for 50 P300 trials and in the test stage, only a single trial was performed. 17
2.2 Default frame of the hybrid speller design showing the grouped, rows, columns, and targets for P300 Paradigm. . . 18
2.3 This frame shows the cue presented to the subject so that he should shift gaze and focus on the pink highlighted symbol. In our exper-iments, only 1 second was given for gaze-shifting. This frame was captured during the test stage which also provided the feedback (decided target) from the recording computer on the bottom left corner. However, in the training stage no such feedback was pro-vided; only the user was given the cue to focus his gaze and the sequence started in a standard manner. . . 21
LIST OF FIGURES xiii
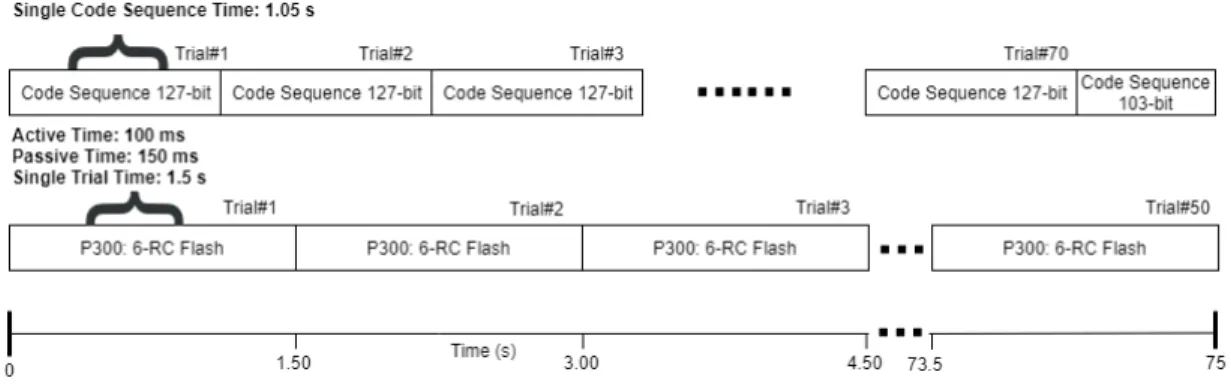
2.4 Single c-VEP code sequence took 1.06s and single P300 flashing sequence took 1.5s. In c-VEP, each bit was displayed for 8.3ms and single P300 flash was displayed for 250ms. In the duration of a single flash of P300, 250
8.3 = 30 c-VEP bits were displayed. The
training session lasted for 75s and during that time, 50 P300 tri-als and 70 tritri-als of 127-bit length c-VEP stimulation code were repeated. In addition to the 70 trials of c-VEP, we displayed start-ing 103 bits of the stimulation code to complete the 75s of the training session. However, the c-VEP responses from the last 103 bits were discarded in the signal processing stage. . . 22
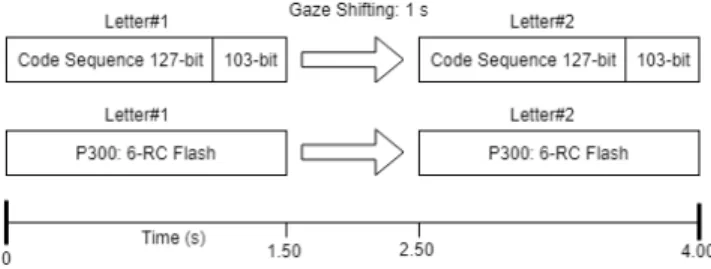
2.5 This figure shows the timing diagram of the test session for 2 let-ters. After 1 second of the cue presented on the screen, the code sequence started and the stimulation sequence continued for 1.5s. Again, for each letter, we repeated the starting 103 bits of c-VEP code sequence to complete the 1.5s test sequence for single let-ter. After the completion of the sequence, the stimulator computer raisec the TCP flag to notify the recording station. The recording computer performed the processing and sent the classified target letter back to the stimulator computer which was displayed on the left bottom corner of the screen. As soon as the feedback was re-ceived, stimulator computer highlighted the next symbol and the subject had to shift the gaze in 1 second after which the stimula-tion sequence for the second letter started. Note that during the processing stage, the responses from last 103 bits corresponding to c-VEP data were discarded for all the letters. . . 23
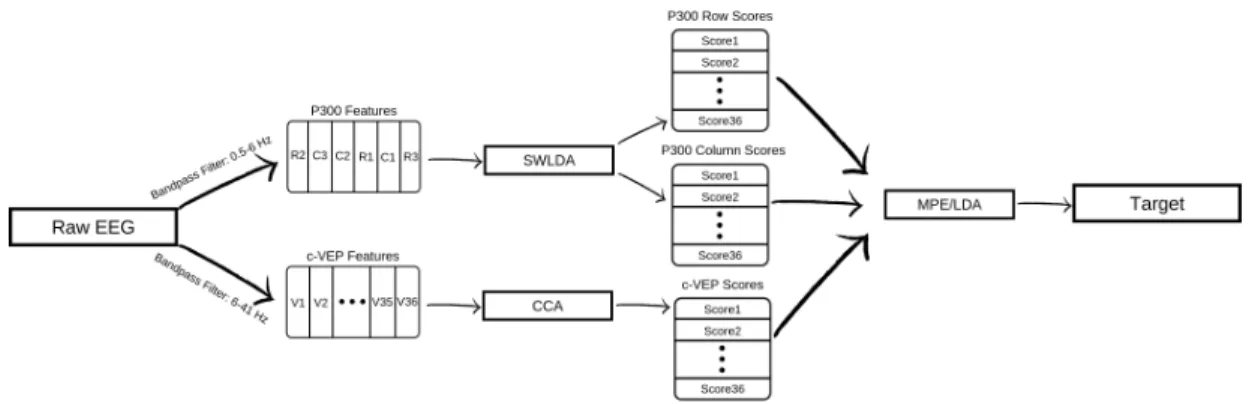
2.6 Schematic of the Hybrid Speller BCI incorporating P300 and c-VEP 24
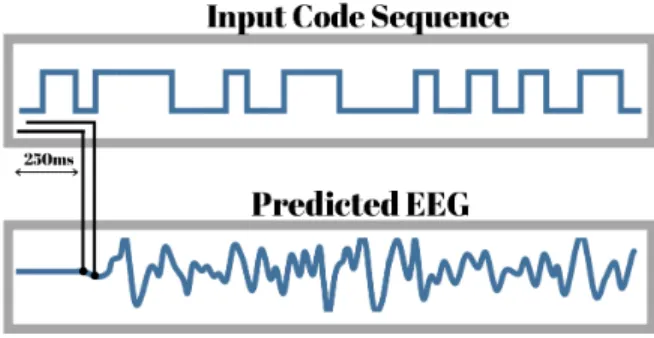
2.7 Model predicts the EEG using previous 250ms input code sequence. Note that this model does not predict the first 250ms of EEG and all the correlations and target identification is done without the first 250ms of EEG. . . 33
LIST OF FIGURES xiv
3.1 Photo-diode response for the screen flickering between black and white background at 60Hz, 120Hz, 240Hz. (a) This is response for 60Hz refresh rate where high corresponds to the white frame and low corresponds to the black frame. Cursors on screen show the period of one cycle of flicker where the frequency is measured as 29.94Hz. Note that one cycle of flicker has two frames (black and white) so the refresh rate of monitor is 2 × 29.94. (b) This is the response for 120 Hz. The frequency of one cycle of flicker is measured as 59.98 and refresh rate becomes 119.96Hz. (c) This is response for 240Hz. The frequency of one cycle of flicker is measured as 119.90Hz and refresh rate becomes 239.8Hz. . . 36
3.2 Plots of the monitor response and the corresponding marker pulses. For the testing purpose we send the marker puslse after every frame to test the synchronicity of our system. We can see the pulse at every rising and falling edge of the monitor response. . . 37
3.3 The non-target signal (orange) and target signal (blue) of S1 ob-tained from channels: O1, Oz, O2, P3, Pz, P4, CP1, CP2, Cz, and Fz respectively. Y-axis shows the voltage level in microvolts and x-axis shows the time in seconds. The graphs for P300 show the response for a single epoch length which is taken as 0.8s. . . 38
3.4 The non-target signal (orange) and target signal (blue) of S2 ob-tained from channels: O1, Oz, O2, P3, Pz, P4, CP1, CP2, Cz, and Fz respectively. Y-axis shows the voltage level in microvolts and x-axis shows the time in seconds. The graphs for P300 show the response for a single epoch length which is taken as 0.8s. . . 39
3.5 The non-target signal (orange) and target signal (blue) of S2 ob-tained from channels: O1, Oz, O2, P3, Pz, P4, CP1, CP2, Cz, and Fz respectively. Y-axis shows the voltage level in microvolts and x-axis shows the time in seconds. These are the target and non-target responses for a single trial. . . 40
LIST OF FIGURES xv
3.6 The non-target signal (orange) and target signal (blue) of S5 ob-tained from channels: O1, Oz, O2, P3, Pz, P4, CP1, CP2, Cz, and Fz respectively. Y-axis shows the voltage level in microvolts and x-axis shows the time in seconds. The selected features are marked in the plots with a red star. . . 43
3.7 Reference template (blue) and m-sequence for letter ‘A’. Y-axis shows the voltage level in microvolts and x-axis shows the time in seconds. . . 44
3.8 Responses with and without spatial filtering. (a) averaged EEG and single trial response is plotted from channel O1. (b) reference template and single trial projected response. . . 45
3.9 Correlation of a single trial projected response and all the reference templates. Y-axis shows the correlation coefficient and x-axis cor-responds to the reference template of the symbols in alphanumeric order. . . 45
3.10 Measured response (blue) and modeled response (orange) of S4 for 60Hz experiments. Y-axis shows the voltage levels and x-axis shows time in seconds. The plot shows the data from the first trial of the training where the correlation coefficient is 0.447. . . 49
3.11 Measured response (blue) and modeled response (orange) of S4 for 120Hz experiments. Y-axis shows the voltage levels and x-axis shows time in seconds. The plot shows the data from the first trial of the training where the correlation coefficient is 0.574. . . 50
B.1 GUI running on recording computer . . . 67
List of Tables
3.1 Statistically significant features obtained after performing SWLDA. Rows correspond to different channels and columns correspond to different time instants. Note that ‘0’ in the table refers to non-significant features. . . 42
3.2 Wx coefficients obtained during training session for each subject. . 46
3.3 ITR and accuracy table for c-VEP and hybrid (MPE). . . 47
3.4 ITR and accuracy table for hybrid (LDA). Accuracy and ITRs are the average of 5 experiments for each subject. Alongside the accuracy values, the standard deviations are also written. . . 48
3.5 Correlation between measured response and modeled response for 60Hz and 120Hz monitor refresh rate. . . 49
3.6 Accuracy and ITR values obtained using the linear ridge regression model as a classifier. . . 51
Chapter 1
Introduction
1.1
Background
1.1.1
Brain-Computer Interfaces (BCIs)
BCI technology is a powerful communication tool between users and systems. It uses the brain signals, generated as a result of a certain stimulus, to estimate the user’s intent to communicate with his surroundings [1], [2]. BCI systems have numerous applications and they are commonly used in controlling a computer cursor; operating real-time drowsiness detection system for drivers; recognizing users’ mental states and measuring attention levels based on the electrophysio-logical signals [3], [4], [5]. EEG-based BCIs, due to their non-invasive, portable and temporal resolution properties, are widely used in the field of neural engi-neering. The main users of this BCI system are the people with motor disabilites or peripheral nerve damage as it enables people to interact with their surround-ings involving minimal muscle movement [1], [6]. Different types of EEG control signals are used for different BCI designs and among them the most popular are: visually evoked potentials (VEP) and event-related potentials (ERP) [1], [6], [7]. These control signals (VEP and ERP) are higly researched approaches due to
less training time [6], [7], [8].
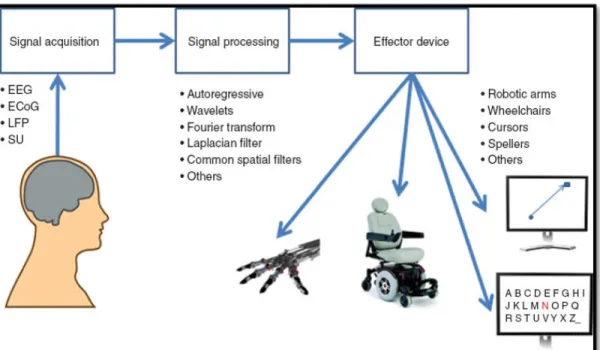
BCI system consists of five stages: signal acquisition, preprocessing, feature extraction, classification, and control interface [9]. Figure 1.1 shows the general design for BCI systems. In the signal acquisition stage, the input from the brain can be either electrophysiological activity or hemodynamic activity. The infor-mation relayed from one neuron to another by the electro-chemical transmitters is known as the electrophysiological activity [6]. On the other hand, the hemody-namic activity exploits the property where glucose is delivered to active neurons at higher rate than the glucose delivered to inactive neurons, and as a result, the oxyhaemoglobin ratio in both areas of the neurons is easily distinguished [10]. In our study, the focus is on EEG-based BCIs where the signal is acquired from the scalp and neuronal activity from different brain areas is recorded using the electrodes placed on the distinct scalp sites.
In the preprocessing stage, the recorded signals are filtered and structured in a specific form which can be used in the next stage. During the feature extraction stage, the distinguishing information is identified from raw EEG. This stage is the most challenging one as the acquired EEG contains considerable distortion due to the noise from electromyography (EMG) and electrooculography (EOG) [1]. In the classification stage, the recorded signal is classified based on the feature space which has been specified in the feature extraction stage. Finally, in the control interface stage, the command, based on the classified response, is generated to interact with the surroundings such as in controlling computer cursor, commanding a wheel chair or spelling out a word [1], [6], [11].
Figure 1.1: Simple flow diagram of any BCI design
1.1.2
Electroencephalography (EEG)
EEG is an electrophysiological monitoring method which is used for recording electrical brain activity caused by the currents (impulses) flowing through the synaptic connections between neurons. EEG signal is a widely used neuroimaging modality because it is non-invasive, portable, low-cost, with a high temporal resolution. EEG can easily be recorded by placing the electrodes on the scalp which can be either active or passive, and dry or wet. Its recording system comprises amplifiers, A/D converter, and a recording device (PC). After the electrodes sense the signal from the scalp, the amplifiers increase the EEG signals’ amplitude in order for the A/D converter to digitize them with higher accuracy. The recording device then stores and displays the acquired data.
The EEG recording setup includes three electrodes: active, reference, and ground. Where the recorded EEG is the potential difference between active and
reference electrodes, the ground electrode is used to measure the differential volt-ages and to reduce the noise of the other two electrodes. Moreover, the electrodes used in this setup are usually manufactured using small tip-like pins of silver chlo-ride (AgCl) [12]. The EEG signal amplitude is in the order of microvolts so a high gain, typically x100000, is required to achieve a good digitized output. As the EEG signal experiences background noise from different muscle activities, the contact impedance between the scalp and electrode should be kept below 10KΩ [13] in order to obtain a high quality EEG signal. For a good connectivity be-tween the electrode and the scalp, conductive gel is used as a bridge, making this type of setup a wet electrode setup. Although this setup requires a continuous maintenance compared to a dry electrode setup (in which no conductive gel is used), the quality of EEG signal obtained is better with minimal background noise. Dry electrodes can also be used to record the EEG signal but a completely dry system might be subject to several challenges involving not just a very high impedance between electrode and skin, but amplification circuit with high input impedance as well [14]. Regardless of the electrodes used during the whole pro-cess, the user should stay stationary and certain precautions must be taken to minimize the electronic noise generated by both external sources (such as power-lines) and internal sources (such as thermal, shot, flicker, and burst noises) [15]. The EEG signal can be recorded using unipolar or bipolar measurements. In unipolar setup, the potential difference between active electrode and a fixed ref-erence electrode is measured whereas in the bipolar setup the potential diffref-erence between two electrode sites is measured.
Furthermore, EEG signals are categorized in five sub-classes based on the frequency range of the signal: delta (δ), theta (θ), alpha (α), beta (β) and gamma (γ). These different frequency bands of EEG signals correspond to different activities or states of mind. The delta band consists of signals lying in the range of 0-4 Hz. Delta rythm is observed in adults only in the deep sleep state and it is not easy to monitor it because the low frequency muscle movements of neck or jaw can easily distort the EEG [16]. The theta band consists of signals lying in the range of 4-7 Hz. Theta rythm corresponds to concentration and cognitive activities such as mental calculations [17]. Alpha waves (8-12 Hz), on the other
hand, are observed in the occipital area of the brain, indicating visual processing, and their amplitude reduces with increasing mental effort [18]. The alpha rhythm is strongly observed in relaxing and eyes-closed state. Beta rhythms (12-20 Hz) are detected in the frontal and central lobe and are linked to motor activities; they are suppressed when motor action is performed [19]. Finally, the gamma rhythms (30-100 Hz) are associated with specific motor functions and perceptions [20].
In our experimental setup, electrode sensors are used to record EEG from scalp and the placement of electrodes is based on the International 10-20 system [21]. The system uses two reference points from the head to define the relative positions of electrodes. One of the reference point is nasion which is located in the middle of the forehead on top of the nose, and the other reference point is inion which is located under the bump on the back of the skull. The electrode locations are marked at intervals of 10% and 20% at the transverse and median planes [21] as shown in Figure 1.2. The letters in each location correspond to specific brain regions in such a way that A represents the ear lobe, C-the central region, Pg-the nasopharyngeal, P-the parietal, F-the frontal, Fp-the frontal polar, and O-the occipital area.
1.1.3
Visual Evoked Potential (VEP)
VEP is the electrophysiological signal recorded from the position on the scalp corresponding to visual cortex [22]. VEP response is elicited in primary visual cortex when the visual field is stimulated, and the signal can be observed after averaging the recorded EEG. Evoked potentials are classified as transient evoked potentials (TVEPs) and steady-state visually evoked potentials (SSVEPs). If the visual stimulus is periodic with frequency higher than 6 Hz, the resulting VEP is called SSVEP which is typically analyzed in the frequency domain. On the contrary, TVEP response occurs when the visual stimulus frequency is less than 6 Hz [6]. Different visual stimulus patterns generate distinct VEP responses. Moreover, the input visual patterns are designed with the aim of achieving or-thogonal VEP responses for different stimulus patterns in order to get reliable identification of the targets. A variety of light sources can be used as visual sim-ulators and their flash pattern determines the type of VEP response generated. SSVEP BCIs are categorized in three groups: time-modulated VEPs (t-VEPs), frequency-modulated-VEPs (f-VEPs), and code-modulated VEPs (c-VEPs). The t-VEPs are the responses evoked in visual cortex when the input visual stimulus pattern for the targets are orthogonal in time [6]. On the other hand, the f-VEPs are the periodic responses generated when the input visual stimulus is a single frequency flash and the fundamental frequency of the response corresponds to the flash frequency [6], [8]. Finally, the c-VEPs are the evoked responses when the visual stimulus varies depending on the binary pseudorandom sequence, where bit ‘0’ means OFF and bit ‘1’ means ON.
1.1.4
Code-Modulated Visual Evoked Potential (c-VEP)
In recent years, the c-VEP paradigm has gained immense popularity among the BCI community due to its potential to achieve high information transfer rate (ITR) [8], [23], [24]. ITR is a standard performance metric used by BCI com-munity to quantify the overall speed of the BCI system. In c-VEP paradigm, a pseudorandom binary coding sequence and its time-lagged version are assigned
to targets which flicker according to their own sequence. The c-VEP is observed in the EEG recorded from the occipital lobe, depending on the target that the subject fixates his gaze on [8], [23], [24]. This pseudorandom binary sequence comprises combinations of zeros and ones which correspond to the visual inten-sity of the stimulus. Typically, m-sequence is used as a pseudorandom binary sequence. It is nearly orthogonal to its time-lagged version and the autocorrela-tion funcautocorrela-tion of the m-sequence is similar to the unit impulse funcautocorrela-tion, making it more suitable for distinguishing between different targets in BCI application [25]. Variable (m) in the m-sequence defines the size of the linear-feedback shift regis-ters required to generate the sequence, and that sequence’s length is determined by the formula 2m− 1 [25].
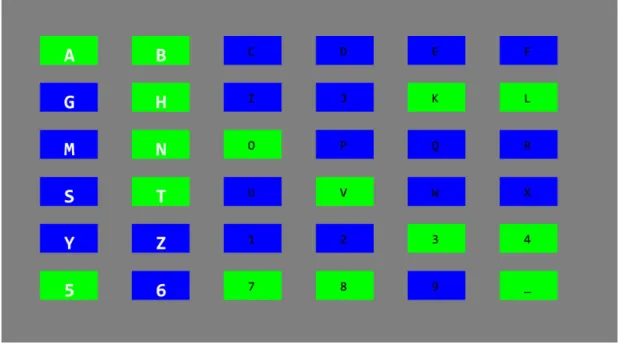
For c-VEP BCI application, mostly monitor screens are used as a visual stimu-lus source with different targets (letters/numbers) presented as matrix on screen. Figure 1.3 shows the arrangement of symbols on screen. Each target on the screen modulates with the assigned pseudorandom binary sequence. The first target (A) modulates with the original m-sequence while the rest of the targets modulate with the time-lagged version of the original m-sequence [8], [23], [24]. C-VEP sequence is limited by the refresh rate of the monitor where each bit is displayed for the duration of one frame. In our project, we have used 127-bit length of m-sequence to modulate the visual stimuli. The background of the letters, presented on the screen, change the color according to their pseudorandom binary sequence. In our study, the background color flickers between green if the bit is ‘1’, and blue if the bit is ‘0’. Letter A flickers with the original m-sequence; letter B flickers with 3-bit shift of original sequence; letter C flickers with 6-bit circular-shift of original sequence and so on. The design in use can be seen from Figure 1.3, where all the letters’ background have colors according to their pseudorandom binary sequence. For processing the c-VEP responses, the synchronizing trigger channel is required to mark the starting of the stimulation cycle [8]. Moreover, all the targets flicker with orthogonal pseudorandom binary sequence in time domain and the evoked responses are assumed to be near-orthogonal and distinguishable.
Figure 1.3: The figure shows one of the frames of our hybrid BCI speller design where 36 targets (letters/numbers) are presented as 6x6 matrix on screen with each target flickering with its different pseudorandom binary sequence. The first two columns are flashed simultaneously. If the subject performs a mental task at the onset of the flash, it generates the P300-evoked potential.
Unlike f-VEP, c-VEP requires a training stage where the user is instructed to fixate his gaze onto the reference letter (A) and EEG is recorded for the N number of repetitions of 127-bit code sequence. The reference template for the letter A is then obtained by averaging the EEG over N trials. Another benefit of c-VEP includes less training time because the templates for the rest of the targets can be obtained by circularly shifting the template of reference letter by the corresponding circular-shift introduced in the original m-sequence for each target [8], [24], [23]. During the test stage, code sequence for each symbol is repeated only once and the response is correlated with the templates obtained for each symbol. The symbol with the maximum correlation is selected as the target subject looked at.
1.1.5
P300 Evoked Potential
The P300 is a large positive signal generated in the parietal and central lobe areas of the brain. It peaks at about 300 ms in response to a mental task carried out when an infrequent stimulus occurs in an ‘oddball’ paradigm [11], [26], [27], [28], [29]. A typical P300 response has four peaks: N100, P200, N300, P300. The first letter of the peaks represents the positive or negative and the following number is the average latency of the peaks in millisecond [30]. In P300-based BCIs, the visual stimuli are presented as letters or symbol commands on the screen and all the rows and columns are flashed randomly while EEG is monitored [11], [26], [28], [29]. The subject fixates his gaze onto the target and depending on the flash of the target, the subject is instructed to keep the flash count in memory. As a result of this cognitive processing, occurring only at the instants when the target is flashed, P300 response is generated in the brain for the corresponding target [1], [28]. Figure 1.3 shows the first two columns flashed randomly and if the subject performs the mental task in response to the visual stimulus, it generates the P300 response.
The P300 potentials can be recorded without any training but the variations reported from one subject to another can not generalize the system for all the users [28]. Hence, training is performed on every subject to calibrate the spatiotemporal filters which helps the system adapt to the subject-specific P300 brain responses [28]. In a 36 letter/number matrix on screen, there are 6 rows and 6 columns, denoting that one single trial consists of 12 flashes of row/column. In the test stage, a single trial of stimulus is not sufficient to provide a reliable detection of the target. Although, large number of trials during the test increase the accuracy of the system, they cause the ITR to decrease significantly [6]. The advantage of P300 BCI is that it depends on the cognitive processing unlike VEP responses which primarily depend on the subject’s gaze and vision [6].
1.1.6
Previous Hybrid BCIs
Recently in BCI community, researchers have focused on hybrid BCIs which com-bine two paradigms, making the system more accurate, fast, and reliable in use [31], [32], [33], [34]. Different physiological signals can be used to develop a hybrid BCI such as EEG, electrocardiogram (ECG), electrooculogram (EOG) or any other hemodynamic signal. Moreover, in the initial stages of the development of hybrid BCIs, researchers have put more focus on P300, SSVEP, event-related synchronization (ERS), event-related desynchronization (ERD) and sensory mo-tor rhythms. The decision-making process involves the combination of two or more physiological measures mentioned above so that the patient’s intent could be communicated in a more accurate manner. Moreover, if the patient responds adequately to both the combinations of these physiological measures, the infor-mation throughout will be improved [32].
A large number of studies have been carried out concerning hybrid BCIs, in-cluding the one by Luth et al. [35] which proposes a hybrid system incorporating P300 and SSVEP for a rehabilitation robotic system control. Moreover, in 2010, Pfurtscheller et al. [36] investigated the performance and feasibility of the hybrid BCI based on ERS and SSVEP. It was aimed at creating an efficient brain-switch (detection of a single brain pattern) with minimal or zero false activation rate [36]. Allison et al. [37] introduced a hybrid BCI based on ERD and SSVEP for a 2-D cursor control. Furthermore, the same application of 2-D cursor con-trol based on motor imagery and P300 was introduced by Long et al. [34]. In addition to all these important developments in the study of hybrid BCIs, in 2013, Yin et al. [38] proposed a hybrid BCI speller combining P300 and SSVEP paradigms which involved the letter/symbol matrix. Significant improvement in accuracy was observed with this combination as online classification accuracy of P300 was measured as 68.65%; the hybrid’s was 93.85%. The ITR of the P300 was measured as 33.8 bits/min and of the hybrid was 56.44 bits/min [38]. Yin et al. [39] also researched on different designs of hybrid BCI speller and reported the maximum average accuracy of ITR being 95.18% and 50.41 bits/min.
1.1.7
Model Based Paradigms for BCI Design
Researchers have also focused on modeling the brain responses which will allow us to study the transient and steady-state responses of the brain for a different visual stimuli [40], [41], [42], [43]. Robinson et al. [40] proposed a physiologi-cal based corticothalamic model aimed at reproducing different features of EEG which includes ERPs and discrete spectral peaks in all the frequency bands of EEG. Roberts et al. [41] uses Robinson’s model to explain the non-linear behav-ior of cortical activity when periodic visual stimulus is presented to a subject. Robinson’s model consists of large number of second order filters and non-linear sigmoidal blocks. High non-linearity due to feedback loops and second order fil-ters make it difficult to optimize the paramefil-ters in such neural models, therefore, linear models are proposed. Zhang et al. [42] proposed second order linear system to model the transient response of SSVEP. Nagel et al. [44] proposed a moving average model which predicts the brain responses to arbitrary visual stimulus patterns. In the same year (2018), Safi et al. [43] proposed a Box-Jenkins model for the SSVEP recognition.
In online BCI applications, target classification is performed during test stage. Nagel and Safi have used model based approach for classification of targets and re-ported improvements in accuracy of BCI systems [44], [43]. Model parameters are optimized during the training stage and responses for all the targets are simulated using the model. In test stage, the response for a specific target is correlated with all the simulated responses and by looking at the maximum correlation, target letter/symbol is chosen. This model based approach for classification of targets has an advantage of reduced training time and increased number of targets. In c-VEP BCI explained before we mentioned the use of m-sequence and the reference templates are obtained by circularly shifting the template of letter ‘A’ which re-duces the training time. However, if we use arbitrary binary sequences for all the letter/numbers we would need to perform training for all the symbols separately. In that case, following the model based approach which optimizes a model on ar-bitrary visual input sequences, we can reduce the training to only one letter. As a result, we can also increase the number of targets because no additional training
would be required. Furthermore, these models can be used to study different variations of visual stimuli and identify the optimal input sequences that brain responds to significantly. Although, there has not been much study on the mod-eled responses of c-VEP, we can use the linear and non-linear models proposed for SSVEP to explain the c-VEP responses observed in our experiments.
1.2
Objective and Scope
Inspired from studies detailed in the previous section, we propose a novel hybrid BCI speller with 36 targets (letters/numbers) presented as a 6x6 matrix on screen. The proposed hybrid BCI speller uses P300 and c-VEP paradigms, and this thesis investigates its feasibility and performance. Predominantly, c-VEP paradigm is considered as the most efficient BCI paradigm since it requires less training, provides high ITR, and allows for application with a large number of targets [8], [23], [24]. It is already evident from previous studies that the ITR of the system increases at higher stimulus presentation rates such as 120 Hz and 240 Hz. Although the ITR increases, high accuracy might not be achieved with a single trial. Thus, for high accuracy the number of trials need to be increased which in turn reduces the ITR significantly. Therefore, the goal of this study is primarily to improve the accuracy of the BCI speller while maintaining a high ITR.
For this purpose, experiments have been carried out in order to test the feasi-bility of the P300 and c-VEP hybrid system. Refresh rate of the monitor is set to 120 Hz which allows us to achieve high ITR and improved accuracy [24]. During the whole procedure, accuracy of the BCI systems and the ITR is used as the main performance metric. The experimental data is acquired using the hybrid paradigm after which observations are made in order to identify the behaviours of P300 signal and c-VEP. Moreover, accuracy and ITR of both c-VEP and hybrid design are compared during the offline analysis. In our study, different fusion techniques used for combining the P300 and c-VEP features, are also compared.
In the second part of this thesis, we have implemented a moving average model to simulate the c-VEP response which are further used in the online experiments for classification of targets. Forward model (input code sequence is used to predict EEG) for 60Hz and 120Hz monitor refresh rates are implemented and compared. Our goal is to fit a linear model which can improve the training time compared to the case where training is required for all the symbols.
1.3
Organization of Thesis
This thesis has three chapters: materials and methods, results, and discus-sion/conclusion.
In chapter 2, (Materials and Methods) the experimental setup, procedure, and design is discussed in detail. It discusses the methods used for the preparation of subjects and the data acquisition. Furthermore, the processing of data: pre-processing, P300 data pre-processing, c-VEP data pre-processing, and different fusion techniques are explained in this section. Next, we explain the implementation of the forward and backward models.
In chapter 3, (Results ) the results obtained from the experiments are ana-lyzed and compared with the results of different c-VEP and hybrid paradigms. The quality, pattern of the signals and the results obtained using different fu-sion techniques are discussed in this section. Furthermore, comparison is drawn between classification results of linear models and classification results of online experiments.
In chapter 4, (Discussion and Conclusion) the general discussion is given and results are summarized.
Chapter 2
Materials and Methods
2.1
Hybrid Stimulus Design
The hybrid speller consisted of 36 targets (letter/numbers) presented as a 6x6 matrix on screen. Random flashes of row and column, as well as flickering of the background of each target according to its pseudorandom binary sequence, elicit the P300 and c-VEP responses in specific areas of brain respectively. The default background screen of the speller was gray and each target was assigned a rectangular cell of 90 x 180 pixels.
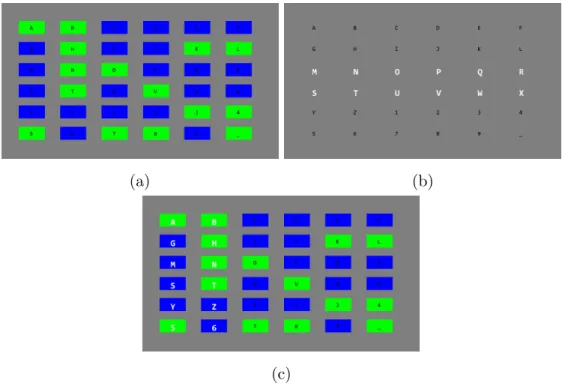
Figure 2.1a shows the c-VEP stimulus design where each target is displayed on a green or blue background. The backgrounds of targets were arranged according to the corresponding bit of each target’s binary sequence, where bit value ‘1’ corre-sponds to green background and bit value ‘0’ to blue background. In c-VEP stud-ies, usually the code length of 63-bit is used, allowing the stimulation of maximum 32 targets with a 2-bit lag. In order to stimulate 36 targets on screen, a 127-bit long m-sequence is required. The m-sequence assigned to reference letter (A) is as follows: 10100011110010001011001110101001111101000011100010010011011010 11011110110001101001011101110011001010101111111000000100000110000. The original m-sequence was shifted circularly, one after another, by 3-bits and the
resulting 36 orthogonal sequences were assigned to the letters/numbers in al-phanumeric order. Since there has not been enough research performed on the optimum time lag of the pseudorandom sequence, arbitrarily 3-bit lagged versions were chosen. Refresh rate of the monitor, in our experiments, was set to 120Hz so a single trial of c-VEP took 127120 = 1.0583s.
In P300-based speller BCIs, each of the 6 rows and 6 columns of the stimulus were randomly flashed once during a single trial, with the total number of flashes being 12 in one trial. Figure 2.1b shows the P300 stimulus design where 2 rows were flashed simultaneously. For a single row/column flash, we had active and passive duration of a flash. Single flash had the active time where font color became white and the passive time was where the font color returned to default black. P300 flash time was mostly chosen between 120ms-150ms for active and passive times which made the single flash time of 240ms-300ms. In our experi-ments, we set the active time to 100ms and the passive time to 150ms. For 12 row and column flashes, the run time for a single trial of P300 became 0.25 ∗ 12 = 3s.
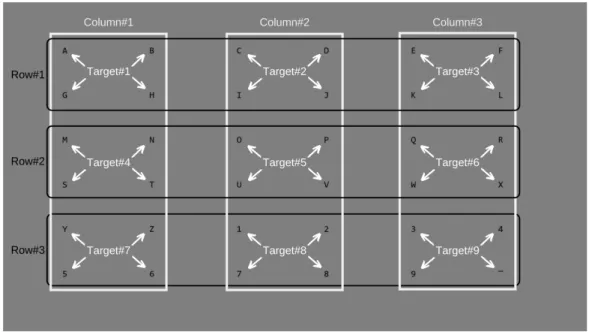
Since P300 would dominate the timing of the hybrid design, the P300 design was modified to reduce the single trial time by half. By grouping each row/column with the following row/column (i.e. first and second row, third and fourth row, fifth and sixth row), the total number of flashes became 6, consisting of 3 groups of rows and 3 groups of columns. For simplicity, we will refer to the groups of rows and columns as a single row and column. The run time for a single trial of P300 became 0.25 ∗ 6 = 1.5s. Although we can reduce the timing further by limiting the active and passive times, the user in that case would not be able respond to the stimulus correctly. If only P300 paradigm is considered, we had only 9 targets which are groups of symbols with each group containing 4 symbols. Figure 2.2 shows the grouping of rows, columns, and targets. P300 and c-VEP stimulus designs were superimposed to make a hybrid speller as shown in Figure 2.1c.
(a) (b)
(c)
Figure 2.1: The figure explains the design and the superimposed hybrid frame. Note that all these frames were captured at different time instants during a test session just to give an idea about the design. The monitor refresh rate was set to 120 Hz and each frame was displayed on the screen after 1201 = 8.3ms. (a) We turned off the P300 flashes and only the c-VEP stimulus was shown. Here the cell background of each target is green or blue depending on the corresponding bit sequence of each letter/symbol, green if the bit value is ‘1’ and blue if the bit value is ‘0’. (b) This frame shows only the P300 stimulus and at that instance only, second and third rows were flashed. Single flash had the active time (font color becomes white) of 100 ms and the passive time (font color returns to default black) of 150 ms. (c) This frame shows the superimposed hybrid stimulus frame. P300 set the timing of the hybrid stimulation sequence; in the training stage, the seqeunce was repeated for 50 P300 trials and in the test stage, only a single trial was performed.
Figure 2.2: Default frame of the hybrid speller design showing the grouped, rows, columns, and targets for P300 Paradigm.
MATLAB (The MathWorks, Inc., Natick, MA, USA) were used to design this BCI speller. Psychtoolbox-3 libraries were also used which provide the interface between computer hardware and MATLAB [45], [46], [47]. Moreover, the op-erating system Ubuntu 16.04 with a low-latency kernel was used allowing the psychtoolbox to reliably synchronize with the vertical screen retrace. Our setup consisted of two computers: stimulator station and recording station. All the code for the design mentioned above ran on the stimulator computer which, for synchronicity, also sent marker pulses simultaneously to the recording station.
2.2
Experimental Setup
2.2.1
Subjects
The experiments were performed on 7 healthy subjects (6 males, 1 female) with a mean age of 24.5 (range 19-26). All the participants had normal or corrected-to-normal vision. Three of the participants had previous experiences with the c-VEP based BCIs and the rest of them were novices. The study was authorized by the ethical committee of Bilkent University. Complete design of the BCI system and major details of the experiment were explained beforehand and the subjects were also asked to sign an informed consent form. In addition, subjects were asked to fill a questionnaire, which basically asked the users for any visual impairments, neurological diseases, epileptic history, or migraines.
2.2.2
Data Collection
For the EEG recording, actiCAP and V-Amp 16 channel EEG amplifier (2000 KHz sampling rate) by Brain Products (Brain Products, Gilching, Germany) were used. The actiCAP has 32 electrode sites and is designed according to the International 10-20 system. Moreover, 12 electrodes were applied in the experiment which spanned the occipital, parietal, central and frontal areas of the brain. EEG was recorded using the active wet electrodes from the electrode sites that corresponded to O1, Oz, O2, P3, Pz, P4, P7, P8, CP1, CP2, Cz, and Fz. All the signals were referenced to FCz electrode and the ground electrode was connected to the nasion on the forehead. Ten of the channels were used for P300 detection (O1, Oz, O2, P3, Pz, P4, CP1, CP2, Cz, and Fz) while for c-VEP detection, we used eight channels (O1, Oz, O2, P3, Pz, P4, P7, and P8). The ImpBox (Brain Products, Gilching, Germany) was used to monitor the electrode impedance which was kept below 20 kΩ for all the experiments. From the two computers used in our experiments, the recording computer used BCI2000 [48]
platform and FieldTrip buffer [49] to interface the stimulator computer and V-Amp.
2.2.3
Experimental Procedure
Since connectivity is crucial to the accurate recording of EEG signals, a small amount of conductive gel was applied onto the scalp before the electrodes were placed, in order to ensure better connectivity. For this experiment, EEG caps of different cuts and sizes could be used and in our lab, we worked with two different-sized caps: 56cm and 58cm. Each participant chose the EEG cap appropriate for their head size, which was then positioned carefully in a way that the O1, Oz, and O2 electrodes were placed exactly above the bony lump on the back of the head. The participant was seated approximately 80 cm away from a 25-inch LED monitor. In our experiment, Dell Alienware (AW2518HF) monitor was used which has a screen refresh rate of up to 240 Hz and a resolution of 1920 x 1080 pixels. While setting up the cap on subjects, we explained and displayed the stimulus design to familiarize them with the experiment.
Figure 2.3: This frame shows the cue presented to the subject so that he should shift gaze and focus on the pink highlighted symbol. In our experiments, only 1 second was given for gaze-shifting. This frame was captured during the test stage which also provided the feedback (decided target) from the recording computer on the bottom left corner. However, in the training stage no such feedback was provided; only the user was given the cue to focus his gaze and the sequence started in a standard manner.
Firstly, training was performed on the reference letter ‘A’. As soon as the experiment started, the subject focused his gaze on the cue presented on the screen as shown in Figure 2.3. After exactly one second, the visual stimulation sequence started, which is basically the flickering of the rectangular cells of each letter/number between green and blue color as can be seen in Figure 2.1c. In addition to the flickering, letters/numbers in each row and column were flashed 50 times as shown in Figure 2.1c. The subject was instructed to keep a mental count of random flashes of the focused letter which was flashed 100 times (e.g., one with each row flash and one with each column flash). Single trials of P300 and c-VEP took 1.5s and 1.06s respectively. In the training session, 50 P300 trials were performed which lasted for 1.5 ∗ 50 = 75s. Timing diagram in Figure 2.4 explains the stimulation sequence in more detail.
Figure 2.4: Single c-VEP code sequence took 1.06s and single P300 flashing sequence took 1.5s. In c-VEP, each bit was displayed for 8.3ms and single P300 flash was displayed for 250ms. In the duration of a single flash of P300, 2508.3 = 30 c-VEP bits were displayed. The training session lasted for 75s and during that time, 50 P300 trials and 70 trials of 127-bit length c-VEP stimulation code were repeated. In addition to the 70 trials of c-VEP, we displayed starting 103 bits of the stimulation code to complete the 75s of the training session. However, the c-VEP responses from the last 103 bits were discarded in the signal processing stage.
In the test stage, the subject was supposed to spell the 20-letter sequence “BILKENTBCIEXPERIMENT”. Each subject performed 5 test sessions with a break of 2 minutes after every session to avoid fatigue. The subject was instructed to follow the cue presented on the screen. After 1 second of the cue, the stimula-tion sequence started and the user focused on the target letter. In the test stage, only a single P300 trial was performed for each letter and this time, the subject kept a mental count of 2 for each letter. Timing diagram in Figure 2.5 explains the stimulation sequence for a single letter in more detail. The stimulus computer signalled the recording station as the stimulation for a single letter finished. All the signal processing was done on the recording computer and the response after classification was sent back to the stimulus computer as a feedback to the subject, which was printed on the left bottom corner of the screen as shown in Figure 2.3. As soon as the stimulator station received the feedback (decided target) from the recording computer, the next letter was highlighted and the subject had 1 second
to shift his/her gaze to the cued target. The stimulation, processing, classifica-tion, and feedback of a single letter lasted for 2.6 seconds and a single test session for 20 symbols took about 52 seconds.
Figure 2.5: This figure shows the timing diagram of the test session for 2 letters. After 1 second of the cue presented on the screen, the code sequence started and the stimulation sequence continued for 1.5s. Again, for each letter, we repeated the starting 103 bits of c-VEP code sequence to complete the 1.5s test sequence for single letter. After the completion of the sequence, the stimulator computer raisec the TCP flag to notify the recording station. The recording computer performed the processing and sent the classified target letter back to the stimulator computer which was displayed on the left bottom corner of the screen. As soon as the feedback was received, stimulator computer highlighted the next symbol and the subject had to shift the gaze in 1 second after which the stimulation sequence for the second letter started. Note that during the processing stage, the responses from last 103 bits corresponding to c-VEP data were discarded for all the letters.
2.3
Signal Processing
As shown in Figure 2.6, the recorded EEG was processed simultaneously for the extraction of P300 and c-VEP features. The V-Amp provided the built-in high pass filter with cut-off frequency of 0.1Hz which eliminated the dc offset and other low frequency variations caused by the body movement. Moreover, marker channel on the stimulator computer sent a pulse which became high at the onset of every P300 row or column flash, and remained high for the duration of the active time (100ms). Details of data processing are explained in the following
sections.
Figure 2.6: Schematic of the Hybrid Speller BCI incorporating P300 and c-VEP
2.3.1
P300 Detection
For P300 detection, signals from 10 electrode sites were considered: O1, Oz, O2, P3, Pz, P4, CP1, CP2, Cz, and Fz. P300 was a low frequency response so the recorded EEG was band-pass filtered with a cut-off frequency of 0.1Hz - 6Hz, thus eliminating the noise and other artifacts. As P300 had a maximum peak between 300ms and 500ms, 800ms-long epochs were taken for each row or column flash.
During the training, two P300 responses were elicited in the brain for a single trial. In this training stage, 50 P300 trials were performed which consisted of 50 ∗ 6 = 300 flashes. Among them, 100 were target responses (containing P300 signal) and 200 were non-target responses. Each epoch was taken to be 800ms long (1600 samples), starting from the onset of the corresponding marker of the flash. Two 3D arrays named targetDataset and nontargetDataset were formed and the sizes of the arrays were 100 x 1600 x 10 and 200 x 1600 x 10 respectively, where first dimension was the number of epochs, second dimension the epoch length, and third dimension the number of channels. EEG recordings were made at a sampling rate of 2KHz and to reduce the feature vector size, we down-sampled it to 20Hz by selecting every hundredth sample from the data. The feature vector was obtained by concatenating the data of all channels for each epoch. As a result, we obtained the new 2D arrays, trainDataT arget and trainDataN onT arget,
with their sizes becoming 100 x 160 and 200 x 160 respectively.
Identifying P300 is a classification problem where one class is a target (P300 response) and the other class is a non-target. Different methods are used for P300 classification including linear discriminant analysis (LDA), step-wise linear discriminant analysis (SWLDA), support vector machine (SVM), matched filter, and independent component analysis (ICA). LDA is a widely-used method in BCI community as it requires less computation and provides good accuracy [50], [51]. Using the training data, LDA defines a hyper-plane which distinguishes the targets and non-targets based on their 160 features. It projects all data onto the hyper-plane which maximizes the distance between the two means of the projections. If there are C number of classes, LDA projects the data onto the hyper-plane with C − 1 dimension. In our case there were two classes, target and non-target, and LDA projected the data in R160 space onto a line (C − 1 = 1,
where C = 2) defined by the following equation:
y(x) = wTx (2.1)
where, x is the feature vector of size 1 x 160, and w is the weight vector. Note that y in equation 2.1 is a scalar not a binary label. Once the data is projected, we can decide on the threshold which separates the two classes. However, the P300 response was elicited for only one row/column, and we could distinguish the target directly by looking at which row/column had the maximum projected value [51].
targetrow = arg max rows
[wTxrows+ w0] (2.2)
targetcolumn = arg max columns
[wTxcolumns+ w0] (2.3)
is defined by the following equation:
J (w) = | µ1− µ2 | σ2
1 + σ22
(2.4)
where, µ1, σ12, µ2, σ22 are means and variances of the projections (y) of the data
samples of two classes respectively. The solution for the weight vector, obtained by maximizing the objective function, is as follows:
ˆ
w = (Σ1+ Σ2)−1(µ1− µ2) (2.5)
where, Σ1, Σ2 are the covariance matrices of two classes.
SWLDA is an extended version of LDA. It performs the feature selection (elim-inates the less significant features) and achieves the best performance among all other techniques [53]. In this method, the features (predictors) were added one by one in the model and based on the p-values, the predictors were added or re-moved. Initially, SWLDA selected the most statistically significant feature with p < 0.1 and added it to the model. After that, new predictor was added and the p-value was computed again; if p < 0.1 for the new predictor, it was included in the model. Third step was to perform the backward step-wise analysis, which computed the p-value of each predictor by excluding only one predictor at a time and keeping the rest; the predictors with p > 0.15 were removed from the model. This iterative process was repeated until all the predictors satisfied the p-value criteria or the program completed the specified number of iterations [53].
In the test stage, a single trial P300 was performed for each symbol. Using the optimized weight vector obtained during the training session, the test data was projected onto a line. In MATLAB, for the 6 row/column flashes, we had the data arranged in a matrix called X with the size of 6 x 160. Equation 2.1 was used to project this test data and obtain 6 scalars. These 6 scalars were used as scores for the targets. We denoted these scalars as yz where z ∈ [1, 2, 3, 4, 5, 6].
For P300 detection, two type of scores were computed for each symbol: scorerow
i and scorecolumni where i ∈ [1, 2, ..., 36]. For scorerowi , all the symbols
belonging to row1, row2 and row3 were assigned y1, y2, and y3 respectively. On
the other hand, for scorecolumn
i , all the symbols belonging to column1, column2
and column3 were assigned y4, y5, and y6 respectively. Further processing of
these two types of scores is explained in section 2.3.3. Moreover, in MATLAB, ‘stepwisefit’ function was used to perform SWLDA.
2.3.2
c-VEP Detection
For c-VEP detection, signals from 8 electrode sites were considered: O1, Oz, O2, P3, Pz, P4, P7, and P8. The recorded EEG was band-pass filtered with a cut-off frequency of 6Hz - 41Hz, thus eliminating the noise and other artifacts. As discussed earlier in section 2.2.3, the single trial of c-VEP took 1.058s which cor-responded to 2117 samples at 2KHz sampling rate. The training was performed on letter ‘A’ and from Figure 2.4 it can be seen that there were 70 c-VEP re-sponses. Each epoch was taken to be 1.058s long (2117 samples). It was observed that SSVEP brain responses had a latency of 100 to 150ms [54]. Excluding the initial 150ms of response improved the accuracy of c-VEP BCI speller [24]. Note that we needed to include the additional 150ms of response, at the end, in order to complete the epoch. Epochs were taken 150ms after starting from the onset of the corresponding marker of the flash. One 3D array, labelled T , was formed and the size of the array was 8 x 70 x 2117, where first dimension was the number of channels, second dimension the number of epochs, and third dimension the length of epoch. Identification in c-VEP was done by the template matching method, where template was computed for each symbol during the training stage. In the test stage, correlation of the response with all the templates was computed and assigned as scores for all the symbols.
Canonical correlation analysis (CCA) was performed on the c-VEP data and for that purpose, the data was arranged in two 2D arrays labeled X and Y . Y was formed by averaging the data over the 70 trials of c-VEP and then column-wise,
replicating the data 70 times. The size of Y became 8 x 148190. On the other hand, X was formed by concatenating the data of each trial and its size became 8 x 148190. We performed CCA on the averaged data (Y) and non-averaged data (X). The purpose of CCA was to find the basis vector which maximizes the correlation between the two variables when projected onto their corresponding basis vectors. The maximizing function for CCA is defined as follows:
max Wx,Wy ρ(X, Y ) = E[W T x XYTWy] q E[WT xXXTWx]E[WyTY YTWy] (2.6)
where Wx is the resulting weight vector(8 x 1) for variable X, and Wy is
the weight vector (8 x 1) for variable Y . To summarize, the projected non-averaged (noisy) data WxTX was correlated with the projected averaged data WyTY . The next step was to calculate the reference templates for all the symbols. The reference template for letter A was obtained by projecting averaged EEG over 70 cycles onto the basis vector Wy, which had the size of 1 x 2117. For
the rest of the symbols, we obtained the templates by successively introducing the circular shift of bits in the reference template, obtained for ‘A’, where 3-bits corresponded to 50 samples. In MATLAB, we used ‘canoncorr’ function to perform CCA.
In the test stage, Wxcoefficients were used for the spatial filtering which meant
we projected the raw EEG data onto the basis vector Wx and then correlated it
with all the templates to obtain c-VEP scores for each symbol scorecV EPi where i ∈ [1, 2, ..., 36]. Further processing is explained in the next section.
2.3.3
Fusion of P300 and c-VEP Scores
We implemented two fusion techniques, LDA and maximum probability estima-tion (MPE). In this step, we combined the P300 and c-VEP scores for all the symbols and decided which target the subject looked at.
2.3.3.1 Linear Discriminant Anaylysis (LDA)
LDA is a linear way of combining features and as described in section 2.3.1, it finds the hyperplane which maximizes the distance between the means of the classes while minimizing the variance within the class. It is a widely used method for combining the data from different modalities because it provides good accuracy and the computational cost is low [50], [51], [55]. For each symbol, we have 3 types of scores: scorecolumni , scorerowi , and scorecV EPi . LDA reduces this 3-dimensional feature space to a one-dimensional feature space where the decision is based on the magnitude of the projection. The hybrid scores are computed as follows:
Scorehybridi = w1scorerowi + w2scorecolumni + w3scorecV EPi (2.7)
where [w1 w2 w3] are the weights, defining the hyper-plane. Projections are defined by the equation 2.1, where X is a feature matrix (contains all the three types of scores for each symbol) of size 3 x 36, w is a weight vector of size 3 x 1, and y is the resulting projection vector. After this fusion, target was decided as the symbol with a maximum magnitude of the projection which can be represented as follows:
T arget = arg max
i∈[1,2,...,36]
[Scorehybridi ] (2.8)
2.3.3.2 Maximum Probability Estimation (MPE)
MPE algorithm combined the individual scores of P300 and c-VEP based on the Gaussian distribution for each paradigm obtained during the training session. This approach was proposed by Yin et al. [39] in which all types of scores were transformed into probabilities and then the symbol with maximum probability was classified as target. We assumed all the scores were Gaussian distributed. Each score type had target and non-target Gaussian distribution which were
denoted by Td, Nd respectively, where d ∈ [1, 2, 3]. Note that d = 1 denotes the
row type, d = 2 denotes the column type, and d = 3 denotes the c-VEP type. The mean and standard deviation for these distributions were obtained during training stage. The data for each type of score is arranged in the matrix as shown below. scored
1,1 scored2,1 ... scoredi,1 ... scored36,1
scored
1,2 scored2,2 ... scoredi,2 ... scored36,2
..
. ... . .. ...
scored1,k scored2,k ... scoredi,k ... scored36,k
where, ith column shows the scores for ith symbol, kth row shows the scores for
kth trial. We know from the design of the BCI speller that first score belongs to letter ‘A’ which was target in our training session and the rest of the symbols were non-target. For the target distribution (Td) we computed the mean, µTd,
and standard deviation, σTd, of the first column. For the non-target distribution
(Nd) we computed the mean, µNd, and standard deviation, σNd, of the last 35
columns. The target distribution and non-target distributions were defined as Td∼ N (µTd, σTd) and Nd∼ N (µNd, σNd) respectively.
In the test stage, we obtained 36 scores of each type and using the distributions obtained previously, we computed the likelihood of each score as defined by the following equations: f (scoredi|Td) = 1 σTd √ 2πe −(1/2)((scored i−µTd)/σTd)2 (2.9) f (scoredi|Nd) = 1 σNd √ 2πe −(1/2)((scored i−µNd)/σNd)2 (2.10)
Next, we assumed that a symbol’s 3 types of scores are conditionally independent from each other and also independent from the scores of different symbols. After computing the likelihood, we computed the total probability of each symbol being a target and non-target using the following equations:
pi(Scorei|T1, T2, T3) = 3
Y
d=1
pi(Scorei|N1, N2, N3) = 3
Y
d=1
f (scoredi|Nd) (2.12)
where, Scorei is the set of scores from all types [score1i score2i score3i]. We know
that only one of the symbols is target and rest of them are non target so for each symbol we computed the likelihood of being a target given that all the other symbols were non-target. The equation below describes this step:
Pi(Scorei|T1, T2, T3, Score1...Score36) = p1(Score1|N1, N2, N3)×
p2(Score2|N1, N2, N3) × ... × pi(Scorei|T1, T2, T3)
× p36(Score36|N1, N2, N3) (2.13)
Computing probabilities using equation 2.13 gave us 36 probabilities for all the symbols and we chose the symbol with the maximum probability as the target symbol as described in the next equation:
T arget = arg max
i∈[1,2,...,36]