Highly directive radiation from sources embedded inside photonic crystals
Irfan Bulu, Humeyra Caglayan, and Ekmel Ozbay
Citation: Appl. Phys. Lett. 83, 3263 (2003); doi: 10.1063/1.1623010
View online: http://dx.doi.org/10.1063/1.1623010
View Table of Contents: http://apl.aip.org/resource/1/APPLAB/v83/i16
Published by the American Institute of Physics.
Additional information on Appl. Phys. Lett.
Journal Homepage: http://apl.aip.org/
Journal Information: http://apl.aip.org/about/about_the_journal
Top downloads: http://apl.aip.org/features/most_downloaded
Information for Authors: http://apl.aip.org/authors
Highly directive radiation from sources embedded inside photonic crystals
Irfan Bulu,a) Humeyra Caglayan, and Ekmel Ozbay
Department of Physics, Bilkent University, Bilkent, 06533 Ankara, Turkey
共Received 11 June 2003; accepted 3 September 2003兲
In this work, we have experimentally and theoretically studied the angular distribution of power emitted from a radiation source embedded inside a photonic crystal. Our results show that it is possible to obtain highly directive radiation sources operating at the band edge of the photonic crystal. Half power beam widths as small as 6° have been obtained. Our results also show that the angular distribution of power strongly depends on the frequency and on the size of the photonic crystal. © 2003 American Institute of Physics. 关DOI: 10.1063/1.1623010兴
Photonic crystals共PCs兲 are artificial periodic structures, which strongly modify the dispersion properties of electro-magnetic waves 共EM兲 waves. Since PCs may control the propagation of EM waves in certain directions, they have recently attracted much attention. Many interesting phenom-ena such as enhancement and suppression of spontaneous emission,1,2 propagation of photons via hopping over coupled defects,3,4 and localized donor and acceptor modes,5,6have been suggested and observed. One of the ma-jor reasons behind this interest on PCs is the possibility of the control of emission from radiation sources by using PCs. There are two main problems in the control of emission: enhancement or suppression of radiation and the confinement of the emitted power to a narrow angular region. The prob-lem of the enhancement or suppression have been investi-gated by several authors.1,7,8Moreover, PCs have been used, especially in the antenna community, to improve the angular confinement of power from radiation sources.9–14In most of these works the sources are not inside the PCs and PCs have been used either as a cover or a substrate.9–12 On the other hand, other researchers investigated radiation properties of sources inside PCs.13,14
In this work, we study the angular distribution of power from a radiation source embedded inside a PC. We show that it is possible to confine the emitted power to a very narrow angular region at certain frequencies. Moreover, we show that the size of the PC is a critical parameter. This letter will be organized as follows: we will first discuss the properties of PCs relevant to our study and then we will present our experimental and theoretical results.
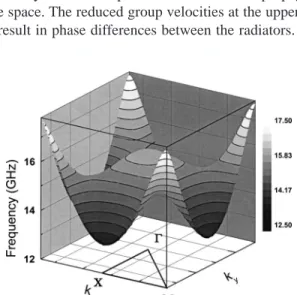
One of the points we will use in our discussion is the band structure of the PC used in our study. The PC that we used in our experiments and calculations is a two-dimensional 共2D兲 square array of cylindrical alumina rods. The alumina rods have a radius of 1.55 mm and a dielectric constant of 9.61. The separation between the center of the rods along the lattice vectors is 1.1 cm. Band structure of the corresponding infinite PC for TM-polarized EM waves is given in Fig. 1. Throughout the letter we consider only TM-polarized EM waves. From the band structure we observe that at the upper band edge 共the minimum of the second band兲 only the modes along ⌫ – X
⬘
, where X⬘
represents alldirections having the same symmetry properties of X point, are allowed to propagate inside the PC. For the modes near the upper band edge k储⫽kx⬇0. Apart from an additive
re-ciprocal lattice vector, k储 is conserved at the air-PC interface.15Hence, we conclude that for a source embedded inside the PC and operating at the upper band edge fre-quency, the emitted waves should be appreciably transmitted from the PC to air only along⌫ – X direction. In addition, the modes near the upper band edge are air modes, i.e., most of the energy of the EM waves are concentrated in the low dielectric material region as the waves propagate through the PC 关Fig. 2共a兲兴. Hence, when the waves near the upper band edge emerge from the surface of the PC, most of the power will flow through low dielectric material region of the PC 关Fig. 2共b兲兴. In conclusion, we can regard the exit points as radiation sources.
It is well-known that the group velocities for the modes near the band edges are fairly reduced compared to the group velocity of EM waves propagating in free space.16 Delay time measurements presented in Fig. 3 show that the group velocities for the modes near the upper band edge are re-duced up to 22 times in comparison to air. Delay time is defined as p⫽/.17Here,is the net phase difference between the phase of the EM wave propagating inside the photonic crystal and the phase of the EM wave propagating in free space. The reduced group velocities at the upper band edge result in phase differences between the radiators. Since
a兲Electronic mail: [email protected] FIG. 1. The second TM-polarized band is shown over the whole firstBrillouin zone.
APPLIED PHYSICS LETTERS VOLUME 83, NUMBER 16 20 OCTOBER 2003
3263
0003-6951/2003/83(16)/3263/3/$20.00 © 2003 American Institute of Physics Downloaded 08 May 2013 to 139.179.14.46. This article is copyrighted as indicated in the abstract. Reuse of AIP content is subject to the terms at: http://apl.aip.org/about/rights_and_permissions
at the upper band edge the modes are allowed to propagate only along ⌫ – X
⬘
, these radiation sources will have a uni-form distribution of phase differences.Combining the results of the discussions of the previous paragraphs, we conclude that the surface of the PC can be regarded as a system of radiation sources. All of these sources operate at the upper band edge frequency and have similar spatial and temporal distribution of power with a uni-form phase difference between the radiators. This system of radiators is similar to an antenna array. Since all the radiators of the system radiate in⌫ – X direction, we expect the emit-ted power from a source embedded inside the PC to be con-fined to a narrow angular region.
In our experiments and finite difference time domain cal-culations, we calculated and measured the angular distribu-tion of power emitted from a monopole source embedded inside a 2D square array of cylindrical alumina rods. The monopole source used in the experiments is obtained by re-moving 0.5 cm of the cladding from a coaxial cable and leaving the central conductor. An HP-8510C network ana-lyzer is used to excite the monopole source and to measure the power emitted from the monopole source. Figure 2
shows the details of experimental configuration.
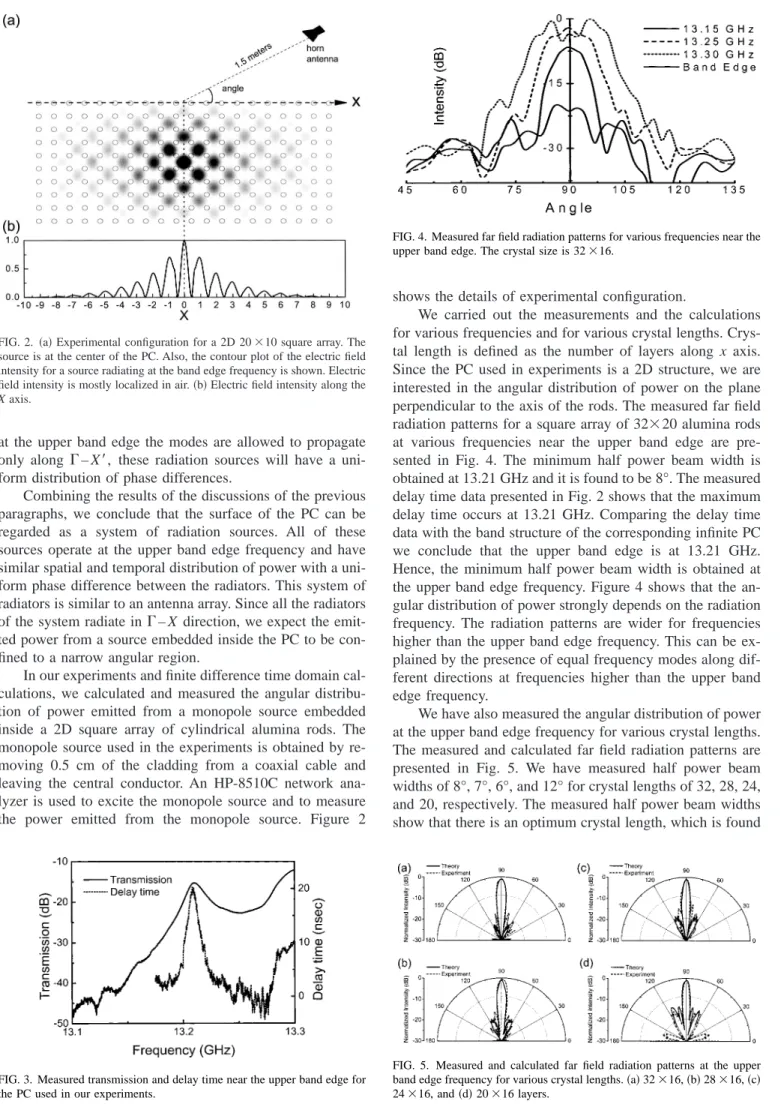
We carried out the measurements and the calculations for various frequencies and for various crystal lengths. Crys-tal length is defined as the number of layers along x axis. Since the PC used in experiments is a 2D structure, we are interested in the angular distribution of power on the plane perpendicular to the axis of the rods. The measured far field radiation patterns for a square array of 32⫻20 alumina rods at various frequencies near the upper band edge are pre-sented in Fig. 4. The minimum half power beam width is obtained at 13.21 GHz and it is found to be 8°. The measured delay time data presented in Fig. 2 shows that the maximum delay time occurs at 13.21 GHz. Comparing the delay time data with the band structure of the corresponding infinite PC we conclude that the upper band edge is at 13.21 GHz. Hence, the minimum half power beam width is obtained at the upper band edge frequency. Figure 4 shows that the an-gular distribution of power strongly depends on the radiation frequency. The radiation patterns are wider for frequencies higher than the upper band edge frequency. This can be ex-plained by the presence of equal frequency modes along dif-ferent directions at frequencies higher than the upper band edge frequency.
We have also measured the angular distribution of power at the upper band edge frequency for various crystal lengths. The measured and calculated far field radiation patterns are presented in Fig. 5. We have measured half power beam widths of 8°, 7°, 6°, and 12° for crystal lengths of 32, 28, 24, and 20, respectively. The measured half power beam widths show that there is an optimum crystal length, which is found
FIG. 2. 共a兲 Experimental configuration for a 2D 20 ⫻10 square array. The source is at the center of the PC. Also, the contour plot of the electric field intensity for a source radiating at the band edge frequency is shown. Electric field intensity is mostly localized in air.共b兲 Electric field intensity along the X axis.
FIG. 3. Measured transmission and delay time near the upper band edge for the PC used in our experiments.
FIG. 4. Measured far field radiation patterns for various frequencies near the
upper band edge. The crystal size is 32⫻16.
FIG. 5. Measured and calculated far field radiation patterns at the upper
band edge frequency for various crystal lengths.共a兲 32 ⫻16, 共b兲 28 ⫻16, 共c兲
24⫻16, and 共d兲 20 ⫻16 layers.
3264 Appl. Phys. Lett., Vol. 83, No. 16, 20 October 2003 Bulu, Caglayan, and Ozbay
to be 24 layers in our case. The minimum half power beam width is obtained for 24 layers and it is found to be 6°. From Fig. 5 and the measured half power beam widths we also observe that as the crystal length is changed from its opti-mum value, radiation patterns and half power beam widths also change. The change is more significant when the layer number is decreased from its optimum value. This can be explained by the fact that the strength of the radiators de-creases rapidly as we move away from the center of the PC 关Fig. 2共b兲兴. Hence, the effect of increasing the crystal length on the radiation patterns is less significant when compared to the effect of decreasing the crystal length.
In summary, we have demonstrated that by using PCs it is possible to confine the emitted power to a narrow angular region for a source embedded inside a PC and radiating at the band edge frequency. A minimum half power beam width of 6° have been obtained for a source operating at the upper band edge frequency of the PC. This is the minimum experi-mental value obtained from sources based on PCs. Our re-sults also show that the far field radiation pattern of an an-tenna embedded inside a PC strongly depends on the frequency and on the crystal size. The findings of our work can be used to improve the performance of certain devices such as antennas and light emitting diodes.
1E. Yablonovitch, Phys. Rev. Lett. 58, 2059共1987兲. 2
S. John and J. Wang, Phys. Rev. Lett. 64, 2418共1990兲. 3
M. Bayindir, E. Cubukcu, I. Bulu, and E. Ozbay, Phys. Rev. B 63, 161104
共2001兲.
4A. Yariv, Y. Xu, R. K. Lee, and A. Scherer, Opt. Lett. 24, 711共1999兲. 5
N. Stefanou and A. Modinos, Phys. Rev. B 57, 12127共1998兲. 6
M. M. Sigalas, K. M. Ho, R. Biswas, and C. M. Soukoulis, Phys. Rev. B
57, 3815共1998兲.
7A. G. Galstyan, M. E. Raikh, and Z. V. Vardeny, Phys. Rev. B 62, 1780
共2000兲.
8I. Bulu, H. Caglayan, and E. Ozbay, Phys. Rev. B 67, 205103共2003兲. 9M. Qiu and S. He, Microwave Opt. Technol. Lett. 30, 41共2001兲. 10
R. Gonzalo, P. de Maagt, and M. Sorolla, IEEE Trans. Microwave Theory Tech. 47, 2131共1999兲.
11E. R. Brown, C. D. Parker, and E. Yablonovitch, J. Opt. Soc. Am. B 10, 404共1993兲.
12M. P. Kesler, J. G. Maloney, B. L. Shirley, and G. S. Smith, Microwave Opt. Technol. Lett. 11, 169共1996兲.
13S. Enoch, B. Gralak, and G. Tayeb, Appl. Phys. Lett. 81, 1588共2002兲. 14
R. Biswas, E. Ozbay, B. Temelkuran, M. Bayindir, M. M. Sigalas, and K.-M. Ho, J. Opt. Soc. Am. B 18, 1684共2001兲.
15K. Sakoda, Optical Properties of Photonic Crystals共Springer, Germany, 2001兲.
16K. Inoue, N. Kawai, Y. Sugimoto, N. Carlsson, N. Ikeda, and K. Asakawa, Phys. Rev. B 65, 121308共2002兲.
17M. Mojahedi, E. Schamiloglu, F. Hegeler, and K. J. Malloy, Phys. Rev. E
62, 5758共2000兲.
3265 Appl. Phys. Lett., Vol. 83, No. 16, 20 October 2003 Bulu, Caglayan, and Ozbay