CONTRAST ENHANCEMENT USING PHASE TRANSITION INFORMATION
AND TOTAL VARIATION
Serdar Cakir, A.Enis Cetin
∗Department of Electrical and Electronics Engineering
Bilkent University, Ankara, 06800, TURKEY
E-mail:
{cakir,cetin}ee.bilkent.edu.tr
ABSTRACTContrast enhancement is an important preprocessing step for the analysis of images. The main aim of contrast enhance-ment techniques is to increase the visibility of the objects by modifying the spatial characteristics of the image. In this paper, phase transition based contrast enhancement frame-work is proposed to overcome the limitations of existing im-age enhancement techniques. The proposed imim-age enhance-ment framework transforms the changes in image phase into the variations of magnitude to enhance the structural details of the image and to improve visibility. In addition, the con-cept of Selective Variation (SV) technique is introduced and enhancement parameters are optimized using SV. The exper-imental studies that were carried out on TID2008 dataset, show that the proposed scheme obtains promising results on contrast enhancement.
Index Terms— Contrast Enhancement, Image Phase
In-formation, Fourier Transform.
1. INTRODUCTION
Contrast enhancement has been widely used in various im-age processing, and computer vision applications [1]. The main aim of this process is to increase the visibility of the objects in order to assist the manual or automated tasks in-cluding object analysis, detection, segmentation, and recog-nition. Image histogram based approaches have been widely utilized for contrast enhancement [1]. Early global Histogram Equalization (HE) techniques modify the histogram directly to perform contrast enhancement. However, global HE ap-proaches may introduce enhancement artifacts in the results while failing to enhance the local details. In order to elimi-nate the enhancement artifacts, the researchers have tried to modify the histogram in an adaptive manner [2, 3]. In the adaptive HE methods [3] the image is divided into sub-blocks and HE is carried out within these sub-blocks. The adaptive HE methods may result in a “checker-board” effect due to ∗A. Enis Cetin is on leave from Bilkent University. He is with the
De-partment of Electrical & Computer Engineering, University of Illinois at Chicago, Chicago, IL 60607, USA.
local contrast changes when combining the sub-blocks. The use of overlapping blocks may eliminate the grid-shaped ar-tifacts at the expense of increasing computational complexity and memory. Contrast limited adaptive HE (CLAHE) [2, 3] was proposed to overcome the limitations of HE approaches. The CLAHE method balances the contrast and eliminates ar-tifacts caused by inappropriate mapping of grayscale values. In general, the CLAHE method is preferred in offline appli-cations due to its computational load. Therefore, there have been several attempts which try to realize the algorithm effi-ciently for real-time applications [4, 5].
In this work, an image enhancement framework is posed to enhance the visual details in images. In the pro-posed image enhancement framework, the Discrete Fourier Transform (DFT) of the image is computed to determine the image phase information. Locations of high phase transitions are important for images [6]. Such frequency locations are extracted in DFT domain. To transform the phase differences into space domain amplitude variations, the frequency com-ponents where the phase transitions are significant are ampli-fied with large weights. After the calculation of the inverse DFT, the enhanced version of the image is obtained. The pa-rameters of the algorithm are determined by the Total Vari-ation (TV) [7] based approach. In this study, the concept of Selective Variation (SV) is introduced. The SV method min-imizes the variations in local regions of interest to achieve significant transitions around edges.
2. CONTRAST ENHANCEMENT BASED ON FOURIER PHASE TRANSITION INFORMATION In this study, a contrast enhancement technique which utilizes the image phase information is proposed. The method aims to increase the weight of the frequencies according to their phase transitions. Highly structured textures and sharp transitions in the image domain contribute to the high frequency compo-nents of an image. To emphasize high frequency compocompo-nents containing important hidden details, Fourier domain modi-fications can be carried out while preserving the conjugate-symmetric nature of the Fourier transform coefficients.
In the proposed algorithm, the high frequency compo-nents are emphasized by making use of the variations in im-age phase. Let x [m, n]∈ RM×Nbe the M× N dimensional image. The algorithm starts by calculating the two dimen-sional ˆM × ˆN -point Discrete Fourier Transform (2D-DFT) X[u, v] of the image x [m, n]. In order to take advantage of
the Fast Fourier Transform (FFT) algorithm, the DFT param-eters should be selected as ˆM = 2p > M, ˆN = 2q > N,
where p and q are positive integers. Let X[u, v] be:
X[u, v] =|X[u, v]| ejϕ[u,v]
u = 0, 1, . . . , ˆM− 1 & v = 0, 1, . . . , ˆN− 1
(1)
Note that, the 2D-DFT matrix is shifted to have the low frequency components at the center. Since low frequency components correspond to the smooth and constant regions of an image, manipulations on low frequency components may degrade the quality of the image by causing undesired arti-facts on smooth regions. Therefore, the weighting scheme only modifies the high frequency components. To determine the high frequency components to be amplified, a high-pass mask H[u, v] with cut-off frequency indices ucand vcis used:
H[u, v] = 0, ˆ M 2 − uc≤ u ≤ ˆ M 2 + uc ˆ N 2 − vc≤ v ≤ ˆ N 2 + vc 1, otherwise (2)
The high frequency components are emphasized by a weighting scheme which is obtained by calculating the tran-sitions of image phase information between neighboring frequency components. The phase transitions correspond to the phase gradient along both horizontal and vertical axes. The phase gradient ∂ϕ[u, v] is calculated as follows:
∂ϕ[u, v] =|ϕ[u, v] − ϕ[u − 1, v]|
+|ϕ[u, v] − ϕ[u, v − 1]| (3) After calculating the phase gradient, neighboring fre-quency components which provide significant phase transi-tions are determined. Let S be the set of spatial locatransi-tions in the frequency domain at which the corresponding phase transitions exceed the threshold τϕ:
S ={(u, v)|∂ϕ[u, v] > τϕ} (4)
By using the set S, the phase transition based weight ma-trix Wp(u, v) is determined as follows:
Wp[u, v] =
{
α∂ϕ[u, v], for (u, v)∈ S
1, otherwise (5)
where α is a scaling factor. Since direct thresholding is utilized in Equation 4, the weight matrix Wp[u, v] may
have sharp transitions which may cause undesired artifacts in
the reconstruction. In order to smooth the discontinuities in
Wp[u, v], a 2D-Gaussian function (g[u, v]) with parameters µ
and σ is utilized as follows:
Wf[u, v] = Wp[u, v]∗ g[u, v] (6)
where “∗” is the convolution operator. Afterwards, the final weight matrix W is selectively obtained by making use of
H[u, v] as follows: W [u, v] =
{
Wf[u, v], if H[u, v] = 1
1, otherwise (7)
Then, the weight matrix W [u, v] is applied to the spec-trum matrix X[u, v] to obtain XC[u, v] = W [u, v]X[u, v]. In
this manner, the image spectrum is modified in terms of mag-nitude by using the phase transitions in neighboring frequency components. The inverse DFT (IDFT) of XC[u, v] is
calcu-lated to obtain the contrast-enhanced image xC[m, n]. Here,
the IDFT is realized using the inverse FFT (IFFT) algorithm. The enhancement level of the image xC[m, n] is
deter-mined by the following parameters; the phase filter cut-off frequency indices uc, vc, scaling coefficient α, phase shift θ,
phase gradient threshold τϕ, and parameters of the Gaussian
smoothing function µ, σ. Therefore, it is important to se-lect the appropriate parameter set which maximizes the im-age contrast. In the algorithm, since we amplify the high fre-quency components to reveal the important details, the noise present in these components is also increased. Therefore, a TV based minimization process can be a useful solution. In most image processing applications, the TV of the original image x[m, n] is minimized [6–9]. There have been also sev-eral attempts to utilize weighted variation based frameworks to obtain better results [10, 11]. In our study, instead of mini-mizing the TV over the entire image, we select “busy” regions of the image and carry out the optimization process over se-lected regions. Therefore, background pixels are excluded in the optimization process. Since only partial image informa-tion is used in the calculainforma-tion of “variainforma-tion”, we define “Se-lective Variation” (SV) as follows:
SV (xC) = S[m, n]· ( ∑ m,n |xC[m + 1, n]− xC[m, n]| +∑ m,n |xC[m, n + 1]− xC[m, n]| ) (8) where the selected pixels are obtained as follows:
S[m, n] = 1, x[m, n] >b12 m+b 2 ∑ i=m−b 2, n+b 2 ∑ j=n−b 2, x[i, j] + β 1, x[m, n] <b12 m+b 2 ∑ i=m−b 2, n+b 2 ∑ j=n−b 2, x[i, j]− β 0, otherwise (9)
where b denotes the overlapping local window size and β is an additive constant which determines a deviation limit for each pixel from the average values of their local blocks.
The ideal parameter set for the proposed enhancement al-gorithm is obtained by solving the following minimization problem: x∗C[m, n] = arg max uc,vc,θ,τϕ,α SV (xC[m, n]) subject to uc< ˆM , vc< ˆN π K16 θ 6 π K2 , c1π6 τϕ6 c2π, and a16 α 6 a2 (10)
where x∗C[m, n] is the enhanced image obtained using the ideal parameter set. K1and K2determine the phase
inter-val added to the high frequency components of the spectrum. The c1, c2 coefficients determine the interval for significant
phase transitions, and a1, a2values are used to limit the
scal-ing coefficient α used in the weightscal-ing stage. 3. EXPERIMENTAL STUDIES
The ideal parameter set which minimizes Equation 10 is de-termined by covering the following parameter space using a grid-search framework: uc∈ [ 1, ˆM ] , vc∈ [ 1, ˆN ] , θ∈ ( π 210, π 23 ) , α∈ (1, 3) , τϕ∈ (0.5π, 2.5π) (11)
The proposed framework is implemented in MATLAB envi-ronment on a computer containing Intel(R) Core(TM) i5 3.40 GHz processor, 8 GB RAM with Microsoft Windows 7 op-erating system. The enhancement of a single image of size 512× 512 takes approximately 0.1351 seconds. Experimen-tal results show that, the proposed algorithm obtains satisfac-tory enhancement results, if the parameters are selected as
uc= vc= 2, θ = π/32, α = 2, τϕ= π/4.
In order to test the effectiveness of the proposed con-trast enhancement framework, a comparative performance analysis is carried out by comparing the performance of the proposed technique with the performances of baseline en-hancement methodologies. In the performance analysis, 25 reference images of size 384× 512 of the TID2008 image dataset [12] are used after performing a contrast reduction process.
The proposed phase-based enhancement framework is compared with several CLAHE techniques which model the results with different distributions (Rayleigh, uniform, exponential). In addition, a balanced CLAHE approach (BCLAHE) [13] is employed in the comparison. Frequency domain approaches based on homomorphic filtering [14] and Aare M¨allo method (MEAM) [15] are also utilized in the
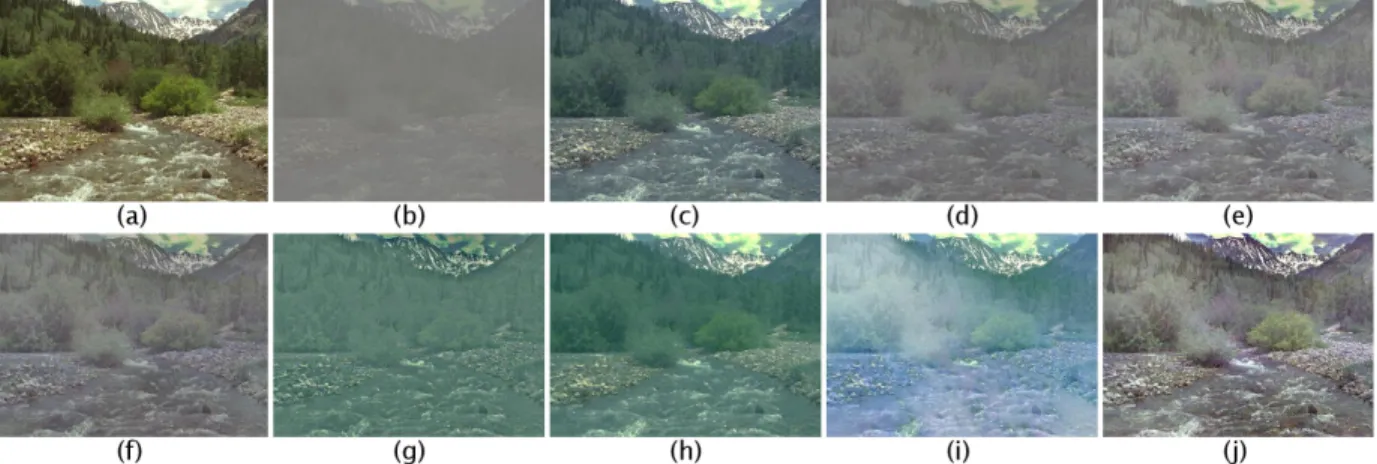
tests. The last enhancement method used is the comparison is the Retinex based-enhancement framework [16]. The en-hancement outputs of the proposed and baseline algorithms on a sample image are presented in Figure 1.
By looking at the enhancement results presented in Fig-ure 1 one can observe that, BCLAHE, CLAHE exponential, and the proposed phase-based enhancement algorithms pro-vide noticeable improvements on image contrast. However, it can be easily observed that, the proposed scheme enhances the foreground/background separability better than the base-line techniques.
In order to obtain a fair and quantitative performance analysis, “Color Enhancement Factor (CEF)” [18], Histogram Flatness (HF) & Histogram Spread (HS) [19], and Measure of Enhancement (EME) [20] objective measures are used in the performance comparisons. These objective measures are selected to quantify the colorfulness, to investigate the intensity distribution and to measure the level of local en-hancement in the enhanced image. These measures provide quantitative evaluation of the enhancement level by utilizing a “global” approach where the enhancement quality is evalu-ated by a single score for the whole image. In addition to the global approach, a more comprehensive performance evalu-ation methodology is proposed. In this approach, the input image is divided into N × N non-overlapping sub-blocks. Then, the objective performance measures are calculated for each sub-block. Using the performance scores obtained for each sub-block, the “performance rate plot” of each method is evaluated. The performance rate plots compute the per-centage of sub-blocks which provide objective scores higher than the prescribed threshold values. The performance rate plots are similar to the success rate plots used in visual object tracking applications [21].
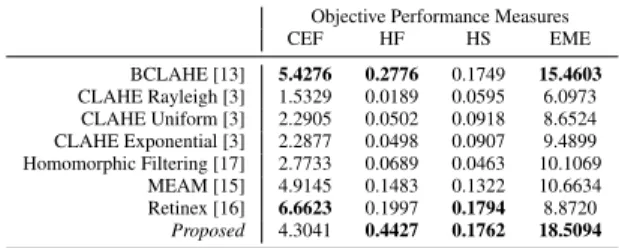
In the objective evaluations, the performance of the pro-posed scheme is compared with the performances of the baseline techniques using the objective performance mea-sures computed over 25 images. The average performance of each enhancement framework corresponding to each objec-tive measure is presented in Table 1.
Table 1. Average performance of the enhancement tech-niques on the objective performance measures.
Objective Performance Measures
CEF HF HS EME BCLAHE [13] 5.4276 0.2776 0.1749 15.4603 CLAHE Rayleigh [3] 1.5329 0.0189 0.0595 6.0973 CLAHE Uniform [3] 2.2905 0.0502 0.0918 8.6524 CLAHE Exponential [3] 2.2877 0.0498 0.0907 9.4899 Homomorphic Filtering [17] 2.7733 0.0689 0.0463 10.1069 MEAM [15] 4.9145 0.1483 0.1322 10.6634 Retinex [16] 6.6623 0.1997 0.1794 8.8720 Proposed 4.3041 0.4427 0.1762 18.5094
In Table 1, the highest two scores obtained for each ob-jective performance measure are written in bold font. By looking at the results presented in Table 1, one can conclude
Fig. 1. The enhancement results of a sample image of TID2008 image dataset by the proposed and baseline enhancement algorithms. (a) Original Image, (b) Low Contrast Image (c) BCLAHE [13], (d) CLAHE Rayleigh [3], (e) CLAHE Uniform [3], (f) CLAHE Exponential [3], (g) Homomorphic Filtering [17], (h) MEAM [15], (i) Retinex [16], (j) Proposed.
that the proposed technique outperforms the baseline methods in most of the objective quality measures. The BCLAHE and CLAHE exponential frameworks also provide satisfactory performance on several performance measures. Although the results presented in Table 1, which are obtained by the global approach, give an idea about the enhancement perfor-mance, a more comprehensive evaluation approach is utilized by constructing performance rate plots for each objective measure. The performance rate plots corresponding to each objective performance measure and enhancement algorithm are presented in Figure 2.
(a) (b)
(c) (d)
Fig. 2. Performance rate plots (N = 32) for objective per-formance measures. Area Under Curve (AUC) measures for each enhancement framework are presented in the legend of the figure. Higher values of AUC measure correspond to higher performance.
The performance rate plots for the CEF measure (Fig-ure 2(a)) show that the Retinex and BCLAHE enhancement frameworks outperform the remaining techniques on color enhancement. Although the Retinex technique provides bet-ter performance on color enhancement, it introduces color artifacts on the images. By looking at the histogram based performance plots (HF&HS) presented in Figure 2(b) and Figure 2(c), one can conclude that the proposed phase-based scheme outperforms the baseline techniques on histogram based performance measures. Although CLAHE based en-hancement methods operate directly on the image histogram, the proposed algorithm provides better histogram flatness and histogram spread performances without using any histogram information. The results show the efficiency of the proposed algorithm by intrinsically balancing the histogram for bet-ter enhancement performance. The EME performance plots presented in Figure 2(d) show that the proposed enhance-ment framework achieves the highest performance on local contrast-based EME measure. The BCLAHE technique also provides an acceptable performance on the EME measure.
4. CONCLUSION
In this article, an image enhancement framework which makes use of the image phase information is proposed to improve the structural details in images. In the pro-posed scheme, phase variations are translated into amplitude changes in order to reveal the suppressed details present in the high frequency components. In this way, highly struc-tured regions of the image become more significant than the background. The performance of the proposed technique is evaluated on the TID2008 image dataset. Experimental results show that the proposed scheme obtains satisfactory performance on the objective performance evaluations.
5. REFERENCES
[1] Anil K. Jain, Fundamentals of Digital Image
Process-ing, Prentice-Hall, Englewood Cliffs, 1989.
[2] Stephen M. Pizer, E. Philip Amburn, John D. Austin, Robert Cromartie, Ari Geselowitz, Trey Greer, Bart Ter Haar Romeny, and John B. Zimmerman, “Adaptive histogram equalization and its variations,” Comput.
Vi-sion Graph. Image Process., vol. 39, no. 3, pp. 355–368,
Sept. 1987.
[3] Karel Zuiderveld, “Graphics gems iv,” chapter Contrast Limited Adaptive Histogram Equalization, pp. 474–485. Academic Press Professional, Inc., San Diego, CA, USA, 1994.
[4] Ali M. Reza, “Realization of the Contrast Limited Adaptive Histogram Equalization (CLAHE) for Real-Time Image Enhancement,” Journal of VLSI signal
pro-cessing systems for signal, image and video technology,
vol. 38, no. 1, pp. 35–44, 2004.
[5] S. M. Pizer, R. E. Johnston, J. P. Ericksen, B. C. Yankaskas, and K. E. Muller, “Contrast-limited adap-tive histogram equalization: speed and effecadap-tiveness,” in [1990] Proceedings of the First Conference on
Visu-alization in Biomedical Computing, May 1990, pp. 337–
345.
[6] M. Tofighi, O. Yorulmaz, K. Kse, D. C. Yldrm, R. etin Atalay, and A. E. etin, “Phase and tv based convex sets for blind deconvolution of microscopic images,” IEEE
Journal of Selected Topics in Signal Processing, vol. 10,
no. 1, pp. 81–91, Feb 2016.
[7] Leonid I. Rudin, Stanley Osher, and Emad Fatemi, “Nonlinear total variation based noise removal algo-rithms,” Physica D: Nonlinear Phenomena, vol. 60, no. 1, pp. 259 – 268, 1992.
[8] Antonin Chambolle, “An algorithm for total variation minimization and applications,” Journal of
Mathemati-cal Imaging and Vision, vol. 20, no. 1, pp. 89–97, 2004.
[9] K. Kose, V. Cevher, and A. E. Cetin, “Filtered varia-tion method for denoising and sparse signal processing,” in 2012 IEEE International Conference on Acoustics,
Speech and Signal Processing (ICASSP), March 2012,
pp. 3329–3332.
[10] Yan Liu, Jianhua Ma, Yi Fan, and Zhengrong Liang, “Adaptive-weighted total variation minimization for sparse data toward low-dose x-ray computed tomogra-phy image reconstruction,” Physics in Medicine &
Biol-ogy, vol. 57, no. 23, pp. 7923, 2012.
[11] Xueyang Fu, Delu Zeng, Yue Huang, Xiao-Ping Zhang, and Xinghao Ding, “A weighted variational model for simultaneous reflectance and illumination estimation,” in Proceedings of the IEEE Conference on Computer
Vi-sion and Pattern Recognition, 2016, pp. 2782–2790.
[12] N. Ponomarenko, V. Lukin, A. Zelensky, K. Egiazar-ian, M. Carli, and F. Battisti, “TID2008 - A Database for Evaluation of Full-Reference Visual Quality Assess-ment Metrics,” Advances of Modern Radioelectronics, vol. 10, pp. 30–45, 2009.
[13] Francesco Branchitta, Marco Diani, Giovanni Corsini, and Antonio Porta, “Dynamic-range compression and contrast enhancement in infrared imaging systems,”
Op-tical Engineering, vol. 47, no. 7, pp. 076401–076401,
2008.
[14] Tarun Kumar Agarwal, Mayank Tiwari, and Subir Singh Lamba, “Modified histogram based contrast enhance-ment using homomorphic filtering for medical images,” in Advance Computing Conference (IACC), 2014 IEEE
International. IEEE, 2014, pp. 964–968.
[15] Carl Salvaggio Seth Weith-Glushko, “Quantitative anal-ysis of infrared contrast enhancement algorithms,” 2007. [16] Zia-ur Rahman, Daniel J Jobson, and Glenn A Woodell, “Retinex processing for automatic image enhancement,”
Journal of Electronic Imaging, vol. 13, no. 1, pp. 100–
110, 2004.
[17] Igor Belykh, Homomorphic Filtering for Radiographic
Image Contrast Enhancement and Artifacts Elimination,
pp. 423–430, Springer International Publishing, 2015. [18] Yan-Yu Fu, Color image quality measures and retrieval,
New Jersey Institute of Technology, 2006.
[19] A. K. Tripathi, S. Mukhopadhyay, and A. K. Dhara, “Performance metrics for image contrast,” in 2011
In-ternational Conference on Image Information Process-ing, Nov 2011, pp. 1–4.
[20] Suneet Gupta and Rabins Porwal, “Appropriate contrast enhancement measures for brain and breast cancer im-ages,” International journal of biomedical imaging, vol. 2016, 2016.
[21] Yi Wu, Jongwoo Lim, and Ming-Hsuan Yang, “Online object tracking: A benchmark,” in Proceedings of the
IEEE conference on computer vision and pattern recog-nition, 2013, pp. 2411–2418.