APPLICATION OF GEOGRAPHIC
INFORMATION SYSTEM (GIS) AND NEURAL
NETWORKING IN IDENTIFICATION AND
PREDICTION OF TOURIST HOT SPOTS: CASE
OF AEGEAN REGION OF TURKEY
2021
MASTER THESIS
COMPUTER ENGINEERING
Asma RAFIQUE
Thesis Advisor
APPLICATION OF GEOGRAPHIC INFORMATION SYSTEM (GIS) AND NEURAL NETWORKING IN IDENTIFICATION AND PREDICTION OF
TOURIST HOT SPOTS: CASE OF AEGEAN REGION OF TURKEY
Asma RAFIQUE
T.C.
Karabuk University Institute of Graduate Programs Department of Computer Engineering
Prepared as Master Thesis
Thesis Advisor
Prof. Dr. İsmail Rakıp KARAŞ
KARABUK January 2021
ii
I certify that in my opinion the thesis submitted by Asma RAFIQUE titled “APPLICATION OF GEOGRAPHIC INFORMATION SYSTEM (GIS) AND NEURAL NETWORKING IN IDENTIFICATION AND PREDICTION OF TOURIST HOT SPOTS: CASE OF AEGEAN REGION OF TURKEY” is fully adequate in scope and in quality as a thesis for the degree of Master of Science.
Prof.Dr. İsmail Rakıp KARAŞ ...
Thesis Advisor, Department of Computer Engineering
This thesis is accepted by the examining committee with a unanimous vote in the Department of Computer Engineering as a Master of Science thesis. January 26,2021
Examining Committee Members (Institutions) Signature
Chairman : Prof.Dr.Abdurrahman EYMEN (ERÜ) ...
Member : Prof.Dr. İsmail Rakıp KARAŞ (KBU) ...
Member : Assist.Prof.Dr. Kasım ÖZACAR (KBU) ...
The degree of Master of Science by the thesis submitted is approved by the Administrative Board of the Institute of Graduate Programs, Karabuk University.
Prof. Dr. Hasan SOLMAZ ...
iii
“I declare that all the information within this thesis has been gathered and presented in accordance with academic regulations and ethical principles and I have according to the requirements of these regulations and principles cited all those which do not originate in this work as well.”
iv
ABSTRACT
M. Sc. Thesis
APPLICATION OF GEOGRAPHIC INFORMATION SYSTEM (GIS) AND NEURAL NETWORKING IN IDENTIFICATION AND PREDICTION OF
TOURIST HOT SPOTS: CASE OF AEGEAN REGION OF TURKEY
Asma RAFIQUE
Karabük University Institute of Graduate Programs The Department of Computer Engineering
Thesis Advisor
Prof. Dr. İsmail Rakıp KARAŞ January 2021, 62 pages
The exploratory data analysis tools of Geographic Information System (GIS) are found very helpful to explain the extent of spatial dependence and association of various important variables of different scientific fields of inquiry. Exploratory Spatial Data Analysis (ESDA), which is part of spatial statistics tools of GIS, and the application of Global Moran’s I statistics are very important in providing visual insights of spatial data. These tools are very helpful in detection and identification of spatial patterns and hotspots of an activity or process, through the measurement of spatial autocorrelation. Similarly, the use of Neural Network has also become very useful technique in predicting and projecting various spatial parameters of interest over the space. In recent years, the application of GIS and Neural Networking has gained much popularity in tourism studies. Tourism has become leading economic activity in the world in recent decades and many developed and developing countries are shifting their economic policies towards promoting tourism. However, sustainable tourism
v
development also requires strong policies to minimize the environmental damages. For this purpose, new research initiatives with the use of innovative techniques are required. In this background, the present study is aimed to investigate the spatial association of domestic and inbound tourist arrivals to 123 districts of all eight provinces of the Aegean Region of Turkey. Furthermore, the present research also targeted to detect and predict the potential of future hotspots regarding tourism activities in the region. The study employs ESDA techniques of GIS and Artificial Neural Network Modelling for the analysis. District-level tourism data of the Aegean Region comprising domestic and foreign tourist arrivals during 2015-2019 was collected from the Turkish Ministry of Culture and Tourism. The data was transformed into logarithm for normalization to avoid any skewness. For the analysis, the Arc GIS, GeoDa and MATLAB programs were used. The tests of local and global spatial autocorrelation and hotspot analysis was conducted to visualize and determine spatial association and location of the tourist hotspots in the region. The results of the study revealed the concentration of tourist activities in the coastal areas of the selected regions. Meanwhile, it was found that inland districts received very little number of tourists. The results of hotspot analysis confirmed the high clusters of tourists in the coastal towns of the provinces of Izmir, Aydın, and Muğla. According to the results of ANN model, among the districts of Izmir province, the most suitable areas of potential tourism hotspots are located in the districts of Konak, Foça, Aliağa, Barnova, Narlıdere, and coastal areas of Sefrihisar, Menderes and Karaburun. In the Aydın province, Didim and Soke are found most suitable areas for future tourism development. Similarly, the coastal areas of Muğla province including Bodrum, Ula, Marmaris, Ortanca and Dalaman have great tourism development potential in the region. The study is significant in the provision of useful information regarding resource allocation to the tourism hotspots and the implication of sustainable tourism policy to better utilization of tourism potential.
Key Words: Exploratory Spatial Data Analysis, Autocorrelation, Feedforward Neural Network, Tourism, Aegean Region
vi
ÖZET
Yüksek Lisans Tezi
TURİZM CAZİBE MERKEZLERİNİN TANIMLANMASI VE TAHMİN EDİLMESİNE YÖNELİK COĞRAFİ BİLGİ SİSTEMİ VE YAPAY SİNİR
AĞLARI UYGULAMASI: EGE BÖLGESİ ÖRNEĞİ
Asma RAFIQUE
Karabük Üniversitesi Lisansüstü Eğitim Enstitüsü Bilgisayar Mühendisliği Anabilim Dalı
Tez Danışmanı
Prof. Dr. İsmail Rakıp KARAŞ Ocak 2021, 62 sayfa
Coğrafi Bilgi Sistemlerindeki (CBS) keşifsel veri analizi araçları, farklı alanlarındaki muhtelif değişkenlerin, konumsal bağımlılıklarını ve ilişkilerini açıklamakta çok faydalıdır. Konumsal istatistik araçlarının bir parçası olan “Exploratory Spatial Data Analysis (ESDA)” ve “Global Moran’s I” analizlerinin birlikte uygulanması, mekânsal verilerin görsel olarak kavranmasında önemli bir yere sahiptir. Ayrıca bu araçlar, konumsal otokorelasyonun ölçülmesi yoluyla, bir faaliyet veya sürecin konumsal yapısının ve sıcak noktalarının / cazibe merkezlerinin saptanması ve tanımlanmasında da etkilidir. Diğer yandan, son yıllarda farklı alanlardaki konumsal parametreleri tahmin ve projekte etmede Yapay Sinir Ağları (YSA) çok faydalı bir yöntem olarak dikkat çekmektedir. CBS ve YSA uygulamalarının birlikte kullanımı ise turizm çalışmalarında popüler bir yaklaşım olarak karşımıza çıkmıştır. Turizm, son yıllarda dünyada önde gelen ekonomik faaliyetlerden biri haline gelmiştir ve birçok gelişmiş ve gelişmekte olan ülke, ekonomik politikalarını turizmi teşvik etme yönünde
vii
geliştirmektedir. Bununla birlikte, sürdürülebilir turizm gelişimi, çevresel zararları en aza indirecek güçlü politikaları gerektirir. Bu amaçla, yenilikçi yöntemlerin kullanıldığı araştırma girişimlerine günümüzde daha fazla ihtiyaç duyulmaktadır. Bu arka plana dayanan söz konusu çalışmada, Ege Bölgesi’ndeki 8 ile ait 123 ilçeyi ziyaret eden yerli ve yabancı turistlerin konumsal hareketliliğinin araştırılması amaçlamaktadır. Mevcut araştırma aynı zamanda, bölgedeki turizm faaliyetlerine bağlı olarak gelecekteki potansiyel cazibe merkezlerini tespit ve tahmin etmeyi hedeflemektedir. Çalışmada, analiz için CBS ve YSA Modellemesinin ESDA teknikleri kullanılmıştır. Yerli ve yabancı turistlerin 2015-2019 dönemindeki hareketliliğini içeren Ege Bölgesi'nin ilçe düzeyindeki turizm verileri, Kültür ve Turizm Bakanlığı'ndan temin edilmiştir. Herhangi bir tutarsızlığa neden olmamak için veriler logaritmik hale dönüştürülmüş ve normalize edilmiştir. Analiz için ArcGIS, GeoDa ve MATLAB programları kullanılmıştır. Turistik cazibe merkezleri arasındaki konumsal ilişkiyi görselleştirmek ve tanımlamak için, yerel ve küresel seviyede konumsal otokorelasyon testleri yapılmıştır. Çalışmanın sonuçları, seçilen alanda kıyı bölgelerindeki turistik faaliyetlerin yoğunluğunu ortaya koymuş, iç kesimlerin çok az turist çektiği tespit edilmiştir. Cazibe merkezlerine ilişkin analizlerin sonuçları, İzmir, Aydın ve Muğla illerinin kıyı kentlerindeki yüksek turist kümesini doğrulamıştır. YSA modelinin sonuçlarına göre, İzmir’in ilçeleri arasında Konak, Foça, Aliağa, Bornova, Narlıdere ilçeleri ile Seferihisar, Menderes ve Karaburun kıyı bölgeleri potansiyel cazibe merkezleri olarak göze çarpmaktadır. Aydın ilinde ise, Didim ve Söke gelecekteki turizm gelişimi için en uygun bölgelerdir. Benzer şekilde Muğla ilinin Bodrum, Ula, Marmaris, Ortanca ve Dalaman gibi kıyı kesimleri de büyük bir turizm geliştirme potansiyeline sahiptir.
Bu çalışmada, potansiyel cazibe merkezleri için kaynak tahsisi yapılması ve turizm potansiyelini etkin olarak kullanmayı sağlayacak sürdürülebilir bir turizm politikası geliştirilmesi yönünde anlamlı bilgiler sunulmuştur.
Anahtar Kelimeler: Keşifsel Konumsal Veri Analizi, Otokorelasyon, İleri Beslemeli Sinir Ağı, Turizm, Ege Bölgesi
viii
ACKNOWLEDGEMENTS
I would like to thank my supervisor Prof. Dr Ismail Rakip KARAŞ for his continuous support and guidance during my research. Besides, I am also grateful for the help and assistance of Dr. Sohaib K.M. Abujayyab in data analysis. I am also thankful to all the teachers who taught me various courses during my stay at the department of Computer Engineering, Karabuk University Turkey. I would like to pay my gratitude to my parents, brother and sisters for all of their prayers without which I couldn’t achieve any success in my life. My special thanks go to my husband and best friend Dr. Ashfak Ahmad KHAN for his keen interest to complete this thesis successfully. I will never forget his love, care and continuing support to achieve my academic targets.
ix CONTENTS Page APPROVAL …….………...ii ABSTRACT ... iv ÖZET ... vi ACKNOWLEDGEMENTS ... viii CONTENTS ... ix LIST OF FIGURES ... xi
LIST OF TABLES ... xii
SYMBOLS AND ABBREVITIONS INDEX ... xiii
CHAPTER 1 ... 1
INTRODUCTION ... 1
1.1 BACKGROUND ... 1
1.2 SCOPE OF THE STUDY ... 3
1.3 PROBLEM STATEMENT ... 4
1.4 RESEARCH OBJECTIVES ... 6
1.5 SIGNIFICANCE OF THE STUDY ... 7
1.6 OVERVIEW OF METHODOLOGY ... 8
1.7 ORGANIZATION OF THESIS ... 8
CHAPTER 2 ... 10
LITERATURE REVIEW ... 10
2.1 SPATIAL ANALYSIS IN GIS ... 10
2.2 ARTIFICIAL NEURAL NETWORK MODELLING ... 11
2.3 APPLICATION OF GIS IN TOURISM RESEARCH ... 13
2.3.1 Use of GIS in Tourism Planning and Management ... 14
2.3.2 Use of GIS Spatial Statistics in Tourism ... 16
x
Page
2.5 APPLICATION OF GIS AND ANN IN TOURISM STUDIES RELATED TO
TURKEY ... 23 2.6 LITERATURE GAP ... 24 CHAPTER 3 ... 26 METHODOLOGY ... 26 3.1 STUDY AREA ... 26 3.2 COLLECTION OF DATA ... 27
3.3 MAPPING THE DATA ... 28
3.4 SPATIAL STATISTICS IN ARCGIS AND GEODA ... 28
3.5 EXPLORATORY SPATIAL DATA ANALYSIS ... 31
3.5.1 Spatial Autocorrelation ... 32
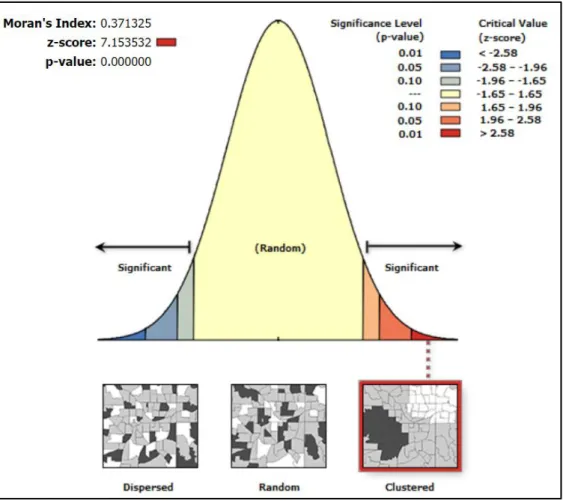
3.5.1.1 Measurement of Spatial Autocorrelation - Global Moran’s I Statistics . 34 3.5.2 Cluster and Outlier Analysis (Anselin’s local Moran’s I) ... 36
3.5.3 Hot spot analysis (Getis-Ord i G∗) ... 36
3.6 PREPARING THE DATA FOR ARTIFICIAL NEURAL NETWORK MODELLING ... 38
3.7 DEVELOPMENT OF FEEDFORWARD NEURAL NETWORK MODEL .. 38
CHAPTER 4 ... 43
RESULTS AND DISCUSSION ... 43
CHAPTER 5 ... 56
CONCLUSION ... 56
REFERENCES ... 59
xi
LIST OF FIGURES
Page
Figure 1.1. Overview of Methodology ... 9
Figure 2.1. Presentation of Raster and Vector Dataset ... 11
Figure 2.2. (a) Biological neural network, (b) Artificial neural network ... 12
Figure 2.3. General Classification of Neural Network Models ... 13
Figure 3.1. Location map of Aegean Region of Turkey ... 27
Figure 3.2. Spatial Statistic Tools in ArcGIS ... 29
Figure 3.3. Map layout and functions in GeoDa ... 32
Figure 3.4. Description of Spatial Autocorrelation ... 34
Figure 3.5. Development of Feedforward Neural Network Model... 40
Figure 3.6. The factor maps of (a) land use, (b) nearness to coast, (c) nearness to fault lines, and (d) Geology ... 41
Figure 3.7. The factor maps of (a) aspect, (b) nearness to water streams, (c) nearness to roads, and (d) slope ... 42
Figure 4.1. The choropleth map of inbound tourist arrivals ... 44
Figure 4.2. The choropleth maps of domestic tourist arrivals ... 44
Figure 4.3. The Moran’s significance maps for domestic tourist arrivals 2015 ... 47
Figure 4.4. The Moran’s significance maps for domestic tourist arrivals 2019 ... 47
Figure 4.5. The Moran’s significance maps for inbound tourist arrivals 2015 ... 48
Figure 4.6. The Moran’s significance maps for inbound tourist arrivals 2019 ... 49
Figure 4.7. Hotspots of tourists (a) Domestic 2015 (b) Domestic 2019 (c) Inbound 2015 (d) Inbound 2019 ... 50
Figure 4.8. An example of the developed model structure based on all 08 factors. . 52
Figure 4.9. Confusion Matrix of NN model ... 53
Figure 4.10. Map of suitable areas for future tourism development in Aegean Region of Turkey ... 54
xii
LIST OF TABLES
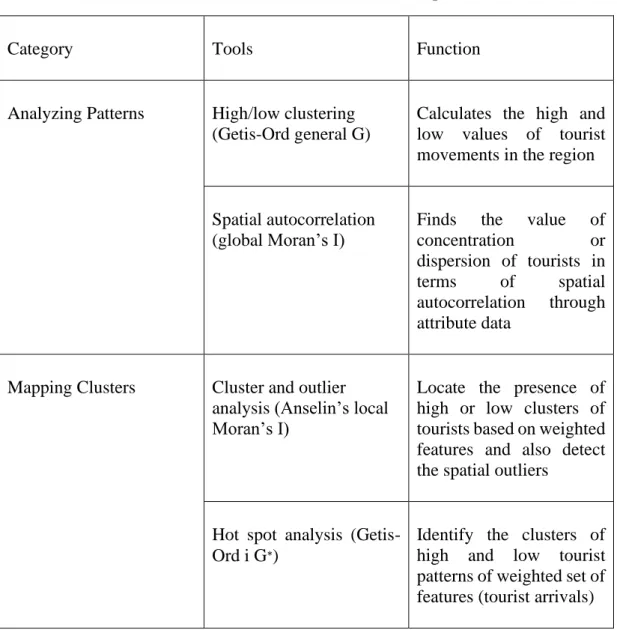
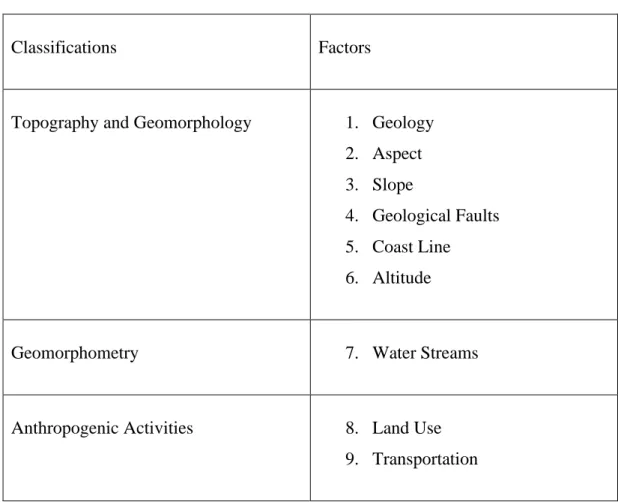
Page Table 3.1. Functions of different tools in ArcGIS spatial statistics ... 30 Table 3.2. The selected factors for Feedforward Neural Network Analysis ... 38 Table 4.1. The Moran’s I values for domestic and inbound tourist arrivals ... 46 Table 4.4. The correlation between the tourism hotspots and the collected factors .. 51
xiii
SYMBOLS AND ABBREVITIONS INDEX
GIS : Geographic Information System ESDA : Exploratory Spatial Data Analysis ANN : Artificial Neural Network
LISA : Local Indicator of Spatial Association AI : Artificial Intelligence
1
CHAPTER 1
INTRODUCTION
1.1 BACKGROUND
Recent developments in the computer technologies have provided great opportunities for advanced analytic analyses in various scientific disciplines. The application of such technologies in efficient data analysis with reduced cost and time has become norm of modern-day globalized world. Geographic Information System (GIS) refers to a multicomponent computer environment which is used for the organization, management, and analysis of spatial data to answer research questions of varied scientific disciplines. A GIS software enables us to locate, visualize and interpret the spatial data which is useful for understanding the relationships, trends, and patterns of different variables of interest. This state of art computer program can store and manage vast amount of data for multipurpose uses in planning and management of different spatial entities that are crucial for sustainable future of our earth. Similarly, Artificial Neural Network (ANN) technique is also important in recognition and classification of patterns in spatial data and predicting the future trends very accurately. The ANN works like the biological neurons to evaluate the data and solve the real-world problem in much efficient way.
Tourism has gained much popularity as an alternative industry in recent decades due to its ever-increasing share in worlds economy. Many developing countries of the world have made tourism an important part of their economic policies as an important source of foreign exchange earnings and diversification of economic activities. According to recent estimates, tourism has significant direct and indirect contribution to Gross Domestic Product (GDP) and job creation in the world. Turkey, a developing country, is listed among the top tourist destination of the world with a growing tourism industry. The government of Turkey implemented tourism incentive law in 1980s for maximizing the country’s tourism potential in order to generate large revenues (Göymen, 2000). According to current statistics, the country ranks 6th in the list of
2
most famous global inbound tourist destination, which attracted more than 45 million tourist arrivals in 2019 contributing 41.1 billion $ tourism receipts in the national economy (WTTC, 2020). There are many geographical, historical, and cultural factors that make the country an attractive destination for inbound and domestic tourists. The unique location of the country bridging the continents of Asia and Europe, the extended coastal areas with warm climate provide great deal of sun, sand, and sea (3S) tourism.
The combination of GIS and ANN offers the chance to utilize the powerful functions of both techniques that can enhance the accuracy of decision-making and development of strategies for many important sectors of human societies including tourism. The use of spatial analytic techniques combined with ANN approach has become popular in tourism research because of the industry’s strong spatial dependence, though application of ANN is still limited to specific dimensions. It is evident that global tourism industry plays vital role in local economic development by providing means of exchange earnings, income diversification as well environmental sustainability by offering alternatives to reduce dependence on natural resources (Brida, Cortes-Jimenez, & Pulina, 2016; Martins, Gan, & Ferreira-Lopes, 2017).
Many developing countries have developed national economic policies with special emphasis to tourism as cheaper source of development compared with large scale industrialization which require huge capital investments and technological advancements. Therefore, a continues growth in tourism sector is observed at global scale with development of new tourist destinations and infrastructure building to satisfy the growing demands of inbound tourists. However, economic-oriented approach in the growth of tourism may cause neglect in environmental protection and conservation which can be lethal to future sustainability. The application of GIS and ANN can provide great assistance to policy formulation and better solution to resource efficiency in this sector because of their ability to collect, manipulate and organize large amount of spatial data in lesser time.
3
1.2 SCOPE OF THE STUDY
The rapid growth of tourism in the world is associated to many factors like increase in leisure time, growth in income, and advancements in communication and transportation. At policy level, however, the economic value of tourism makes it prominent over many other sectors of a country’s economy. Therefore, governments of many developed and developing countries of the world pay special attention to expand the tourism industry for economic growth and generating foreign revenues. In particular, the developing countries utilize the potential of tourism as an alternative to industrialization to meet the needs of growing populations and poverty reduction. However, like many other industries, the economic benefits of tourism growth are also directly based on an areas’ natural resources. Tourism development can put grave consequences on the natural environment of the destination areas that may lead to irreversible damages to the physical environment. Therefore, a very cautious approach is required to make balance between economic development and environmental sustainability during the establishment of tourist destinations in an area.
Modern computer technologies like GIS and ANN can certainly play important role in better management and planning of the tourist destination to maximize the potential without compromising the natural and social environment. The use of such techniques can help providing detailed insights of spatial characteristics of a region which are necessary for the development of tourism infrastructure. Besides, the spatial statistics tools of the GIS also enable us to measure the homogeneity and heterogeneity of different locations in terms of tourism growth that is an important parameter to measure the spatial changes in tourism activities over time. Artificial Neural Network (ANN) technique, on the other hand, can help in classification and predicting of irregular tourism data very accurately for efficient management of tourism resources. The integration of both GIS and ANN is therefore very useful in locating the tourist hotspots, visualization and mapping the clusters of tourism activity, depicting the changes in spatial patterns of tourism destination, and predicting the future destinations.
4
The spatial patterns of tourism and location of hotspots are considered as an important indicator of measurement of tourist activity in a region. Exploratory spatial data analysis techniques identify the areas of highest and lowest tourist activities which is very crucial for resource allocation and minimizing disparities among various regions. ANN technique also provides important information regarding possibilities of new tourist destinations to overcome the issue of over-crowdedness and sustainability in the future. A sound tourism policy must deal with the problems associated to tourism growth regarding over-crowdedness, traffic congestions, capacities of accommodation and pollution. In this regard, the application of GIS and ANN can contribute to a great extent in the formulation of robust policy for management and planning of tourism. The present study has taken the case study of important tourist regions in Turkey for the application of GIS and ANN in determination and prediction of tourism hotspots.
1.3 PROBLEM STATEMENT
The efficient management and planning of tourism yield better and longstanding performance of tourist destinations which can further strengthen the sustainability of the economy. However, tourism development in an area requires a much comprehensive approach due to the involvement of complex socioeconomic and natural indicators. An unplanned growth of tourism in an area can led to various social, economic, and environmental stresses to the destinations. There are many popular tourist destinations in the world that are facing serious problems of environmental degradation, socioeconomic setbacks, pollution, and resource depletion. The problem is even worse in the developing countries which have not enough technological developments to hinder the environmental damages caused by tourism. At this point, computer-aided programs like GIS and ANN make the task of decision-making and policy formulation more organized and fruitful. The ability of these computer technologies to handle big data in short time make them very useful to locate the trends and patterns of tourism activity in an area and suggest alternative destinations for future tourism growth.
The notion of sustainable development focuses on the optimum utilization of limited natural resources of our world without compromising the needs of future generations.
5
In this context, the excessive exploitation of natural resources is considered a threat for the future of humanity and a race for the search of alternative sources of development is started. Among many other alternatives to minimize the dependence on natural resources, tourism is appreciated well in its practicability and feasibility in diversification of economic activities, job creation and improvements in income. However, economic development has become most attractive impetus for the tourism led growth in many developing countries where important tourist destinations are being utilized over their carrying capacities. Such practices put significant negative impacts on the sustainability of the sector which require strong policy implications for the proper management of old destinations and suitability of new areas as future destinations.
Another important point in the discussion of sustainable tourism development relates to the creating balance among three pillars of sustainability that are economic development, social development, and environmental protection. Most of the developing countries pay much attention on the economic benefits of tourism while environment remains at second priority. This situation can lead to tradeoffs between the three segments of sustainable development which further leads to serious environmental and economic damages in the society. The identification and development of new tourist destination is thus play important strategical role to overcome the tourism related environmental pressure in a region of natural and scenic attraction. The spatial statistics techniques within GIS and feedforward neural network models within ANN approach provide ample opportunities in visualization the present status of tourist clusters and predicting the most suitable areas as alternative destination to diversify the concentration of tourists. Therefore, the application of such techniques can contribute to better policy development for sustainable tourism development.
Turkey is one of the most famous tourist destinations in the world which attract millions of tourists each year. There are strong regional disparities regarding tourism development in Turkey which show large concentrations of inbound tourists in the western and southwestern regions of the country. These variations are embedded in many historical, cultural, socioeconomic and geographic factors and are very common in other regions of the world. However, growth of tourism in a region with already
6
exceeded carrying capacities can cause serious environmental problems threatening the sustainable economic development in the country (Tosun, 2001). Similarly, tourism development limited to certain regions of a country may also widen the regional inequalities which may lead to further problems (Khan, 2018). The review of literature has revealed some empirical studies dealing the economic and financial impacts of tourism in the country by employing different statistical and econometric approaches. However, there is a lack of studies which focus on the spatial dimensions of tourism creating a literature gap in the field.
1.4 RESEARCH OBJECTIVES
There are two primary aims of the present research. First, the present study is aimed to determine the spatial dependence of inbound and domestic tourist arrivals in the 123 districts of the Aegean Region of Turkey during 2015 to 2019. For this purpose, exploratory data analysis techniques have been employed to identify tourism hotspots in the region and depicting the spatial variations of tourist clusters over the selected period. Second, the study also seeks to predict potential areas for future tourism activities based on previous hotspot data and further independent factors of altitude, land use, nearness to roads, nearness to water bodies, geology, slope, aspect, presence of geological faults and nearness to coastline. Artificial neural networking model is used to achieve the second objective of the study.
The aims of the study are followed by the following specific objectives:
• Identification of trends and patterns of the tourist activity in the region by application of spatial autocorrelation technique (Moran’s I statistics).
• Identification of tourist hot spots and detection of the change over time by employing Hot spot analysis (Getis-Ord i G∗).
• Providing visualization of similarities and differences among different tourist destinations through mapping clusters and scatterplot.
• Prediction of suitable future hotspot areas of tourism activity in the region by employing feedforward neural network model.
7
1.5 SIGNIFICANCE OF THE STUDY
A growing trend of tourism in the world is well appreciated for its significant share in economic growth. However, the associated environmental costs must also be determined while maintaining the old tourism destinations and planning for the new ones. Inadequate planning and management of tourist destinations have found to be destructive for the natural environment of the region in terms of increased pollution, resource depletion and environmental degradation. The situation becomes more worse in the developing countries of the world where large tradeoffs between economic development and environmental conservation are observed. Therefore, a strong tourism policy is required for maximizing the economic benefits of tourism while protecting the natural environment. For this purpose, detailed information about the spatial extent, dependence and association of tourism is compulsory to build robust tourism policy.
The findings of present study will provide useful information about the spatial patterns of tourist flows in the Aegean Region of Turkey by means of spatial techniques embedded in GIS and ANN. The identification of the currents spatial patterns of tourist flows and change over time will help resource allocation for tourism development in the region. The detailed visualization of the hotspots will also enable to policy makers to tackle the future problems of over crowdedness in some destinations. In addition, the depiction of change in inbound and domestic tourism clusters will further provide important information about the tourist movements and dispersal in the region which will help to improve service provision. Besides, the study also predicts the possible locations for future tourist destinations which will help reducing the environmental pressure in the regions with exceeded carrying capacity. The review of related literature has shown that many tourism-related studies often ignore the spatial aspect of tourism which is an important part of the sector. Therefore, the present study tries to fill the literature gap in tourism studies by providing useful information about the spatial dependence of tourism in the Aegean Sea Region of Turkey.
8
1.6 OVERVIEW OF METHODOLOGY
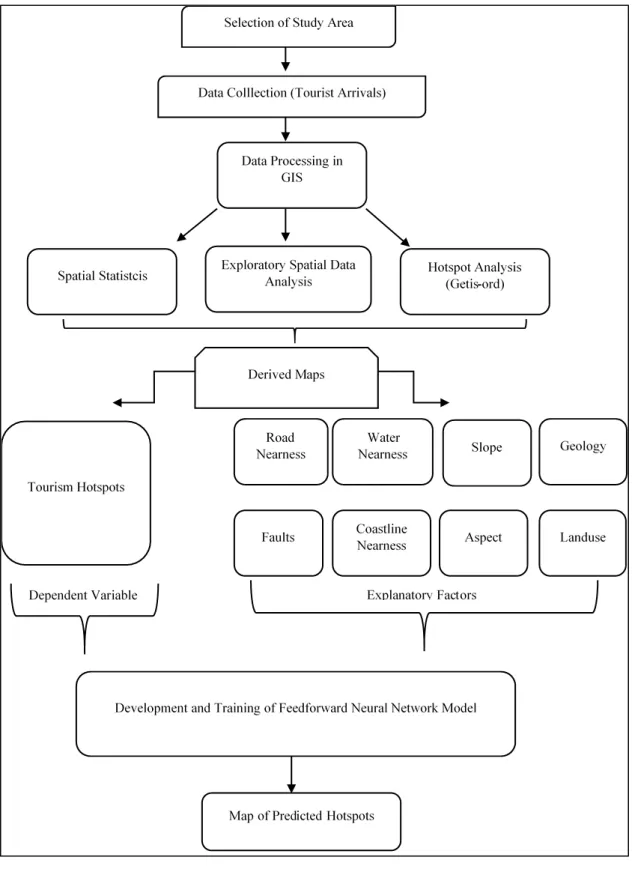
The present research has employed Geographic Information System (GIS) techniques of spatial statistics and exploratory spatial data analysis to inbound and domestic tourist data of 123 districts of the selected region. Tourism data is collected from Turkish Ministry of Culture and Tourism. Spatial Autocorrelation technique is used to determine the global spatial association of tourist flows in the region by calculating Moran’s I value for a period from 2015-2019. Meanwhile, Local Indicator of Spatial Association (LISA) is used to identify the locations of tourist hotspots in the form of Moran’s significance maps. The resultant maps provide the hotspot data which is further analyzed by using feedforward neural network model to predict the future tourism hotspots in the region. Figure 1.1 describes the brief methodological flow of the study. The details of applied methodology are provided in Chapter 3.
1.7 ORGANIZATION OF THESIS
The current study is organized and structured as follows. After the introduction, Chapter 2 provides the basic concepts of GIS and Artificial Neural Networking along with the detailed review of related studies. The chapter discusses the use of GIS and ANN in the field of tourism and important findings of previous studies as well the literature gap which is filled by the present study. Chapter 3 describes the details of methods applied in the study and the processes involved in making digital maps of the area to fulfill the objectives of the study. Chapter 4 explains the findings of the study and detailed discussion. Following the results and discussion, Chapter 5 includes the concluding remarks with some recommendations and policy implications regarding tourism strategies in the region.
9
10
CHAPTER 2
LITERATURE REVIEW
A comprehensive literature is found on the application of different GIS and ANN techniques in much diverse fields of scientific disciplines. This chapter describes the basic concepts of spatial analysis and machine learning briefly, followed by a detailed review of literature on the use of different methods of GIS and Artificial Intelligence in tourism studies. Besides, the chapter also presents the important findings of various studies on tourism using spatial statistics and ESDA alongside different neural network models. In the last part, the chapter also detect literature gap which would be filled by the present study.
2.1 SPATIAL ANALYSIS IN GIS
A Geographic Information System (GIS) is a computer-based system which comprises tools and techniques for storing, analyzing, manipulating, organizing, and visualizing the spatial data in short period of time. The program has great ability to deal large amount of quantitative data associated to any location on earth in digital environment to create digitized maps, building models and projecting real time processes in visualize form. According to the Environmental Systems Research Institute (ESRI), an international provider of GIS software, “GIS is an organized collection of computer hardware, software, geographic data and personnel designed to efficiently capture, store, update, manipulate, analyze and display geographically referenced information”. The data can be presented in vector (points, lines, and polygons) and raster (imageries) forms as described in Figure 2.1.
Spatial analysis in GIS enables us to transform the raw data about different attributes of an area into useful information. The identification and determination of patterns and trends of various variables of interest helps to understand the complex spatial interactions among them which is necessary for adequate decision making. Many scientific fields including, geography, health sciences, ecology, architecture, management studies, business sciences etc. have been utilizing the GIS spatial analysis techniques as vital part of innovative research.
11
Figure 2.1. Presentation of Raster and Vector Dataset. (Source: ESRI)
2.2 ARTIFICIAL NEURAL NETWORK MODELLING
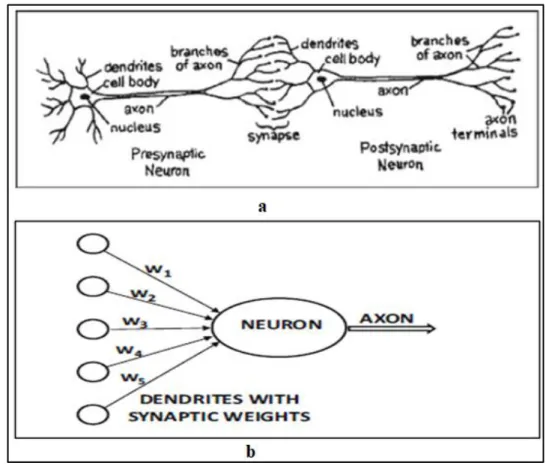
Artificial Neural Networks are very useful part of machine learning techniques which function like a learning mechanism in an organism through nervous system to respond an external stimulus. The nervous system of humans and many other organisms consists of various cells known as neurons which are connected to each other to transmit signals of various stimuli to different parts of body (Figure 2.2a). The idea of artificial neural networks is based on simulation of biological nervous system in which some computation units work as neurons connected to each other with weights of input information (Figure 2.2b). In this way, an artificial neural network measures the function of inputs by transmitting the measured values of input neurons to output neurons employing the intermediate factor of weights.
For the purpose of research, artificial neural networks are trained through different input-output pairs of learning functions which can be further used to predict the outputs. The technique has become much popular in prediction of many spatiotemporal
12
processes including flood site predictions, landslide susceptibility, agroforest zoning and tourism forecasting etc.
Figure 2.2. (a) Biological neural network, (b) Artificial neural network. (Source: Aggarwal, 2018)
A model based on artificial neural network have at least one or more than one layers of different neurons. Many artificial neural network models like Perceptron, Linear Associator, Multi-layer feed-forward networks with Back-Propagation (BP) learning, the Boltzmann machine and the Grossberg model use the output from the units from one layer which can perform the function to activate neurons in only the next layer. There are several others model like Kohonen nets and Hopfield model in which the neurons of same layer can also be activated by the signal. Some other models such as Self- organizing Feature Map (SOFM), offers the possibility in which the network connects a vector of inputs to a two-dimensional grid of output neurons. Different kinds of neural network models are shown in Figure 2.3.
13
Figure 2.3. General Classification of Neural Network Models. (Source: Malik, 2005)
2.3 APPLICATION OF GIS IN TOURISM RESEARCH
Geographic Information System (GIS) provides plenty of sophisticated tools to management, organization, and planning of tourism industry all over the world. This computer-based system offers variety of functions integrated with other components of information technologies to develop digital maps, visualization of places on internet and interactive maps which play critical role in tourism planning and advertisement. Thus, GIS helps the development of tourism destination by handling big tourism data and integrating it into computer environment for further complex analysis. GIS tools can contribute to tourism planning at great extent by identifying different components of tourism infrastructure like transportation, accommodation, and attractive places in
14
geometric, thematic, and topologic manner. As tourism planning requires integrated approach, GIS can facilitate to build useful models which are based on real world experience.
2.3.1 Use of GIS in Tourism Planning and Management
Recent research in different fields of society such as ecology, forestry, economics, geography, and environmental sciences has employed the site suitability analysis of GIS for solving many spatial problems. The powerful tools of spatial analysis are applied not only in selection of suitable locations for large number of socioeconomic activities but also for urban and regional planning. As part of tourism planning, land use suitability analysis is used for detailed insights into the natural and physical properties of area which are necessary for building tourism related infrastructure. There is plethora of empirical studies employing suitability analysis in tourism to identification of best location for tourism development in different regions of the world. GIS approach is tourism studies is also favored by the advocates of sustainable tourism development to measure, visualize, and predict the status of sustainability in any tourism destination.
Site allocation for various types of tourism through GIS offers great opportunities for efficient consumption of tourism potential in an area by maximizing the economic benefits for the local communities. As mentioned earlier, GIS has great ability to transform the real-world data into different layers of vector data which further helps understanding the complex spatial relationship among different variables. Map layers of different natural, physical, socioeconomic, and environmental parameters provide the bases for selecting most adequate areas for future tourism development which would last for long without environmental damages. Spatial analysis of various important features is also referred to multicriterial decision analysis which employs weighted sets of various spatial factors to reach accurate conclusions for best suited sites of tourism. Such methods are highly recommended through results of many empirical studies for better planning and management of tourist destinations.
Large amount of literature on tourism planning and management has utilized the GIS based techniques of multicriteria decision analysis combined with other methods such
15
as analytic hierarchy process and spatial regression to identify and detect the possible sites for alternative tourism activities in a tourist region. In this way, tourist activities may be diversified and dispersed to different areas which reduce the over crowdedness and environmental pressures on the tourism concentrated sites of a destination. Besides, site suitability for developing new tourist destinations is also analyzed to enhance the tourism related development in other regions of a country to reduce the regional disparities within a country. Some selected studies have been discussed in following paragraphs to present the use of GIS in locating tourism potential and planning the destinations.
In a recent study from Iran, Eftekhari and Mahdavi (2019) GIS techniques of multicriteria decision analysis has been used for determination of potential of nature-tourism in Tehran. For the purpose of analysis, GIS based multicriteria technique is employed based on three criteria of Site Feature, Infrastructures and Services, and Risk and Sensitive Areas. Further, the map of areas with higher to lower suitability were produced to depict the important locations of tourism activities. The results of the study also produced the statistical measurement of the extent of the suitable land for tourism development that was approximately 15.87 % of total studied area. Hence, the study provided practical implications for strong tourism policy in the region.
Similarly, an empirical study in China by Deng et al. (2019) utilized sophisticated tools of GIS multicriteria analysis for the selection of appropriate sites for ski tourism combined with weighted linear regression. Many important factors of physical environment like topography and climate conditions integrated with multiple socio-economic indicators were analyzed with help of GIS techniques. Suitable sites for the development of ski resorts were determined by generating metrices of selected factors. The results of analysis confirmed the compatibility of 84% of established ski resorts to the integrated index based on several weighted spatiotemporal and socioeconomic factors. After finding suitable locations, several important strategies for the development of ski resorts were formulated to help decision makers which incorporates the future climate change and socioeconomic scenarios.
16
In a recent study related to GIS conducted by Pan et al. (2019), identification of suitable sites for health tourism development in mountain regions of China has been made by applying combination analytic network process and with Delphi approach and multicriteria decision analysis. In order to provide the comprehensive information regarding potential of health tourism in selected area, suitability maps of four different activities were developed with the help of GIS based on several geographical factors related to wellness tourism. Detailed maps of best locations were produced for the activities of health preserving, sports and recovery, medical healing and aged nursing in the selected districts. The study suggested some useful policy implications for better planning and management of health tourism in China.
2.3.2 Use of GIS Spatial Statistics in Tourism
The use of Exploratory Spatial Data Analysis (ESDA) has also become popular in many distinct areas of investigation as a vital tool to measure spatial variations of different variables(Blazquez and Celis 2013; Gomes, Cunto, and Silva 2017; Nawaz et al. 2019). Some recent empirical studies have employed the spatial statistics tool of GIS to explore the spatial patterns and trends of tourism activities in various parts of the world. Such studies have provided very useful information in understanding the extent of tourism activities and depict the variation over space to determine the patterns of heterogeneity and homogeneity. The findings of such studies have presented very detailed insights of spatial dependence and association of tourism to locate hubs of tourism growth and development in different regions of the world.
In a study conducted in Serbia, Stankov et al. (2017) analyzed the trends and patterns of tourist activities at municipal level by employing ESDA and autocorrelation techniques. A significant level of disparities in tourism movements was observed in the findings of the study which is not addressed in the tourism policy of the country. Moreover, the results also revealed a declining trend of domestic tourist clustering over time in the country. On the other hand, the inbound tourists showed relatively stable and growing trend of high clusters. Such changes in the distribution of tourist clusters in the region are required to be addressed properly for sustainable tourism development in the future.
17
The spatial statistics techniques of GIS have been applied by Chhetri et al. (2013) to analyze the clusters of tourism and hospitality employment in Victoria region of Australia. Some statistical inferences were made on the data of employment related to big tourism industry employers. Besides, the study was also aimed to explore the vicinity of tourism industries by determining the distance from the areas of high economic importance. In this regard, spatial autocorrelation techniques were employed to locate the clusters of selected variables and their patterns over the space. The results of the study revealed the presences of five important clusters of tourism employment which had the potential for developing into big hubs of industrial and business activity in the region.
Similarly, Yang and Wong (2013) used the spatial statistics techniques in GIS environment to figure out the tourism patterns and clusters in China. They evaluated the domestic and inbound tourism activities using district level data to describe the patterns in more sophisticated manner. Besides, their study also utilized the global and local Moran’s I statistics as part of the ESDA to locate the global and local patterns of tourism hotspots. The findings of the study revealed the location of major clusters of tourism activity near the coastal areas and insular areas of the country. It was also found that large disparities were present in distribution of tourism growth within different regions of the country. Useful suggestions for resource allocation and policy implication were detected after the analysis.
In another study in China, Hu, Neelam, and Green (2016) applied the GIS based spatial statistics techniques to explore the activities of inbound tourists in mainland districts. Spatial Autocorrelation analysis revealed the presence of hotspots and cold spots regarding tourism patterns in the areas of study. They also applied multiple regression analysis to determine the impact of other variables on international tourist arrival and found that transportation structure and service facilities had great impact on the number of tourist arrivals. Again, hotspots of tourist activities were found near the coastal areas and adjacent areas to big districts while cold spots were located in western part of the country. The study suggested important policy implications for better planning and management of tourism activities in China.
18
Similar methods were used in a study from Australia in which Chhetri et al. (2017) applied spatial econometric modeling and spatial autocorrelation techniques to locate the clusters of tourism employment in rural and urban areas of the selected region. The results of spatial econometric modeling revealed the growing clusters of tourism employment in the rural areas of Australia are mostly related to operation services of tourism. In contrast the high clusters of tourism employment were found mostly associated to hospitality services of tourism. Moreover, the study explored that spatial clustering of tourism employment were influenced by six location specific factor including the availability of tourism attractions; proximity to the coast; the road density network; accessibility to employment within the Melbourne CBD; the scale of the regional economy; and the advantages and disadvantages associated with economic resources. They further argued that the clustered played important role in tourism related employment to adjacent catchment areas of tourists.
Again in a study from China, Yang et al. (2013) determined the spatiotemporal patterns of tourism growth by employing spatial statistics techniques of GIS. Strong spatial dependence of tourism activity was found in the analysis of time-based tourism data. High clusters of tourism were observed in the eastern parts while the western parts remained cold spots in terms of tourism development. The autocorrelation measurements showed a slow increase form negative value to positive one during the time. The change in the value of Moran’s I statistics revealed the spatial clustering of the tourist patterns in the region over time. With useful findings of the analysis, the study made policy suggestion for robust tourism development.
Xu et al. (2020) evaluated the effect of haze pollution on international tourist arrivals by employing spatial econometric and spatial statistics techniques. The study explored the direct and spill over impacts of haze pollution in terms of heterogeneity based on quantitative analysis. It was found that both the pollution and inbound tourist arrivals had significant association of autocorrelation and spatial spillover effects. The findings of the study revealed significant direct and spillover effect of haze pollution on the growth of inbound tourism at regional level. However, the effects were found to decrease slowly from south to north. The results suggested important policy strategies for government to control haze pollution and improve tourism.
19
In another study from Iran, Talebi et al. (2019) analyzed the road netwrok used for tourism purpose in a protected area and proposed the suitability of areas for new netwrok of roads by employing Multicriteria Dicision Making approach through GIS techniques. A fuzzy logic approach was used to standardize the map layers created in GIS environment based on different criteria of physical peoperties of the area. The resulted suitability map enabled to develop 14 diiiferent scenarios of proposed road network for the purpose of access to the area for recreational activities. All the proposed scenarios were tested according to technical, environmental, and socio-economic criteria for optimal designed road network. Later, a modified netwrok of roads was proposed based on the optimal design network and compared with the actual road network. The proposed road netwrok was identified as more suitable alternative road network.
2.4 APPLICATION OF ANN IN TOURISM
It is mentioned earlier that an Artificial Neural Network consists of various neurons which are interconnected computed units structured in different layers. Input neurons are processed under different weighted mechanisms to yield the output neurons for prediction of different variables of interest. This highly sophisticated process of relationship among different nodes and neurons helps in generating knowledge which can be organized and structured to make accurate decisions (Çuhadar et al., 2014). Thus, ANN technique can be very helpful in prediction and forecasting of different spatial and non-spatial phenomenon in reliable manner. There is growing tendency of use of ANN in tourism forecasting in recent years. Many scientific research works is available on the use of ANN in prediction and forecasting of tourist arrivals. Some of the empirical studies on tourism employing ANN modelling are discussed below.
In a study on tourism demand forecasting, Wiley (2007) compared three models of neural networks to test their performance in forecasting the tourism in more accurate term. The three neural network models used in the research namely a multi-layer perceptron, a radial basis function and an Elman network. The results of the study that multi-layer perceptron and a radial basis function models of neural network provide more accurate results in tourism demand forecasting as compared to Elman network.
20
In tourism industry, the findings of the study contribute much by providing the useful information regarding implementation of artificial intelligence for better prediction.
Hsu and Wang (2008) applied fuzzy grey model FGM(1,N) and back-propagation neural networks (BPNN) models for predicting the demand of tourism. Their research aims at providing more detailed information regarding the vulnerability of tourism demands to various fluctuations in the industry. The study used the forecast model on the travel demand for USA and Japan from Taiwan for period 1990-2003. They also applied several benchmark univariate forecasting models including the naïve method, exponential smoothing model, Holt's method, and linear regression. The findings of their study revealed the much better performance of FGM (1,N) model of neural network for more accurate prediction as compared to benchmark statistical methods of tourism demand in the selected period. The results of their study have significant potential for the management of tourism.
Moutinho et al. (2008) determined the tourism demand for Taiwan from the mainland China by employing neural network modeling technique. They used several explanatory variables of GDP, Income, Consumer Price Index, and Exchange rate to determine the demand of tourists for a period 1999-2005. Besides, the study also employed other methods of forecasting like ARIMA for comparison with neural network model. The findings of their study confirmed the accuracy of selected neural models in tourism demand forecasting as compared to other predictive methods based on traditional statistics and computer modeling.
In another study from Taiwan, Huarng, Yu, and Parellada (2011) applied fuzzy time- series model to forecast the tourism demand and determined the fluctuations in the tourist arrivals through regime switching model. They clustered the time series data of tourism into three regimes of different number of tourist arrival which were low, middle, and high. The results of the study revealed that tourism industry in Taiwan remained prosperous for the selected period 1984-2008. Only the outbreak of disease SARS caused regime switch in Taiwan’s tourism industry. Meanwhile, the outperformance of selected neural network model was confirmed for accurate prediction as compared to other methods.
21
It is argued that combination of different forecasting models yields better results as compared to single forecasting models. Moreover, combination of linear models provides better and accurate results and tested extensively in the literature. The non-linearity is not much investigated despite its importance in understanding the tourism demand. The performance analysis of different linear prediction models has been questioned by Cang (2011) after testing the nonlinear model for tourism forecast. In this study, the author proposed multilayer perceptron neural networks (MLPNN) on quarterly data of inbound tourist arrivals in United Kingdom to determine the future patterns of inbound tourism. The results of the study found the better performance in accurate prediction of tourism demand in both seasonal and semi-seasonal trends of tourist arrivals.
In a study conducted by Chen, Lai, and Yeh (2012), empirical mode decomposition (EMD) and neural network models have been tested for predicting tourism demand in Taiwan. EMD approach has applied for the purpose of decomposition of raw data into limited set of intrinsic mode functions (IMFs) and a residue. The study then employed back propagation neural network to determine the predictive values of tourist arrivals to Taiwan. It is found that the proposed model of combining the neural network model with EMD resulted in more accurate forecasting when compared to simple back propagation model.
In order to provide the detais of tourism performance competitiveness, Fernandes et al. (2013) proposed set of different models based on neural network techniues. The study evaluated the time series data of tourist arrivals in two different regions of Portugal. They used a feedforward structure model trained with backward propagation to predict the tourism demand for the year 2008 and 2009 based on the data for period 1987-2009. It was found that the selected model performed well in high accuracy of forescasting tourism demand in non linear fashion.the study further suggested the use of different other economic variables for future predicitons.
Claveria and Torra (2014) evaluated the forecasting performance of neural netwrok models in comparison to traditional statistical methods like ARIMA and SETAR methods in tourism demand for Spain. The study used annual data of tourism in
22
Catalonia region of Spain from 2001 to 2009. It was revealed that ARIMA model provided more accurate prediciton as compared to SETAR and ANN models. Besides, the study also found the better results while using total number of tourist arrivals in contrast to overnight stays. The study suggested to consider structure optimization and incorporating extra memory values to improve the performance of neural netwrok models in accurate prediciton.
In a study conducted by Saeidi et al. (2017), compared the performance of different methods in landscape aesthetic suitability mapping of Golistan region of Iran. A comparison of Criteria Evaluation (MCE), Logistic Regression (LR) and Multi-layer Perceptron (MLP) neural network was made to evaluate the accuracy in landscape aesthetic mapping performance. The spatial accuracy was determined by the use of Receiving Operator Characteristic (ROC) method. The values of ROC were found to test the high performance of selected models in landscape aesthetic mapping. It was found that Multi-Criteria Evaluation (MCE) methods with expert opinions outperformed the other methods in accurate suitability mapping.
Li and Cao (2018) compared different linear and non linear methods of tourism forecasting to find out the most suitable method for accurate prediciton. They used Long Short Term Memory Neural Network (LSTM) methods to forecast the tourism demand using the data set of tourist arrivals in important pagodas of China named Small Wild Goose Pagoda. Meanwhile, the study also performed the prediciton tests based on Auto Regressive Integrated Moving Average (ARIMA) model and Back Propagation Neural Network(BPNN) to compare with the findings of LSTM model. The results of their study revealed that LSTM model performed best in accurately predicitng the tourism demand that that of ARIMA and BPNN models. Moreover, the study also suggested to add more tourism factors like weather, tempertaure and working days for future researches.
In a recent study conducted by Gregorić and Baldigara (2020), the seasonal demand of German tourists for Crotia was caculated through implementation of augmented HEGY test of unit root and neural networks. Stationary properties of the tourist data was checked and found non-stationary in relation to zero frequency and seasonal
23
frequency. After confirming the non stationary properties, several artificial neural network model were proposed and tested to determine the tourism demand. The results of the study revealed that purchasing power and high service price played determinental role in the tourist behavior to visit Crotia. Further, the results revealed that GDP and price did not affect the tourist demand at significant level.
2.5 APPLICATION OF GIS AND ANN IN TOURISM STUDIES RELATED TO TURKEY
GIS techniques have become very popular in spatial analysis of tourism destinations for adequate management, planning and resource efficiency. There are various tools embedded in GIS which can facilitate desired analyses according to the nature of tasks. The demand for cruise tourism in İzmir, Turkey was determined by Çuhadar, Iclal, and Ceyda (2014) by comparing Multi-layer Perceptron (MLP), Radial Basis Function (RBF) and Generalized Regression neural network (GRNN) of neural netwroks. They used the monthly data of tourist arrivals for cruiseships in İzmir province of Turkey for the year 2014. RBF neural network model was found more suitable for high accuracy of tourism demand compared to MLP and GRNN models in the study. The study further suggested to use more robust models without problems related to structure failure and over training. In order to overcome the problems, the study also suggested the use of support vector machines (SVMs); rough sets; fuzzy logic; genetic algorithms (GA) and adaptive neuro-fuzzy inference system (ANFIS) for more accurate forescasting of tourism demand.
In an effort to provide more improved performance of neural network in seasonal time series forecasting in tourism, Hamzaçebi (2008) ANN structure to determine the number of input and output neurons. After the construction of model, it was tested on four real time tourism time series data. The findings of the study revealed that the proposed ANN model outperformed the traditional statistical methods of prediction. It was found that the proposed ANN model had minimal errors of forecasting tourism as compared to other methods.
Khan (2018) utilized the spatial statistics techniques to explore the spatial association of inbound and domestic tourist arrivals in provinces of Turkey. Tourism data from
24
2006 to 2016 were analyzed to measure the spatial autocorrelation statistics over the time in 81 provinces of Turkey. It was found that tourism activities had strong positive spatial association in the country. The western provinces of the country showed the high activity of tourism and thus were placed in the category of tourist hotspots. In contrast the southeastern provinces remained in the cold spots in terms of tourism development. The disparities observed in the analysis were attributed to different historical, political and most importantly physical characteristics of the regions. In addition, the study provided some useful policy suggestions in resource allocation to tourism development in priority areas. The study utilized province level data which may not depict the details of smaller spatial units.
In another study from Turkey, Kaptan Ayhan et al. (2020) applied the ELECTRE multicriteria decision analysis with GIS for determination of suitable sites for rural tourism in Yenice, Turkey. The area is divided based on natural properties including the land-use, slope, climate, geomorphology and nearness to roads and water bodies in a GIS environment. Besides, the important places of historical values have also been added in the analysis as tourist attraction to produce suitability maps of various tourist activities. After the analysis, the area has been categorized into the nine suitable locations for tourism activities in different rankings of priority. These suitability categories have been developed on three rankings of different activities of tourism including, mountaineering, trekking, and flora observation.
2.6 LITERATURE GAP
Review of the related literature has enabled us to find out the significant gap in literature, which is to be filled by the current study. In global context, most of the previous studies employing GIS have focused on the identification of tourism potential or site suitability for the development and management of tourist destinations. The findings of such studies have provided ample information on various important spatiotemporal and socioeconomic factors which play determinantal role in tourism development different areas. However, such studies have not provided detailed information about the changing patterns and trends of tourist flows which are very crucial in prediction of tourist behavior, destination images, resource allocation and management of the destination.
25
Very few studies have utilized the spatial statistics tools of GIS to determine the spatial association and dependence of tourist clusters and hotspots. Most of the previous studies employing exploratory spatial data analysis (ESDA) techniques have only focused on the determination of spatial patterns and none of them has performed further analysis to predict the future of tourism development in selected study areas. The present study has not only employed the spatial statistics techniques to identify the patterns and hotspots, but neural network modeling has also been applied to predict future sites of potential hotspots in the region. Therefore, the findings of the present study would provide more valid and authentic information regarding sustainable tourism development by combining both GIS and ANN techniques.
The analysis of literature has also revealed that despite enjoying the status of famous tourist destination in the world, there is lack of sufficient literature on spatial dimension of tourism in Turkey. A great deal of tourism literature in Turkey has focused on the economic growth of tourism and spatial dimension is often ignored. Many previous studies only analyze the tourism potential in different areas of the country and spatial dependence is seldom discussed. Therefore, the present study is aimed to fill the current literature gap and add significant amount of knowledge which would open ways for future research based on combination of GIS and ANN.
It is also found that application of ANN is only limited to tourism forecast and demand modelling employing time series data. There are very few studies which have employed the ANN technique in projecting the tourism potential of some areas. At present, according to the knowledge of researcher, no single study has employed ANN in identification or prediction of suitable locations for tourism in Turkey. Therefore, the present study would be pioneer in utilization of ANN in predicting tourist hotspots in Turkey.
26
CHAPTER 3 METHODOLOGY
This chapter provides detailed methodology involved in the present research. The present study has employed exploratory spatial data analysis (ESDA) techniques as part of spatial statistic tools provided in GIS. Spatial autocorrelation, Global Moran’s I statistics, local indicator of spatial association (LISA) and Getis Ord method of clustering and hotspot analysis have been applied in determination of spatial association and identification of hotspots related to tourism activities. Feedforward Neural Network Modelling is used for the prediction of tourist hotspots based on selected indicators.
3.1 STUDY AREA
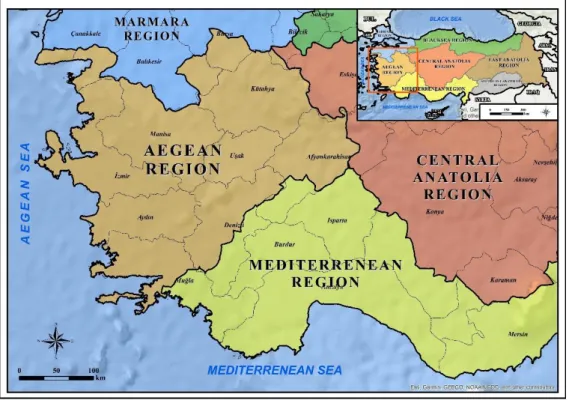
The Aegean Region is one of the major geographic regions of Turkey which lies in the western part of the country. The region derived its name from the Aegean Sea which borders in the west. In the north, lies the Marmara region, while the Mediterranean and Central Anatolian regions of Turkey are in the east and south of the Aegean region, respectively. This region has the longest coast in comparison to other coastal regions of Turkey. Administratively, the region is divided into eight provinces which are further subdivided to districts. There is total 123 districts in eight provinces of the region out of which 30 districts are included in province of İzmir, third largest province of Turkey. It is estimated that total area of the Aegean Region is approximately 90,000 km2 (Figure 3.1).
A large part of the coastal areas of the region experiences prevailing Mediterranean climates with characteristics of hot and dry summer and mild winters. The effects of prevailing coastal climate are extended towards the inland areas up to 100-150 km, after which, it gradually predominates by continental type of climate. The area has several geological fault structures which make it earthquakes prone. Mountains run perpendicular to the shore of the Aegean Sea. Streams bend formation is common. It is a region rich in geothermal resources of the energy. The population is mostly concentrated in the coastal areas gradually dispersing the inland areas. Turkey has a
27
population density above the average.Cold raids begin to be seen in the northern parts of the region. While January is the coldest month in the Aegean Region, the hottest month is July. The amount of precipitation can vary between 500-999 mm. The Aegean Region itself is an alluvial plain. The region with many plains is rich in this respect compared to many other regions.
Figure 3.1: Location map of Aegean Region of Turkey. (Source: ESRI)
Maquis is the dominant type of vegetation along with some forest areas seen in the Mediterranean Region, according to the land conditions. The vegetation cover consists of scrub in sections up to 400 meters, while the vegetation seen in areas above 400 meters is forested area. The extended coastal areas of the region attract large number of tourists for leisure activities associated to Sun, Sand and Sand (3S tourism). The region is popular destination of inbound tourists as well the domestic.
3.2 COLLECTION OF DATA
The present study has used the yearly data of domestic and inbound tourist arrivals of the Aegean Region of Turkey for 2015 to 2019. The district-level data was collected from the yearly bulletins of the Turkish Ministry of Culture and Tourism