i
CANCER TESTIS GENE EXPRESSION AS A
BIOMARKER OF ONE-CARBON METABOLIC
ACTIVITY, DRUG SENSITIVITY AND PHENOTYPIC
HETEROGENEITY IN NON-SMALL CELL LUNG
CANCER AND MALIGNANT MELANOMA
A DISSERTATION SUBMITTED TO
THE GRADUATE SCHOOL OF ENGINEERING AND SCIENCE OF BILKENT UNIVERSITY
IN PARTIAL FULFILLMENT OF THE REQUIREMENTS FOR THE DEGREE OF
DOCTOR OF PHILOSOPHY IN
MOLECULAR BIOLOGY AND GENETICS
By
Kerem Mert Şenses September 2016
ii
CANCER TESTIS GENE EXPRESSION AS A BIOMARKER OF ONE-CARBON METABOLIC ACTIVITY, DRUG SENSITIVITY AND PHENOTYPIC
HETEROGENEITY IN NON-SMALL CELL LUNG CANCER AND MALIGNANT MELANOMA
By Kerem Mert Şenses September 2016
We certify that we have read this dissertation and that in our opinion it is fully adequate, in scope and in quality, as a dissertation for the degree of Doctor of Philosophy.
________________________________ Ali Osmay Güre (Advisor)
________________________________ Özlen Konu
________________________________ Zeynep Işıl Kalaylıoğlu
________________________________ Sreeparna Banerjee
________________________________ Serkan İsmail Göktuna
Approved for the Graduate School of Engineering and Science:
___________________________ Levent Onural
iii
ABSTRACT
CANCER TESTIS GENE EXPRESSION AS A BIOMARKER OF ONE-CARBON METABOLIC ACTIVITY, DRUG SENSITIVITY AND PHENOTYPIC
HETEROGENEITY IN NON-SMALL CELL LUNG CANCER AND MALIGNANT MELANOMA
Kerem Mert ŞENSES
Ph.D. in Molecular Biology and Genetics Supervisor: Ali O. Güre
September, 2016
Expression of cancer-testis (CT) genes on X chromosome (CT-X) is restricted to tumors, with very low or no expression in normal adult tissues. CT-X gene expression is one of the factors contributing to tumor heterogeneity and is variably observed in various types of cancers including non-small cell lung cancer (NSCLC) and malignant melanoma. Regulation of CT-X gene expression has been strongly linked to DNA methylation of promoter regions, however, mechanisms leading to re-expression of these genes in tumors, driven by promoter hypomethylation, is remained unsolved. Although tumors expressing CT-X genes are shown to be associated with higher tumor stage, larger tumors and aggressiveness, differential drug sensitivity of CT-X positive and negative tumors have not been investigated. In this thesis, we aimed to find the association between one-carbon pathway polymorphisms and CT-X gene expression. Moreover, we tested various tools and methods to find effective drugs for tumors in different phenotypic subgroups determined by CT-X gene expression or by other factors.
Keywords: cancer-testis genes, DNA damage, one-carbon pathway, drug sensitivity, NSCLC, melanoma, microarray.
iv
ÖZET
KÜÇÜK HÜCRE DIŞI AKCİĞER KANSERİ VE MALİN MELANOM’DA
TEK-KARBON METABOLİK YOLAĞI AKTİVİTESİ, İLAÇ HASSASİYETİ VE FENOTİPİK HETEROJENİTE’NİN BİYO-BELİRTECİ OLARAK
KANSER-TESTİS GEN İFADESİ
Kerem Mert ŞENSES
Moleküler Biyoloji ve Genetik, Doktora Danışman: Ali O. Güre
Eylül, 2016
X kromozomu üzerinde bulunan kanser-testis (KT-X) genlerinin ifadesi tümörlerle sınırlı olup, normal yetişkin dokularında çok düşüktür veya hiç görülmez. KT-X gen ifadesi tümör heterojenitesine katkıda bulunan faktörlerden biridir ve küçük hücre dışı akciğer kanseri (KHDAK) ve malin melanom gibi birçok farklı kanser türünde değişen oranlarda görülmektedir. KT-X gene ifadesinin regülasyonu promotor bölge metilasyonu ile kuvvetlice ilişkilendirilmiş, buna karşın, promotor hipometilasyonunun neden olduğu tümörlerde sonradan ortaya çıkan KT-X geni ifade artışının altında yatan mekanizmalar henüz aydınlatılamamıştır. KT-X geni ifadesi gösteren tümörler, yüksek tümör evresi, büyük tümörler ve agresiflik ile ilişkilendirilmekle birlikte, KT-X pozitif ve KT-X negatif tümörlerdeki değişken ilaç hassasiyeti araştırılmamıştır. Bu tez çalışmasında, tek-karbon yolağı enzim polimorfizmlerinin KT-X geni ifadesi ile ilişkisi araştırılmıştır. Ayrıca, tümörlerde KT-X geni ifadesi ile birlikte farklı faktörlerin belirlediği değişik fenotipik alt gruplara karşı etkili olabilecek ilaçların belirlenebilmesi için birçok araç ve yöntem test edilmiştir.
Anahtar sözcükler: Kanser-testis genleri, DNA hasarı, tek-karbon yolağı, ilaç hassasiyeti, KHDAK, malin melanom, microarray.
v
Bu tezi, bana her zaman destek olan sevgili babam Kazım Şenses’e, öğretici ve yol gösterici tavsiyeleriyle güç ve yön bulduğum ve aynı zamanda çalıştığım alana yönelmemde en büyük katkıya sahip olan ağabeyim Kemal Yasin Şenses’e, sevgisi ve şefkatiyle bugünlere gelmemi sağlayan annem Semra Şenses’e, son olarak hayatıma varlığıyla anlam katan sevgili eşim Fatma Şenses’e adıyorum.
vi
ACKNOWLEDGEMENTS
Firstly, I would like to express my sincere gratitude to my advisor Dr. Ali Osmay Güre for the continuous support of my Ph.D study and related research, for his patience, motivation, and immense knowledge. His guidance helped me in all the time of research and writing of this thesis. I could not have imagined having a better advisor and mentor for my Ph.D study.
Besides my advisor, I would like to thank the rest of my thesis committee: Dr. Özlen Konu, Dr. Zeynep Kalaylıoğlu, Dr. Sreeparna Banerjee, and Dr. Serkan Göktuna for their insightful comments and encouragement, but also for the hard questions which incented me to widen my research from various perspectives.
My sincere thanks also goes to Murat İşbilen who helped me on analyses by writing R-based scripts used in PCA-based grouping of tumors.
I thank Akif Burak Tosun for writing the object-oriented Java application which helped us identify drugs from the DTP/NCI60 database.
I thank my fellow labmates for the stimulating discussions, for the sleepless nights we were working together before deadlines, and for all the fun we have had during the time we spent in Bilkent University. Also I thank my friends in the Department of Molecular Biology and Genetics in Bilkent University.
Last but not the least, I would like to thank my parents and my wife for supporting me spiritually throughout writing this thesis.
vii
Contents
1.1 Cancer-Testis Genes ... 1
1.1.1 Expression and regulation of cancer-testis genes ... 1
1.1.2 One-carbon metabolism and its possible impact on CT-X gene expression ... 4
1.1.3 One-carbon metabolism and DNA damage ... 11
1.2 Molecular subgroups of melanoma in relation to drug sensitivity ... 13
2.1 Materials ... 17
2.2 Methods ... 23
2.2.1 Patients, Tumor Samples and Cell Lines ... 23
2.2.1.1NSCLC Patients and Tumor Samples ... 23
2.2.1.2Cancer Cell Lines ... 23
2.2.1.3Other Cancer Cell Lines ... 24
2.2.2 Tissue Culture Procedures and Experiments ... 24
2.2.2.1Growing Conditions of Cell Lines ... 24
2.2.2.2Harvesting Cell Lines ... 25
2.2.2.3Freezing Cell Lines ... 25
2.2.2.4In vitro scratch assay ... 25
2.2.3 Extraction and Quantification of DNA and RNA from Cell Lines .... 26
2.2.3.1Genomic DNA (gDNA) Extraction from Cancer Cell Lines ... 26
1
Introduction ... 1
viii
2.2.3.2Total RNA Extraction from Adherent Cell Lines ... 27
2.2.3.3Quantification of gDNA and RNA Samples ... 28
2.2.4 SNP Genotyping ... 28
2.2.4.1SNP Genotyping with Quantitative Real Time PCR ... 28
2.2.4.2PCR-Restriction Fragment Length Polymorphism (RFLP) ... 29
2.2.5 Gene Expression Analyses... 30
2.2.5.1Complementary DNA (cDNA) Synthesis ... 30
2.2.5.2Quantitative Real Time PCR Analyses for gene expression ... 31
2.2.6 Quantification of DNA Damage in Cancer Cell Lines ... 31
2.2.6.1Single Cell Gel Electrophoresis (SCGE) Assay-Comet Assay.... 31
2.2.6.2Histone H2A.X Phosphorylation Assay by Flow Cytometry ... 36
2.2.7 In vitro drug screening analyses ... 36
2.2.7.1Treatment of cancer cell lines with single molecule inhibitors ... 36
2.2.7.2Cytotoxicity measurements and cell number quantification methods... 37
2.2.8 In silico drug screening analyses ... 37
2.2.8.1In silico drug screening analyses using NCI-60 data ... 37
2.2.8.2In silico drug screening analyses in melanoma ... 38
2.2.9 In Silico Analyses of Gene Expression... 38
2.2.9.1Microarray Gene Expression Analyses ... 38
2.2.9.2In silico association analyses of AML ... 39
2.2.9.3Generation of a heuristic fibroblast detection algorithm ... 40
ix
3.1 CT-X gene expression in different types of tumors according to in silico data .... 42 3.2 CT-X gene expression is associated with MTHFR 677 C>T polymorphism in
NSCLC ... 44 3.3 DNA damage measurements in CT-X (+) and (-) cancer cell lines ... 50 3.3.1 Measurement of alkali labile DNA damage in CT-X (+) and (-) cancer cell lines ... 50 3.3.2 Measurement of Histone H2A.X phosphorylation in CT-X (+) and (-) cancer cell lines ... 53 3.4 In silico drug screening analyses in CT-X (+) and (-) NCI-60 cancer cell lines ... 57 3.5 An approach to identify and validate effectiveness of drugs on different subgroups
of malignant melanoma ... 59 3.5.1 Identification of a melanoma gene expression signature ... 59
3.5.1.1Heuristic algorithm discriminates melanoma cells from fibroblasts 59
3.5.1.2Molecular subgrouping of melanoma ... 63 3.5.1.3Clustering of PrMCLs using the gene list generated through CCLE and CGP database analyses ... 65 3.5.1.4Clustering PrMCLs using published alternative approaches and gene lists ... 67 3.5.1.5Clustering primary melanoma cell lines using GSEA ... 70 3.5.1.6Classification of PrCMLs based on the combination of EMT, CSC and PRO-INT-INV scores ... 72 3.5.2 Validation of transcriptomic subgroups through in vitro assays ... 74
3.5.2.1Measurement of INHBA and MLANA by quantitative RT-PCR 74 3.5.2.2Measurement of proliferation in primary melanoma cell lines .... 77
x
3.5.2.3Migration capacity of PrMCLs compared to their gene expression
profiles ... 79
3.5.3 In silico drug identification using CCLE drug screening database .... 81
3.5.4 MLANA and INHBA as biomarkers of drug sensitivity in melanoma 85
4
Discussion ... 91
5
Bibliography ... 96
6
Appendix A ... 117
7
Appendix B ... 127
8
Appendix C ... 137
xi
List of Figures
Figure 1.1: Reaction scheme of SAM synthesis. ... 9
Figure 1.2: Schematic representation of one-carbon metabolism ... 10
Figure 2.1: Comet assay experimental setup... 34
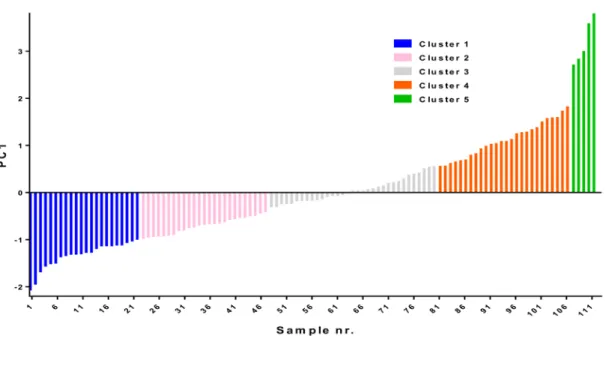
Figure 3.1: Principal component analysis based in silico clustering of AML.. ... 49
Figure 3.2: Level of DNA damage measured in sub-physiological FA. ... 52
Figure 3.3: Geometric mean of fluorescence intensity of pH2AX. ... 54
Figure 3.4: Level of H2AX phosphorylation in CT-X (+) K562 and SK-BR-3. ... 55
Figure 3.5: Level of H2AX phosphorylation in CT-X (+) K562 and SK-BR-3 ... 56
Figure 3.6: Significant drugs determined through analyses NCI-60 in silico data. ... 57
Figure 3.7: Correlation plot for fibroblast detection. ... 61
Figure 3.8: Correlation plot for fibroblast detection. ... 62
Figure 3.9: Correlation plot for fibroblast detection. ... 62
Figure 3.10: Schematic representation of the workflow. ... 64
Figure 3.11: Hierarchical clustering analysis of PrMCLs. ... 66
Figure 3.12: Comparison of CCLE and CGP derived gene list-based. ... 68
Figure 3.13: (A) Venn diagram shows distribution of numbers of genes ... 69
Figure 3.14: GSEA plots of PrMCLs from cluster A and B. ... 72
Figure 3.15: Clustering melanoma cell lines based on three molecular signatures.. ... 73
Figure 3.16: Heatmap generated by GSEA showing microarray gene expression. ... 75
Figure 3.17: Comparison of q-RT-PCR and Luminex1000 data. ... 76
xii
Figure 3.19: Proliferation measurements of primary melanoma cell lines.. ... 78
Figure 3.20: In vitro scratch assay of melanoma cell lines. ... 80
Figure 3.21: In silico cytotoxicity analyses based on EMT, CSC. ... 83
Figure 3.22: In vitro cytotoxicity analyses based on EMT, CSC... 84
Figure 3.23 Hierarchical clustering analyses of PrCMLs. ... 86
Figure 3.24: MLANA and INHBA expression plot of CCMLs and PrMCLs. ... 87
Figure 3.25: MLANA and INHBA based in silico drug sensitivity ... 89
Figure 3.26: MLANA and INHBA based in vitro drug sensitivity... 90
Figure 6.1: Expression of 49 CT-X probesets (Table 6-1) in melanoma. ... 119
Figure 6.2: Expression of 49 CT-X probesets (Table 6-1) in NSCLC. ... 120
Figure 6.3: Expression of 49 CT-X probesets (Table 6-1) in breast cancer.. ... 121
Figure 6.4: Expression of 49 CT-X probesets (Table 6-1) in ovarian cancer. ... 122
Figure 6.5 Expression of 49 CT-X probesets (Table 6-1) in CLL. ... 123
Figure 6.6 Expression of 49 CT-X probesets (Table 6-1) in Colorectal Cancer. ... 124
Figure 6.7 Expression of 49 CT-X probesets (Table 6-1) in Pancreas Cancer. ... 125
xiii
List of Tables
Table 2-1: List of instruments used during experiments ... 17
Table 2-2: List of chemicals, enzymes and kits. ... 18
Table 2-3: Primers used for q-RT-PCR analyses of MLANA and INHBA ... 22
Table 2-4: Primers used for genotyping RFC 80 G>A with PCR-RFLP ... 22
Table 2-5: Hardy-Weinberg Distributions of Single Nucleotide Polymorphisms in NSCLC Patients. ... 30
Table 2-6: Chemicals or buffers used in comet assay. ... 35
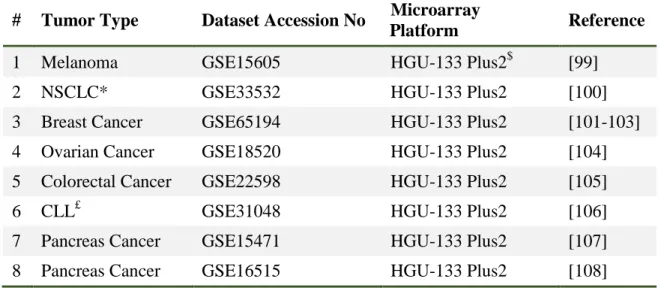
Table 2-7: Microarray datasets used to observe CT-X gene expression across tumors... 39
Table 3-1: Demographics and Clinical Characteristics of NSCLC Patients. ... 45
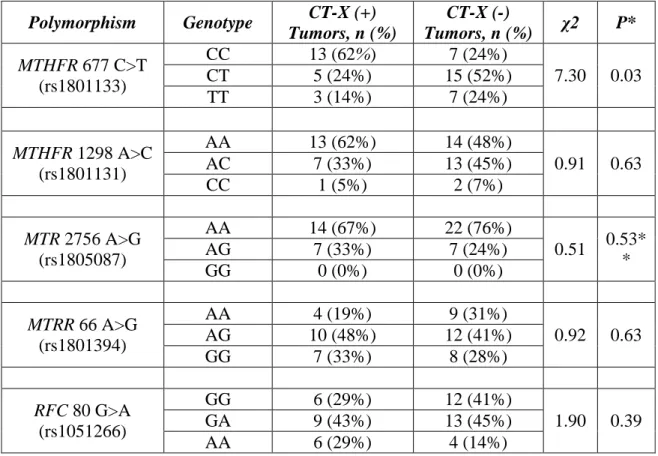
Table 3-2: Individual genotypic distribution of CT-X (+) and (-) tumors. ... 46
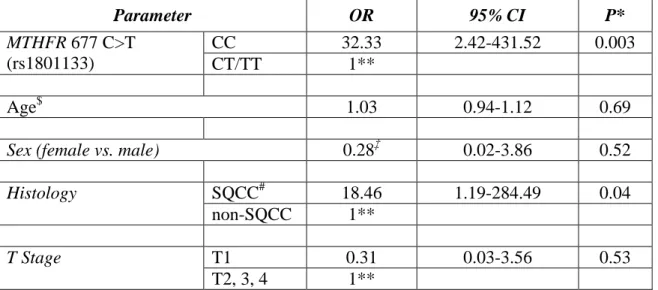
Table 3-3: Multivariate Analysis of MTHFR 677 genotypes with CT-X Gene Expression. ... 47
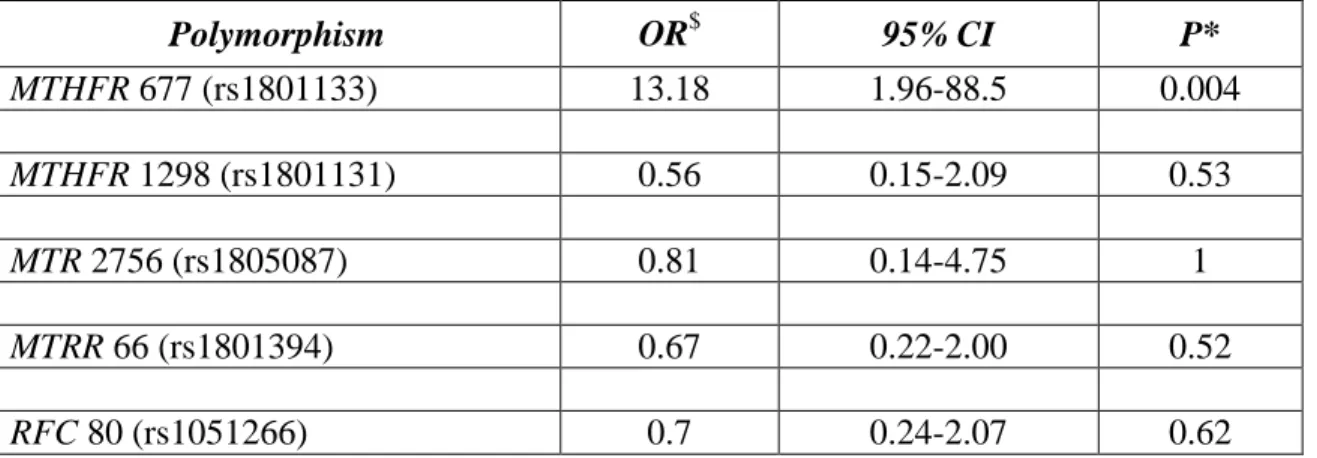
Table 3-4: Multivariate Logistic Regression Modeling of Association between CT-X Gene Expression and One-Carbon Enzyme Alleles ... 48
Table 3-5: Association Analyses of CT-X Gene Expression with MTHFR 677 Genotypes in Acute Myeloid Leukemia. ... 49
Table 3-6: Increase of pH2A.X in CT-X (-) and (+) cells upon FA deficiency and UVC treatment. ... 56
Table 3-7: Input phenotype labels for the GSEA and cluster information of primary cell lines. ... 71
xiv
Table 6-1: CT-X probesets used in microarray analyses. ... 117
Table 7-1: CT-X Gene Expression and Clinical Data of NSCLC Patients. ... 127
Table 7-2: Genotypes of NSCLC Patients. ... 129
Table 7-3: Genotypes of cell lines used in DNA damage measurement experiments. .. 132
Table 7-4: MTHFR 677 C>T Genotype Population Distributions ... 133
Table 7-5: MTHFR 1298 A>C Genotype Population Distributions ... 134
Table 7-6: MTRR 66 A>G Genotype Population Distributions ... 135
Table 7-7: MTR 2756 A>G Genotype Population Distributions ... 136
Table 7-8: RFC 80 G>A Genotype Population Distributions ... 136
Table 8-1: Probesets which define fibroblast and melanoma gene expression signature. ... 137
Table 8-2: Gene list generated for subgrouping of melanoma ... 144
Table 8-3: The most differentially expressed probe sets between cluster B vs. A in melanoma. ... 156
1
Chapter 1
1 Introduction
Introduction
1.1 Cancer-Testis Genes
1.1.1 Expression and regulation of cancer-testis genes
Expression of cancer-testis (CT) or cancer-germline genes is detectable only in testis, fetal ovaries and placenta among normal tissues. However, upon tumorigenic transformation, CT genes are reactivated in almost all tumor types with varying levels of expression. First CT gene, melanoma antigen-1 (MAGE-1) was identified in 1990 by T-cell epitope cloning [1,2]. The list of CT genes have expanded by discoveries through serological expression cloning (SEREX) and differential gene expression analyses [3]. To date, more than 140 CT genes in 70 different gene families are grouped as CT-X and non-X-CT genes where CT-X genes constituting about the half of all CT genes [4]. Although expression patterns are similar, structural and functional differences separates two groups of genes. Located exclusively on X chromosome, CT-X genes are arranged as direct or inverted repeats in multigene families. Non-X CT genes, located on autosomes, however, are mostly arranged as single-copy genes. Sequence conservation is high among members within a CT-X gene family, however, there is no homology between different CT-X gene families [5]. Even though there is no conservation across families, reactivation of almost all CT-X genes in cancer, occur simultaneously with genome-wide hypomethylation which also affects repeat sequence activation [6,7]. In support of this, treatment of cell lines with DNA methyltransferase inhibitors such as
5-2
aza-2’-deoxycytidine (5-aza-CdR), have shown to result in upregulation of all CT-X genes examined in various studies [8-12], suggesting a common epigenetic mechanism behind CT-X gene regulation. Moreover, histone acetylation has also been shown to facilitate CT-X gene expression when it occurs in parallel with DNA demethylation [7]. Treatment with Trichostatin A (TSA) - a histone deacetylase inhibitor have resulted in an increase in CT-X gene expression, although to a lesser extent when compared to treatment of DNA methyltransferase inhibitor [10,11]. On the contrary, there are exceptions for non-X CT gene upregulation by DNA methyltransferase and histone deacetylase inhibitor treatment, where 5 out of 7 non-X CT genes were failed to be upregulated by 5-aza-CdR and TSA treatment in a recently published study [12]. Other differences between CT-X and non-X CT genes include differential expression in spermatogonia cells during normal testicular germ cell development. CT-X gene expression decreases when these cells enter meiosis [13] with the help of genomic methylation [14,15], loss of Suv39h2 expression and H4 hyperacetylation [16,17]. Non-X CT genes, on the other hand, are continuously expressed during meiosis of gametes [18-20]. Furthermore, CT-X genes are found to be more antigenic than non-X CT genes and are subjected to a number of anti-tumor vaccination studies [21]. Due to these differences between two groups of CT genes, CT-X genes stands out as distinct biomarkers of regulation of gene expression, cellular differentiation and transformation.
CT-X gene expression is considerably varied across different types of tumors as well as individual samples. RT-PCR based measurements of CT-X genes revealed bladder, breast, hepatic, lung, melanoma and ovarian tumors as highly positive whereas colon, gastric, renal and blood-derived malignancies as weakly positive for CT-X gene
3
expression [22,23]. Moreover, CT-X expression was shown to be varied greatly among histological subtypes of the same tumor where number of patients with squamous subtype was significantly higher than the number of patients with adenocarcinoma of NSCLC when assessed for CT-X expression [24]. In another recent study, triple negative breast cancer (TNBC) samples had the highest level of CT-X expression among other histological subtypes of the same tumor [25].
Variable CT-X gene expression is also observable at intra-tumor or intra-tissue level such that different cells of the same tumor or tissue was shown to have different levels of CT-X gene expression. Intra-tumor heterogeneity was well documented using immunohistochemistry where MAGE-1 and NY-ESO-1 protein expression was shown to be heterogeneously distributed within NSCLC [13] and ovarian cancer [26] section photos, respectively. Even though the level of CT-X expression is greatly varied across tumors, it is well established by our group [24] and others [27] that a tumor sample positive for a CT-X gene will highly likely to be positive for more than one CT-X gene. Coordinate expression of CT-X genes might be an evidence for existence of a common mechanism behind CT-X gene regulation.
Recently, our group has been able to demonstrate dynamic regulation of CT-X genes in Caco-2 spontaneous differentiation model. This is the first report indicating that the mechanism underlying CT gene expression can be dynamically regulated and indicates which pathways might be relevant to this. During differentiation of Caco-2 cells from mesenchymal to an epithelial state (MET), expression of SPANX-B and PAGE-2B increase together with Ten-eleven translocation-2 (TET2) and 5-hydroxymethylated (5hmC) DNA. This correlates with detachment of EZ2H and HP-1
4
from the promoters of these genes. When MET is reversed to epithelial-to-mesenchymal transition (EMT) in this model, downregulation of both CT-X genes was observed, together with the reversal of all molecular mechanisms involved [28]. Although this model indicates a link between EMT and CT gene expression, it can not fully explain why some highly epithelial tumors remain CT-negative; suggesting the presence of other yet unidentified mechanisms involved in CT gene expression regulation.
1.1.2 One-carbon metabolism and its possible impact on CT-X gene
expression
Despite the presence of common epigenetic mechanisms controlling CT-X gene expression, there is no consensus on why some tumors or tumor cells express CT-X genes and some do not. We hypothesized that a reason for this discrepancy could be the differential S-adenosylmethionine (SAM) production rates of cells, which is the sole methyl donor for all cellular methylation reactions. One of the main research aims of this thesis was to address this question by subgrouping NSCLC tumor samples based on genetic markers of one-carbon pathway enzymes that are known to affect SAM production rates, which in turn could possibly have impact on CT-X gene expression.
Folate, an essential vitamin supplemented especially in vegetables, fruits and grains, is a one-carbon source for DNA, RNA and protein synthesis as well as methylation and maintenance of various biomolecules. One-carbon molecules of folate is utilized by the enzymes of one-carbon metabolism for the de novo synthesis of purines and pyrimidines as well as the synthesis of SAM [29]. Biological methylation reactions of phospholipids, neurotransmitters, proteins, DNA, RNA, and other small
5
molecules are catalyzed by the transfer of a methyl group from SAM, the only known methyl donor in the cell. Therefore, maintaining intracellular SAM levels is crucial for the tightly controlled cellular processes such as control of gene expression, DNA methylation and DNA repair in normal physiology. SAM levels were shown to be affected by inadequate intake of folate or the inefficient catalytic capacity of polymorphic enzyme variants of the one-carbon metabolism. A recent study has been shown that methyl-deficient diet resulted in significantly reduced levels of SAM and significantly decreased ratio of SAM/S-adenosyl homocysteine (SAH; the more stable by-product of SAM) where both events were concurrent with increased global DNA hypomethylation in rats [30]. Independent from folate absorption, SAM levels have been shown to be affected directly or indirectly by fluctuations in activities of certain enzymes which are responsible for the production of one-carbon derivatives [31-43]. Since CT-X gene expression occurs in parallel with global DNA hypomethylation and promoter-specific demethylation, inadequate SAM production may facilitate the coordinate upregulation of many CT-X genes in cancer.
Synthesis of SAM starts with intracellular transport of folate controlled by three different proteins; folate receptor (FR), reduced folate carrier (RFC) and proton-coupled folate transporter (PCFT). RFC and PCFT are members of solute carrier superfamily, which are distinguished from FR by the ability to transport folate by ion exchange gradient. FR, on the other hand, internalizes and transports folate in a receptor-mediated endocytic process [44]. RFC-1, the gene encoding RFC transmembrane protein, harbors a common non-synonymous polymorphism (RFC 80G>A, dbSNP ID: rs1051266) which results in the change of arginine to histidine at the 27th amino acid position. This
6
polymorphism have been associated with moderately increased plasma folate concentration [32], suggesting an impaired intake of folate from serum. Intracellular transport of folate is followed by its rapid reduction to dihydrofolate (DHF) and subsequently to tetrahydrofolate (THF) by dihydrofolate reductase (DHRF) which catalyzes the entrance of folate into 1-carbon pools. THF is important for the synthesis of THF polyglutamate derivatives catalyzed by folylpolyglutamate synthetase (FPGS). These folate polyglutamate molecules serve as one-carbon donors in one-carbon transfer reactions when they are associated with methyl, formyl or methylene one-carbon moieties at the N5 and/or N10 positions [44]. Alternatively, vitamin B6-dependent serine hydroxymethyltransferase (SHMT) directly converts THF to N5-N10-methylene-THF [45] which is subsequently catalyzed by thymidylate synthase (TS) by transferring a one-carbon group from N5-N10-methylene-THF to deoxyuridylate for thymidylate synthesis. TS transfers the one-carbon group rapidly and irreversibly, resulting in oxidation of THF to DHF. Thymidylate synthesis has the potential to deplete cellular N5-N10-methylene-THF pools, however, DHFR rapidly reduces DHF to THF to maintain the flow of one-carbon moieties [44]. Therefore, maintaining level of N5-N10 -methylene-THF is critical for thymidylate synthesis in the cell. N5-N10-methylene-THF levels are also critical for the production of N5-methyl-THF, the predominant form of folate in blood used in vitamin B-12 dependent remethylation of homocysteine (Hcy) to methionine [45]. N5-methyl-THF is the only one-carbon source for methionine and SAM biosynthesis, thus concentration of N5-methyl-THF is thought to be the limiting factor for the synthesis for both metabolites [46]. One of the major factors affecting N5 -methyl-THF concentration is the activity of N5-N10-methylene-THF reductase
7
(MTHFR) enzyme which catalyzes the reduction of N5-N10-methylene-THF to N5 -methyl-THF. Importance of MTHFR enzyme for one-carbon metabolism was emphasized in two separate studies where transgenic mice lacking exon 3 of mouse orthologue MTHFR (designated as MTHFR-deficient) was evaluated for plasma total Hcy, N5-methyl-THF, SAM, SAH and DNA hypomethylation levels. One of these studies have shown that mice heterozygous or homozygous for MTHFR deficiency had significantly higher total plasma Hcy and lower N5-methyl-THF levels compared to wildtype littermates where the latter metabolite was evaluated for both brain and liver tissues. Furthermore, MTHFR-deficient homozygous mice have been reported to die within the first five weeks of life [47]. In both studies, MTHFR-deficient mice exhibited significantly reduced levels of SAM, significantly increased levels of SAH and significantly increased level of [3H]dCTP incorporation, indicative of increased global DNA hypomethylation [47,48].
Two common non-synonymous polymorphisms in the human MTHFR gene (MTHFR 677 C>T and MTFHR 1298 A>C) have been shown to result in comparable phenotypes with MTHFR-deficient mice. MTHFR 677 C>T polymorphism (dbSNP ID: rs1801133), located within the N-terminal catalytic domain, changes the protein amino acid sequence from the 222nd alanine to a valine [40]. This polymorphism have been associated with increased thermolability [35], reduced enzymatic activity [35,49,50], increased plasma Hcy [32,35,43,49-54], increased DNA hypomethylation [43,54,55], and decreased plasma folate [32,43,49,52-54,56] levels in numerous studies. The second most common polymorphism in MTHFR gene, MTFHR 1298 A>C (dbSNP ID: rs1801131) changes the protein sequence from 429th glutamate (E, Glu) to alanine (A,
8
Ala). When compared with MTFHR 677 C>T polymorphism, the effect of MTFHR 1298 A>C is limited on phenotype, where no significant difference was detected in plasma Hcy [50,53], plasma folate [43,53] and DNA hypomethylation [43,55] levels between individuals with MTFHR 1298 A/A versus C/C genotype in several studies. Only in one study, plasma Hcy levels were significantly increased in MTFHR 1298 C/C genotype (at the p < 0.05 level) compared with MTFHR 1298 A/A individuals [43]. Although the effect of MTHFR 1298 A>C polymorphism is limited on phenotype when assessed alone, combined heterozygosity for both MTHFR 677 C>T and MTHFR 1298 A>C polymorphisms have been shown to express similar phenotype with that of MTHFR 677 TT homozygote individuals [53,57].
The flow of one-carbon moieties in one-carbon metabolism continue as methionine synthase (MS), a methylcobalamin (vitamin B-12)-dependent enzyme encoded by the MTR gene, converts N5-methyl-THF into THF by transferring a methyl group to Hcy which results in the formation of methionine. Subsequently, methionine adenosyltransferase (MAT) transfers the adenosyl portion of ATP to methionine for SAM synthesis (Figure 1.1). Upon remethylation of Hcy to methionine, the active cobalamin (I) MS [or Cbl (I) MTR] complex, is oxidized to inactive form, Cbl (II) MS. Methionine synthase reductase (MSR), encoded by the MTRR gene, reactivates Cbl (II) MS complex by a methyl group transfer from SAM, a process known as reductive methylation [58].
9
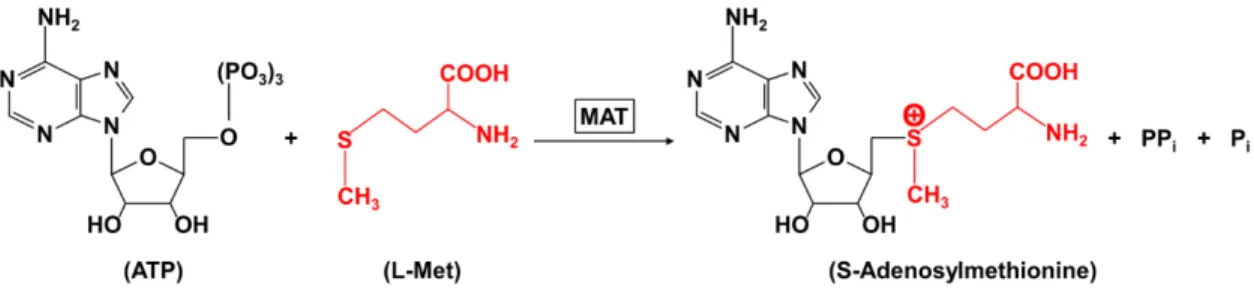
Figure 1.1: Reaction scheme of SAM synthesis. Synthesis of SAM (also referred as AdoMet) is catalyzed by methionine adenosyltransferase (MAT or AdoMet synthetase) by covalently attaching an adenosyl group from ATP with sulphur atom of methionine generating a sulphonium bond between the 5-carbon atom of the ribose (of ATP) and the sulphur atom of the methionine amino acid (L-Met) resulting in highly energetic SAM molecule [59].
Enzymatic activity of MS and MSR enzymes are influenced by two different non-synonymous polymorphisms; MTR 2756 A>G (dbSNP ID: rs1805087) and MTRR 66 A>G (dbSNP ID: rs1801394) changing 919th aspartic acid (D, Asp) to glycine (G, Gly) of MS and 22nd isoleucine (I, Ile) to methionine (M, Met) of MSR, respectively. Primary tumor samples harboring the less common MTR 2756 G/G genotype have been associated with decreased CpG island methylation compared to MTR 2756 A/A genotype [55] emphasizing the indirect but eminent role of MS on SAM production. Secondly, the variant G allele of MSR enzyme have been associated with 75% reduced in vitro enzymatic activity measured by the molar amount of MSR required for maximal activation of MS [38]. Therefore, it can be speculated that, the variant alleles of both MTR and MTRR genes may lead to impaired access for SAM which is utilized as the only cofactor in DNA methylation reactions.
Even though, diverse one-carbon donors are produced in one-carbon pathway reactions, high level of intermingling between these metabolic reactions ultimately
10
affect intracellular SAM concentrations directly or indirectly, resulting in a complex interplay between bio-processes such as DNA methylation, gene expression regulation, maintenance of DNA integrity and DNA synthesis. Here, it was hypothesized that tumors with hypoactive one-carbon pathway due to polymorphisms on critical enzymes, will result in expressing CT-X genes due to inefficient utilization of folate for the production of the sole methyl donor SAM.
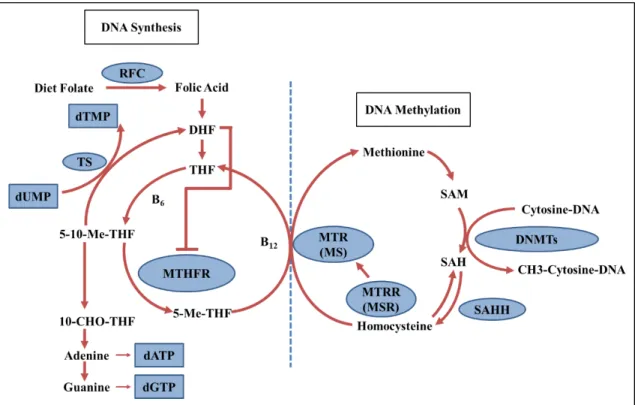
Figure 1.2: Schematic representation of one-carbon metabolism related with DNA synthesis and DNA methylation reactions. Abbreviations: RFC, reduced folate carrier; dUMP, deooxyuridine monophosphate; dTMP, thymidine monophosphate; dATP, deoxyadenosine triphosphate; dGTP, deoxyguasonosine triphosphosphate; TS, thymidylate synthase; DHF, dihydrofolate; THF, tetrahydrofolate; 5-10-Me-THF, N5 -N10-methylene-THF, 5-Me-THF, N5-methyl-THF; 10-CHO-THF, N10-formyl-THF; MTHFR, methylenetetrahydrofolate reductase; MS, methionine synthase; MSR, methionine synthase reductase; SAM, S adenosylmethionine; SAH, S-adensylhomocysteine; SAHH, SAH Hydrolase; DNMTs, DNA Methyltransferases. Adopted from [60].
11
1.1.3 One-carbon metabolism and DNA damage
One-carbon metabolism is critical for maintaining physiological levels of purines and pyrimidines. Adequate levels of purines and pyrimidines are required for the synthesis and maintenance of DNA, therefore efficient repair of DNA damage is dependent on the efficient utilization of purines and pyrimidines through DNA damage-repair proteins. Since dTMP is synthesized by the transfer of a methyl group from N5-N10 -methylene-THF to dUMP, deficiency in folate transport or decreased levels of N5-N10 -methylene-THF as a consequence of decreased one-carbon metabolic activity results in dUMP accumulation, leading to misincorporated uracil in DNA [61]. If not removed by DNA glycosylase, misincorporated uracil results in single or double stranded DNA breaks, chromosome breakage and micronuclei formation [62]. Transfer of one-carbon units from folate is also required for the synthesis of purine ring from N10-formyl-THF [63]. Decreased purine biosynthesis is linked to decreased folate availability as well as decreased enzymatic activity of methylenetetrahydrofolate dehydrogenase (MTHFD1) which in turn reduces availability of purines during DNA synthesis and repair [64,65]. Apart from the direct effect of folate deficiency and decreased one-carbon metabolic activity, DNA damage have been shown to be induced by DNA demethylation during primordial germ cell (PGC) development in mice. Mouse PGCs have been shown to accumulate single strand breaks and activate base excision repair (BER) during epigenetic reprogramming events such as changes in nuclear architecture driven by genome-wide active DNA demethylation [66]. Since DNA demethylation, the main control mechanism of CT-X gene expression, leads to increased DNA damage in PGCs,
12
it can be speculated that upregulation of CT-X gene expression can be an indicative of increased DNA damage in tumor cells.
In this thesis, association between polymorphisms of the one-carbon pathway enzymes (detailed in section 1.1.2) and CT-X gene expression was investigated in NSCLC with the aim of making a link between regulation of CT-X gene expression and SAM availability. Because folate metabolism is an important determinant of efficient DNA synthesis and repair, level of DNA damage in CT-X positive [CT-X (+)] and negative [CT-X (-)] cancer cell lines was also investigated.
Clinical features such as increased aggressiveness, poor prognosis and higher stage, which were previously associated with CT-X expression, might be indicative of differential drug sensitivity in CT-X (+) and (-) tumors. Therefore, using NCI-60 in silico drug screening and gene expression data, effectiveness of chemotherapeutic agents as well as single molecule inhibitors on CT-X (+) and (-) cancer cell lines was investigated.
13
1.2 Molecular subgroups of melanoma in relation to drug sensitivity
Although increased CT-X gene expression associates with worse outcome in several tumors undergoing conventional treatment, it can be an indicator of better outcome if specific therapeutic strategies, such as autologous vaccination, are to be used [67]. As CT-X expression is also related to EMT, and the fact that its expression is related to differential clinical outcome, determination of molecular markers in addition to CT-X gene expression might be informative for differential drug sensitivity. We chose to use melanoma as a model to test various markers for drug sensitivity as a large percentage of samples from this tumor are known to express CT-X genes, and because we were able to study a precious primary cell line culture obtained from melanoma patients.
Melanoma is the 7th most common malignancy after breast, lung, prostate, colon, lymphoma and bladder cancer with estimated 76,380 new cases in USA by the end of year 2016 [68]. For the early stage of disease, 5-year survival rate is 92% [69], however, median survival for stage IV metastatic melanoma is less than 1 year and 5-year survival rate is less than 10% [70,71].
Melanoma exhibits extensive inter- and intra-individual heterogeneity in which genomic and transcriptomic landscape substantially contributes to therapy resistance [72]. Perturbations in MAPK-ERK pathway is common in melanoma as a result of genetic alterations reported for oncogenes such as BRAF, NRAS and MAP2K1. BRAF V600E, the most predominant mutation in melanoma, was reported in 40% of a primary melanoma cohort, while only 15% of the same cohort was reported to be mutant for NRAS [73]. Intriguingly, a recent study have shown that melanomas wild-type for
14
BRAF and NRAS had higher mutation loads compared to patients carrying a mutation on either oncogene [74], which emphasizes the complex heterogeneity of melanoma. Furthermore, BRAF mutation is not a prerequisite for melanogenesis where benign nevi have shown to be mutant for BRAF at a high frequency. Additional genetic aberrations such as deletions or loss-of-function (LOF) mutations in genes involved in cell cycle control (CDKN2Ap16, TP53, BAP1, and PTEN) or copy number gain of transcription factors (MITF, MYC and ETV1) are necessary for melanogenesis (reviewed by Shtivelman et al., 2014 [75]). The complex interplay between different genomic events contributes to inextricable phenotypic heterogeneity of melanoma.
In addition to studies of genomic landscape in melanoma, molecular subgroups based on transcription is subjected to extensive research. Next generation RNA sequencing (NGS) have recently provided considerable advantage over microarray-based approaches, however, most of the transcriptomic signature studies on melanoma have been published using diverse microarray platforms. Studies which have reported gene expression profiles associated with melanoma prognosis have shown limited overlap between each other where only two biomarkers, MHC-II and osteopontin were common in two independent studies among 14 different studies. Hence, a commercial kit for clinical use in melanoma such as the clinically approved Agendia Mammaprint used for the prognostic evaluation of breast carcinoma patients, is still lacking. The reasons for sparsity of prognostic biomarkers in melanoma are listed by Tremante, 2012 [76] as; i) technical difficulties in extracting pure melanoma cells from the site of lesion and low level of availability for tumor material in array-based testing, ii) lack of association between genetic and transcriptional signatures (e.g., BRAFV600E mutation
15
is not correlated with any gene expression signature studied to date), iii) low level of molecular differences between normal melanocytes and malignant melanoma cells, and iv) lack of consensus for a melanoma stem-cell signature.
Melanoma cells show transcriptome based heterogeneity when studied in vitro, and this is important as it has been shown to correlate with drug sensitivity [77]. Thus, complete cure of melanoma might have to be pursued from two arms, one based on in vivo effects and therefore the microenvironment of the tumor cells and the other based on in vitro defined mechanisms related to drug sensitivity. Switching between phenotypes has been observed for melanoma in vivo, as well as in vitro, and can result in altered drug sensitivity, irrespective of mutational status for melanoma cells [78,79] suggesting that a combination treatment consisting of two drugs affecting each one of the two phenotypes might be ultimately necessary for efficient tumor eradication.
Drug resistance has traditionally been associated with a stem-cell-like phenotype and a more mesenchymal state, as compared to an epithelial one in almost all tumors. The “stemness” of melanoma cells is thought to exist in a dynamic state as melanoma cells with stem-cell markers have been reported to arise from cells lacking these markers, stem-cell like melanoma cells might not be required for tumor initiation, and the stem and non-stem-cell phenotypes can switch dynamically [80,81]. Similar to the plasticity reported for stemness in melanoma, epithelial-to-mesenchymal transition (EMT) has also been implied as a factor driving metastasis and causing drug resistance in melanoma [82,83]. Thirdly, melanoma specific in vitro analyses aiming primarily to explain differing metastatic potential generated gene lists that could robustly classify
16
melanoma cell lines or tumor cells into either a “proliferative” or an “invasive” character [84-86]; and switching among these phenotypes was shown as well [78,81].
Metastasis, drug resistance and invasion have all been attributed both to the stem cell phenotype, as well as to EMT and have been observed in those classes defined by various researchers for melanoma. In this study we asked if there was overlap between melanoma cells classified by these various signatures and one that would be based on CT-X gene expression, and if such melanoma subtypes would have unique responses to targeted therapy. We also aimed the identification of a minimum number of biomarkers that could help classify melanoma subtypes with differing drug sensitivity profiles.
17
Chapter 2
2 Materials and Methods
Materials and Methods
2.1 Materials
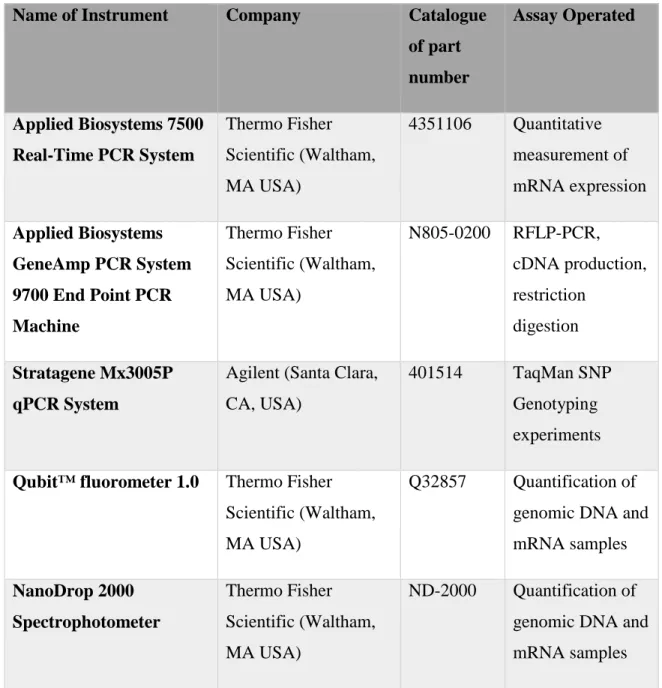
Table 2-1: List of instruments used during experiments
Name of Instrument Company Catalogue
of part number Assay Operated Applied Biosystems 7500 Real-Time PCR System Thermo Fisher Scientific (Waltham, MA USA) 4351106 Quantitative measurement of mRNA expression Applied Biosystems GeneAmp PCR System 9700 End Point PCR Machine Thermo Fisher Scientific (Waltham, MA USA) N805-0200 RFLP-PCR, cDNA production, restriction digestion Stratagene Mx3005P qPCR System
Agilent (Santa Clara, CA, USA)
401514 TaqMan SNP Genotyping experiments
Qubit™ fluorometer 1.0 Thermo Fisher Scientific (Waltham, MA USA)
Q32857 Quantification of genomic DNA and mRNA samples NanoDrop 2000 Spectrophotometer Thermo Fisher Scientific (Waltham, MA USA) ND-2000 Quantification of genomic DNA and mRNA samples
18
Centrifuge 5810 R Eppendorf (Hamburg, GERMANY)
5810R RNA, DNA
extractions, cell pelleting
XCell SureLock™ Mini-Cell Electrophoresis System
Life Sciences (CA, USA) EI0001 RFLP-PCR PAGE AxioCam MRc5 image capture device Carl Zeiss (Oberkochen, GERMANY) Visualization of comet slides
Ultraviolet Crosslinker UVP, LLC (Upland, CA, USA)
CL-1000 Inducing DNA double strand breaks for H2AX phosphorylation assay
Table 2-2: List of chemicals, enzymes and kits.
Name Catalog or part
number
Company Used in
Experiment
TRIzol reagent 15596018 Ambion by Life
Sciences (CA, USA) Total RNA extraction Chloroform 372978 Sigma-Aldrich Chemie GmbH (Taufkirchen Germany) Genomic DNA, total RNA extraction Phenol: Chloroform: IAA, 25:24:1, pH 6.6
AM9730 Ambion by Life
Sciences (CA, USA)
Genomic DNA extraction
Proteinase K P2308 Sigma Aldrich (St.
Louis, USA)
Genomic DNA extraction
19
Nuclease free water
AM9930 Ambion by Life
Sciences (CA, USA) Various experiments DNA-free™ Kit DNase Treatment and Removal Reagents
AM1906 Ambion by Life
Sciences (CA, USA)
Removal of DNA from total RNA extracts High-Capacity cDNA Reverse Transcription Kits 4368814 Thermo Fisher Scientific (Waltham, MA USA) cDNA production DyNAzyme II DNA Polymerase # F-501S Thermo Fisher Scientific (Waltham, MA USA) End point PCR
OneTaq Hot Start DNA Polymerase M0481S New England BioLabs Inc. End point PCR SYBR® Green PCR Master Mix 4309155 Applied Biosystems by Life Sciences (CA, USA) Quantitative measurement of mRNA expression TaqMan® Genotyping Master Mix 4371355 Applied Biosystems by Life Sciences (CA, USA) TaqMan SNP genotyping experiments TaqMan® SNP Genotyping Assays, MTHFR 677 C>T 4351376 (assay ID: C___1202883_20) Applied Biosystems by Life Sciences (CA, USA) TaqMan SNP genotyping experiments TaqMan® SNP Genotyping Assays, MTHFR 1298 A>C 4351376 (assay ID: C____850486_20) Applied Biosystems by Life Sciences (CA, USA) TaqMan SNP genotyping experiments TaqMan® SNP Genotyping Assays, MTR 2756 A>G 4351376 (assay ID: C__12005959_10) Applied Biosystems by Life Sciences (CA, USA) TaqMan SNP genotyping experiments TaqMan® SNP Genotyping Assays, MTRR 66 A>G 4351376 (assay ID: C___3068176_10) Applied Biosystems by Life Sciences (CA, USA) TaqMan SNP genotyping experiments
20
HinP1I R0124S New England
Biolabs,
Hertfordshire, UK
PCR- RFLP of RFC G80A
polymorphism
HinF1I R0155S New England
Biolabs,
Hertfordshire, UK
PCR- RFLP of MTHFR C677T polymorphism
MboII R0148S New England
Biolabs,
Hertfordshire, UK
PCR- RFLP of MTHFR A1298C polymorphism
Nde1 R0111S New England
Biolabs,
Hertfordshire, UK
PCR- RFLP of MTRR G66A polymorphism
HaeII R0108S New England
Biolabs,
Hertfordshire, UK
PCR- RFLP of MTR A2756G polymorphism
Novex® TBE Gels, 10%, 15 well
EC62755BOX Thermo Fisher Scientific (Waltham, MA USA)
Separation of PCR-RFLP fragments
AGAROSE GEL HS-8000 PRONA BASICA
LE Agarose gel electrophoresis Quant-iT™ dsDNA HS Assay Kits Q33120 Thermo Fisher Scientific (Waltham, MA USA) Quantification of genomic DNA Quant-iT™ RNA Assay Kit Q33140 Thermo Fisher Scientific (Waltham, MA USA) Quantification of total RNA CellTiter-Glo® Luminescent Cell Viability Assay G7572 Promega (Madison WI, USA) Quantification of cytotoxicity and proliferation CyQUANT® Cell Proliferation Assay Kit C7026 Thermo Fisher Scientific (Waltham, MA USA) Quantification of cytotoxicity and proliferation Saracatinib (AZD0530) S1006 Selleck Chemicals (Houston, TX, USA) In vitro drug screening
21 Selumetinib (AZD6244) S1008 Selleck Chemicals (Houston, TX, USA) In vitro drug screening 17-AAG (Tanespimycin) S1141 Selleck Chemicals (Houston, TX, USA) In vitro drug screening DMSO (Dimethyl sulfoxide)
A3672,0100 AppliChem MO, USA Drug solvent, cryopreservation of cell lines H2A.X Phosphorylation Assay Kit (Flow Cytometry)
17-344 MILLIPORE
(Temecula, CA)
Measurement of DNA double strand breaks
Recombinant Human/Mouse/Rat Activin A
338-AC-010 R & D SYSTEMS (Minneapolis, MN, USA) INHBA treatment experiments RPMI 1640 medium F 1215 Biochrom AG (Berlin, Germany) Tissue culture applications RPMI 1640 medium, no folic acid 27016021 GIBCO- Thermo Fisher Scientific (Waltham, MA, USA) Culturing of cancer cell lines for comet assay Dialyzed Fetal Bovine Serum 26400044 GIBCO- Thermo Fisher Scientific (Waltham, MA, USA) Culturing of cancer cell lines for comet assay
Folic acid F7876-1G Sigma-Aldrich
Chemie GmbH (Taufkirchen Germany)
Culturing of cancer cell lines for comet assay FBS, ORIGIN: AUSTRALIA S 0415 Biochrom AG (Berlin, Germany) Tissue culture applications
DMEM medium FG 0415 Biochrom AG
(Berlin, Germany)
Tissue culture applications
Trypsin-EDTA CC-5012 Lonza (Basel,
Switzerland)
Tissue culture applications
L-Glutamine 17-605E Lonza (Basel,
Switzerland)
Tissue culture applications
22
Streptomycin Switzerland) applications
Table 2-3: Primers used for q-RT-PCR analyses of MLANA and INHBA
Primer Name Sequence Product Length (bp*) Tm (⁰C)
GAPDH F 5’-GGAGCGAGATCCCTCCAAAAT-3’ 101 64 GAPDH R 5’-GGCTGTTGTCATACTTCTCATGG -3’ 64 MLANA F 5’-CAGCCGTGGTGTAAGAGTGG -3’ 108 60 MLANA R 5’-ATTAAGGAAGGTGTCCTGTGCC -3’ 61 INHBA F 5’-GAAGAGCCAGACTTCTGCACG -3’ 100 62 INHBA R 5’-GTTTGCCGAGTCAGGAACAGC -3’ 61 *bp, base pairs
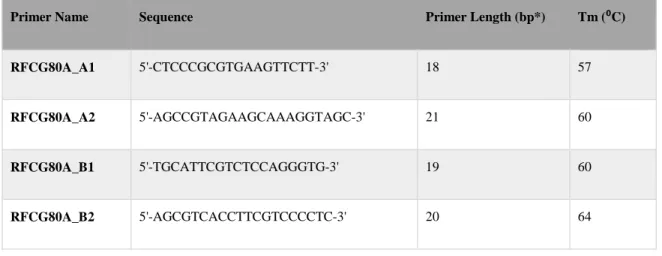
Table 2-4: Primers used for genotyping RFC 80 G>A with PCR-RFLP
Primer Name Sequence Primer Length (bp*) Tm (⁰C)
RFCG80A_A1 5'-CTCCCGCGTGAAGTTCTT-3' 18 57
RFCG80A_A2 5'-AGCCGTAGAAGCAAAGGTAGC-3' 21 60
RFCG80A_B1 5'-TGCATTCGTCTCCAGGGTG-3' 19 60
RFCG80A_B2 5'-AGCGTCACCTTCGTCCCCTC-3' 20 64
23
2.2 Methods
2.2.1 Patients, Tumor Samples and Cell Lines
2.2.1.1 NSCLC Patients and Tumor Samples
Tumor samples (n = 763) were obtained from primary NSCLC patients undergoing curative surgical resection between 1991 to July 2005 at the Department of Cardio-Thoracic Surgery, Weill Medical College of Cornell University. Informed consent which was approved by the Institutional Review Board of Weill Medical College of Cornell University, was obtained from all patients. Tumors for genotyping studies were selected by semi-quantitative PCR and the criteria was based on evaluation for the presence of transcripts from 9 different CT-X genes (A1, A3, MAGE-A4, MAGE-A10, CT-7, NY-ESO-1, LAGE-1, SSX2, and SSX4). Tumor samples having expression in at least 4 CT-X genes out of 9 or with strong expression in one CT-X gene was considered as CT-X (+) (n = 21). Tumors with no expression in 9 of the CT-X genes profiled were considered as CT-X (-) (n = 29, see Appendix B-Table 7-1 for details). CT-X gene positivity was determined in three levels; strong (+++), intermediate (++), weak (+ or +/-), or none (-), as described previously [24]. 12% of patients had no clinical data.
2.2.1.2 Cancer Cell Lines
Primary melanoma cell lines (PrMCLs) were generated as described in a previous study [67] and were a kind gift from Prof. Michal Lotem, Hadassah Medical Center,
24
Jerusalem, Israel. All cell lines (primary and commercial) were incubated in humidified incubators supplied with 5% CO2 and cultured in RPMI1640 medium supplemented with 10% FBS, 1% 10K/10K Penicillin-Streptomycin (P/S Solution, Lonza, Basel, Switzerland) and 1% 200mM LGlutamine (L-Glu, Lonza, Basel, Switzerland).
2.2.1.3 Other Cancer Cell Lines
Cancer cell lines used throughout the thesis were: SLC-17, COLO-205, SW-620, K-562 and SK-BR-3.
2.2.2 Tissue Culture Procedures and Experiments
2.2.2.1 Growing Conditions of Cell Lines
All commercial and primary cell lines were grown in complete RPMI-1640 (Lonza, Basel, Switzerland) medium consisted of 10% Fetal Bovine Serum (FBS) (GIBCO, Thermo Fisher Scientific, Waltham, MA, USA), 1% 10K/10K Penicillin-Streptomycin (P/S, Lonza, Basel, Switzerland) and 1% 200mM L-Glutamine (L-Glu, Lonza, Basel, Switzerland). All reagents were sterile filtered before supplementing into RPMI1640 bottles. Reagents for tissue culturing were stored based on manufacturers’ recommendations. All cell lines and reagents were routinely tested for mycoplasma contamination using MycoAlert™ Mycoplasma Detection Kit (Lonza, Basel, Switzerland). Cultures positive for mycoplasma contamination were immediately discarded if not, treated with MycoZap™ Reagent (Lonza, Basel, Switzerland) according to manufacturer’s instructions.
25
2.2.2.2 Harvesting Cell Lines
For adherent cell lines, growth media was removed from tissue culture flasks. Flask surface was washed with 5 mL 1 X PBS (phosphate buffered saline). Cells were detached using 1 mL of Trypsin-EDTA® (Lonza, Basel, Switzerland). Trypsin-EDTA solution was quenched by adding 3 mL of FBS containing RPMI-1640 media. Cell suspension was resuspended in 15 ml falcon and pelleted at 1000 rpm for 3 minutes. For non-adherent cell lines, cells were harvested directly from tissue culture flasks into 15 mL falcons. Cells were then pelleted at 1000 rpm for 3 minutes.
2.2.2.3 Freezing Cell Lines
Cell pellet was gently mixed with 90% FBS + 10% DMSO (Dimethyl sulfoxide, AppliChem MO, USA) solution and transferred into cryovials (Greiner Bio One, Kremsmünster, Austria). Cryovials were gradually frozen in -20⁰C for 1h, then in -80⁰C for 24 hours followed by indefinite storage in liquid nitrogen (-170⁰C). All cryovials were stored in cryogenic storage boxes (USA Scientific, Ocala, FL, USA) which were stored in liquid nitrogen tank (Thermo Fisher Scientific, Waltham, MA, USA).
2.2.2.4 In vitro scratch assay
In vitro migration of melanoma cell lines were measured by in vitro scratch assay as previously described [87]. Cell lines were grown in six-well plates in normal growing conditions (see section 2.2.2.1) until the day of scrape (wound) formation with a 1000µL pipette tip. After scratch is created on cell layer, old complete media was removed and cells were gently washed with 1X PBS for the removal of remaining
26
serum. Two parallel lines are drawn ~2-3mm apart each other on the outer surface of every well of six-well plate which crosses the scratch with 90 degrees for generating a reference point for photographing the wound in different time intervals. In order to reduce the effect of proliferation on wound closure, cells were cultured in 1% FBS (instead of 10%) containing RPMI-1640 supplemented with 1% P/S and 1% L-Glu for the following days of the assay. Three different wounds in three different wells were photographed for all cell lines (except M187; only two photos were captured due to technical problems) and time intervals (0h, 24h and 48h). Remaining scratch area was measured for all images by the GIMP v2.8 Image Processing software. Briefly, all the scratch areas in all time intervals were measured by manually selecting scratch area with the software’s “free select tool” and then following “Windows Dockable Dialogs Histogram” menu to make the software calculate pixel count for the selected area. Pixel count numeric value was considered as the area of that corresponding scratch.
2.2.3 Extraction and Quantification of DNA and RNA from Cell Lines
2.2.3.1 Genomic DNA (gDNA) Extraction from Cancer Cell Lines
Genomic DNA extraction was performed after harvesting cancer cell lines from culture flasks or dishes. Cell pellets were kept in ice cold PBS until the extraction procedure to prevent any DNA degradation due to DNAse enzymes. Briefly, cell pellets were washed with 0.3 ml of digestion buffer per 3 × 10⁷ cells in an overnight long period at 50⁰ C. For cell concentrations higher than 108, 1 ml of digestion buffer were used per
27
cell line. After overnight incubation, cell lysates were treated with equal volume of phenol/chloroform/isoamyl alcohol. Eppendorf tubes were then centrifuged 10 min at 1700 x g. The aqueous top layer were transferred into a new eppendorf and 0.15 ml (1/2 volume) of 7.5 M ammonium acetate and 0.3 ml (original amount of phenol/chloroform/isoamyl and cell lysate mix) of 100% ethanol were added. The amount of ammonium acetate and 100% ethanol should be adjusted if higher amount of digestion solution is used in the beginning. The stringy precipitate is recovered by centrifugation at 1700 x g for 2 minutes. Pellet was then rinsed with 70% ethanol following decanting and air drying. Extracted DNA was resuspended in ~1ml of TE buffer kept at 65⁰ C for several hours for effective solubilization.
2.2.3.2 Total RNA Extraction from Adherent Cell Lines
Total RNA was extracted directly from cell culture flasks or dishes using TRIzol® reagent (Ambion® Thermo Fisher Scientific, Waltham, MA USA) according to manufacturer’s instructions. Briefly, growth media was removed from culture flasks or dishes. Cells were lysed and homogenized by adding 1ml of TRIzol reagent per 10cm2 culturing area. Homogenized samples were transferred into 1.5ml eppendorf tubes and kept for 5 minutes at room temperature. Tubes were vigorously shaken after adding 0.2ml of chloroform per 1ml of TRIzol reagent and incubated 2-3 minutes at room temperature. Tubes were centrifuged at 12,000 x g for 15 minutes at 4⁰C. Upper aqueous phase was removed into a new eppendorf since the extracted RNA remains exclusively in aqueous phase. To precipitate RNA in aqueous phase, 0.5ml of isopropanol was added and followed by 10 minutes of incubation at room temperature.
28
Eppendorf tubes were then centrifuged at 12,000 x g for 10 minutes at 4⁰C. Supernatant was removed and RNA pellet was washed with 1ml of 75% ethanol and centrifuged at 7500 x g for 5 minutes at 4⁰C. Ethanol containing wash solution was discarded and the remaining RNA pellet was air dried for 5 min at room temperature. RNA was reconstituted in nuclease-free ddH2O (Ambion® Thermo Fisher Scientific, Waltham, MA USA).
2.2.3.3 Quantification of gDNA and RNA Samples
Genomic DNA samples obtained from tumors and cell line pellets were quantified using NanoDrop™ (Thermo Fisher Scientific, Waltham, MA USA) and QuBit® fluorometer (Thermo Fisher Scientific, Waltham, MA USA) according to manufacturer’s instructions. Briefly, NanoDrop measurements was achieved by loading 1µL of gDNA or RNA sample on the lower measurement pedestal. gDNA and RNA samples were considered as pure if the 260nm/280nm ratio was ~1.8 and ~2.0, respectively.
Quantities of gDNA and RNA was measured by QuBit fluorometer with Quant-iT™ dsDNA High-Sensitivity (HS) Assay Kit and Quant-Quant-iT™ RNA Broad-Range BR Assay Kit kits (see Table 2-2), according to manufacturer’s instructions.
2.2.4 SNP Genotyping
2.2.4.1 SNP Genotyping with Quantitative Real Time PCR
SNPs with dbSNP IDs rs1801133, rs1801131, rs1805087, and rs1801394 (also known as MTHFR 677 C>T, MTHFR 1298 A>C, MTR 2756 A>G and MTRR 66 A>G,
29
respectively) were genotyped using TaqMan® SNP Genotyping assays (Applied Biosystems, Thermo Fisher Scientific, Waltham, MA USA). Assay IDs were C___1202883_20, C___850486_20, C___12005959_10, and C___3068176_10, respectively for each SNP. The assays were run on Stratagene Mx3005P q-PCR machine (Agilent Technologies). TaqMan® Genotyping Master Mix (Applied Biosystems, Thermo Fisher Scientific, Waltham, MA, USA) including AmpliTaq Gold® DNA Polymerase (Ultra Pure), dNTP mix (with dUTP), Passive Reference 1 (ROX), Uracil-D-glycosylase (UDG) and reaction buffer was used in amplification reactions. Thermal profile used in TaqMan® SNP Genotyping reactions were used according to manufacturer’s instructions. ROX passive reference dye was used to minimize the effect of pipetting errors during reaction setup. UDG was used to prevent carry over contamination during pre-PCR. All samples were run as triplicates in each genotyping reaction to achieve maximum reproducibility. Each sample was genotyped at least twice in separate genotyping reactions. Genotype frequencies were in Hardy-Weinberg equilibrium (Table 2-5).
2.2.4.2 PCR-Restriction Fragment Length Polymorphism (RFLP)
RFC 80 G>A (rs1051266) polymorphism was genotyped using PCR-RFLP method. PCR primers are given in Table 2-4. Primer sequences were previously published [32]. PCR amplicons were digested with HinP1I restriction enzyme. Digested PCR products were run on Novex® TBE PAGE Gels, (10%, 15 well) or agarose gel electrophoresis (Table 2-2). All samples were genotyped at least twice. Genotype frequencies were in Hardy-Weinberg equilibrium (Table 2-5).
30
Table 2-5: Hardy-Weinberg Distributions of Single Nucleotide Polymorphisms in NSCLC Patients.
Polymorphism Genotype Observed Observed/
Expected χ2 P* MTHFR 677 C>T (rs1801133) CC 20 1.1 1.389 0.24 CT 20 0.8 TT 10 1.3 MTHFR 1298 A>C (rs1801131) AA 27 1 0.078 0.78 AC 20 1 CC 3 0.9 MTR2756 A>G (rs1805087) AA 36 1 1.325 0.25 AG 14 1.2 GG 0 - MTRR66 A>G (rs1801394) AA 15 1.1 0.703 0.4 GA 22 0.9 GG 13 1.1 RFC80 G>A (rs1051266) GG 18 1.1 0.469 0.49 GA 22 0.9 AA 10 1.1
* Chi-Square test (one degree of freedom) (from Senses et al. BMC Med Genet, 2013 [143]).
2.2.5 Gene Expression Analyses
2.2.5.1 Complementary DNA (cDNA) Synthesis
Total RNA were converted to cDNA using High-Capacity cDNA Reverse Transcription Kit (Applied Biosystems, Thermo Fisher Scientific, Waltham, MA, USA) according to manufacturer’s instructions. All the cDNA reaction tubes were stored at -80 ⁰C before use.
31
2.2.5.2 Quantitative Real Time PCR Analyses for gene expression
Gene expression was measured by SYBR® Green PCR Master Mix (Applied Biosystems, Thermo Fisher Scientific, Waltham, MA, USA) with PCR primers given in Table 2-3. PCR was run in 20 µL of reaction volume and thermal profile was 95⁰C for 10 min (AmpliTaq Gold® Polymerase Activation) followed by 40 cycles of denaturation (95⁰C for 15 sec) and annealing/extension (60⁰C for 1 min) steps. Melt curve was generated after 40 cycles to check for nonspecific product formation (amplification). Reaction was run on 7500 Real-Time PCR System (Applied Biosystems, Thermo Fisher Scientific, Waltham, MA, USA, see Table 2-1 for details).
2.2.6 Quantification of DNA Damage in Cancer Cell Lines
2.2.6.1 Single Cell Gel Electrophoresis (SCGE) Assay-Comet Assay
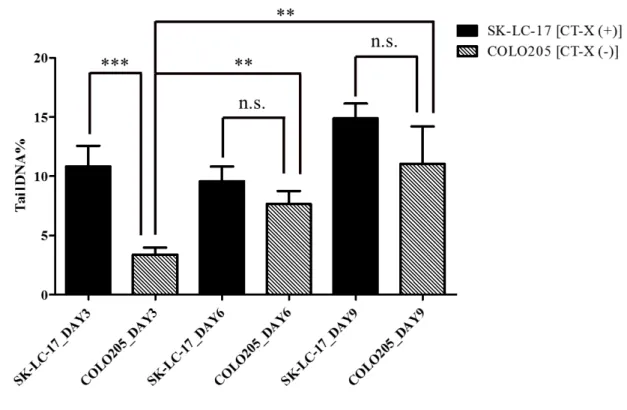
Experimental setup was adopted from a previous study (Figure 2.1) [88]. CT-X (+) SK-LC-17 and CT-X (-) COLO205 cancer cell lines were cultured in 12nM folic acid (FA) containing RPMI-1640 medium (Appendix B-Table 7-3). CT-X expression of both cell lines were measured in a previous study [89]. Unmodified RPMI-1640 and FBS contains supra-physiological levels of folic acid, therefore, 12nM FA containing RPMI-1640 was prepared by supplementing FA externally into FA-free RPMI-RPMI-1640 and dialyzed FBS (see Table 2-2). DNA damage of cell lines was measured on 3 day intervals till day 9 to measure the effect of prolonged folic acid deficiency. Assay controls were Comet assay protocol was adopted from Dhawan et al. [90]. Comet assay was run on alkaline conditions. The separated DNA was visualized by ethidium
32
bromide staining under fluorescent microscope (AxioCam MRc5 image capture device Carl Zeiss (Oberkochen, GERMANY). Comet images are then analyzed by CASPLab Comet image analyses software [91] according to manufacturer’s instructions. Buffers and chemicals used in comet assay protocol are given in Table 2-6. Detailed explanation of preparation of these substances can be find in [99]. This protocol is composed of three main parts. In the first part (steps a-to-g) include preparation of slides for electrophoresis. Steps “h-to-k” include the electrophoresis of slides in alkaline conditions. Steps “l-to-n” include visualization of comets and analyses of tail parameters with CASPLab software. This steps are detailed as follows:
a. Slides were cleaned by dipping in methanol and then burning over a blue flame. This step is required to remove the oil and dust on slides.
b. One-third of slides is dipped in melted normal melting agarose (NMA). Undersides of slides were wiped with towels to remove excess agarose and left in a flat surface for the NMA to dry.
c. Adherent cultures were detached by scraping to avoid extra DNA damage caused by enzymatic detachment methods (e.g., trypsination). Cell viability assay by trypan blue staining was performed on every assay. Cell viability below 80% is not acceptable, hence this will result in biased DNA damage measurements.
d. 75 µL of low melting point agarose (LMPA, 0.5%; 37ºC) was mixed gently with 10 µL of cell suspension (concentration: 1,000 cells/µL) in an eppendorf tube.
33
e. The LMPA + cell suspension was pipetted on the surface of NMA coated slides
[ADD LINK TO PREVIOUS STEP FOR CLARITY] and covered with a coverslip. Slides were moved on ice packs for the LMPA to dry (for 5-10 min).
f. Coverslip were gently removed from slides and the third layer of low-melting agarose (80 µL LMPA) was added onto the slide. Slide was covered with a new coverslip and moved again on ice packs for the LMPA to dry (for 5-10 min). g. Coverslips were removed very gently and slowly. Then, slides were dipped into
cold, freshly made lysing solution followed by incubation in dark at 4ºC for 2 hours.
h. Slides were gently removed from lysing solution and placed side by side on horizontal gel box near one end. Slides were placed together as close as possible. Electrophoresis tank was filled with freshly made electrophoresis buffer (pH>13) until the liquid level completely covers the slides (bubbles were avoided over the agarose, if existed, removed by micropipette tips).
i. Slides were left in alkaline buffer for 20 minutes in dark to allow unwinding of the DNA and to show the expression of alkali-labile single strand DNA damage. j. 0.74 V/cm fixed voltage was used and current was adjusted to 300 milliamperes by fine tuning the level of buffer in electrophoresis tank. Electrophoresis reaction was ran for 30 min. Electrophoresis tank was kept in cold room during the reaction to avoid melting of LMPA.
k. Slides were removed from the tank and tilted dropwise into a drain tray. Tray was filled with neutralization buffer and slides were kept there for 5 minutes.
34
After 5 min. neutralization buffer was discarded. This procedure was repeated with fresh neutralization buffer two more times.
l. Slides were stained with 80µL of 1X ethidium bromide and left for 5 min. and then dipped in chilled distilled water to remove excess stain. Slides were covered with coverslips and images were taken under fluorescent microscope. At least 30 comet images from every slide was taken to increase statistical power.
m. Slides which were to be evaluated later on were dried for archival purposes. Those slides were dipped in cold 100% ethanol (or cold 100% methanol) for 20 min. Then, slides were air dried and incubated at 50⁰C for 30 min. Slides prepared with this protocol can be stored in low humidified area and can be stored for years. Evaluation of archived slides were achieved by rehydrating with chilled distilled water for 30 min. and staining with 80µL 1X Ethidium Bromide, as in step “l”.
Figure 2.1: Comet assay experimental setup. SK-LC-17 and COLO-205 cancer cell lines were cultured in 75 cm2 flasks. In 3 day intervals till day 9, cells were detached and counted by trypan blue staining, viability was assessed. Cell supernatants were used for comet assay protocol.
35
Table 2-6: Chemicals or buffers used in comet assay. Name of Chemical or Buffer Ingredients
Normal Melting Agarose (NMA)
Low Melting Point Agarose (LMPA)
Absolute ethanol or methanol Coverslips (No. 1, 24 x 60 mm)
PBS (Ca++, Mg++ free): 137 mmol/l NaCl 2.7 mmol/l KCl 10 mmol/l Na2HPO4 1.8 mmol/l KH2PO4 Adjust pH to 7.4
Lysing Solution: Ingredients per 1000 mL
2.5 M NaCl 146.1 g 100 mM EDTA 37.2 g 10 mM Trizma base 1.2 g 1% Triton X-100
10% DMSO
Electrophoresis Buffer: 300 mM NaOH
1 mM EDTA Neutralization Buffer: 0.4 M Tris
pH adjusted to 7.5 with concentrated (>10 M) HCl
Staining Solution: 1X EtBr Solution
(Prepared from stock solution: EtBr; 10X Stock - 20 µg/mL)
36
2.2.6.2 Histone H2A.X Phosphorylation Assay by Flow Cytometry
DNA double strand breaks were quantified using H2A.X Phosphorylation Assay Flow Cytometry Kit (MILLIPORE, Temecula, CA) according to manufacturer’s instructions. This kit detects Histone H2A.X phosphorylation at serine 139. Cell lines were grown either in FA-free RPMI-1640 or normal RPMI-1640 culture media conditions in 60 mm culture dishes (see section 2.2.2.1 for growing conditions). Phosphorylated H2A.X was measured on two setups. In the first setup, cell lines were grown in tissue culture for 5 days and H2AX phosphorylation was directly measured by flow cytometry. In the second setup, after 5 days of incubation, DNA double strand breaks were induced by 100j/m2 UV-C irradiation using UV crosslinker and cells were incubated for 2 hours in tissue culture conditions (see section 2.2.2.1) for recovery before H2A.X measurement. Till the day of H2A.X measurement cell lines were kept in sub-confluent conditions to reduce inherent DNA damage. List of cell lines used in H2A.X measurement analyses are given in Appendix B-Table 7-3.
2.2.7 In vitro drug screening analyses
2.2.7.1 Treatment of cancer cell lines with single molecule inhibitors
AZD0530, 17AAG and AZD6244 were purchased from Selleck Chemicals. 10a was developed in a previous study and a gift from Prof. Botta [CITATION]. Research Drugs were screened on transparent 96-well-plates in which cancer cell lines were seeded as 1000 cell/well 96 hours before cytotoxicity measurement. Drugs were screened using 10 different doses ranging from 0.001 µM to 50 µM except 10a for which 6 different doses