DOI: 10.1515/rrlm-2017-0020
Association of ischemia-modified albumin with
oxidative stress status and insulin resistance
in obese patients
Turkan Yigitbasi
1*, Yasemin Baskin
2, Evren Akgol
3, Gizem Calibasi Kocal
2,
Hulya Ellidokuz
41. Istanbul Medipol University, School of Medicine, Department of Clinical Biochemistry, Istanbul, Turkey; 2. Dokuz Eylul University, Institute of Oncology, Department of Basic Oncology, Izmir, Turkey; 3. Ataturk Training and Research Hospital, Department of Clinical Biochemistry; Izmir, Turkey; 4. Dokuz Eylul University, Institute of Oncology, Department of
Preventive Oncology, Izmir, Turkey
Abstract
Objectives: Obesity is associated with oxidative stress due to the overproduction of free radicals in some accompanying states, such as hyperglycemia, elevated lipid levels and chronic inflammation. Free radical accu-mulation may modify the structure of human serum albumin, generating ischemia-modified albumin (IMA), and increased serum levels of IMA have been linked to obesity-related diseases and oxidative damage. The association of IMA levels with oxidative stress and insulin resistance (IR) has not been evaluated in the context of obesity. The aim of this study is to determine IMA levels in the context of obesity and their relationship with oxidative status and insulin resistance.
Methods: Sixty-one adult obese cases with body mass index (BMI) ≥ 30 were evaluated, with 30 healthy adults with 18.5 ≤ BMI ≤ 24.9 included in the control group. IMA, total antioxidant status (TAS), total oxidant status (TOS), oxidative stress index (OSI), total cholesterol, triglycerides, HDL and LDL-cholesterols were determined.
Results: IMA, TAS, TOS, OSI, total cholesterol and LDL-cholesterol levels were not different between the con-trol and obese groups (P-value >0.05), while triglyceride levels were determined to be higher and HDL-cholesterol levels were determined to be lower in the obese group (P-value <0.05). When IMA, TAS, TOS, OSI levels were compared between the control/IR(-), obese/IR(+) and obese/IR(-) groups, no statistically significant differences were detected (P-value >0.05), but the fasting blood glucose level was determined to be higher in the obese/IR(+) group than in the control group.
Conclusions: We concluded that obesity and insulin resistance had no effect on IMA levels in the obese group, who showed no impairment in their oxidative balance.
Keywords: obesity, ischemia-modified albumin, oxidative stress, insulin resistance Received: 1st February 2017; Accepted: 28th May 2017; Published: 17th July 2017
*Corresponding author: Turkan Yigitbasi, Istanbul Medipol University, School of Medicine, Department of Clinical Biochemistry, Istanbul, Turkey, e-mail: [email protected]
Introduction
Obesity, an important metabolic disorder with rapidly increasing prevalence, is caused by impairment of the energy balance (1) and con-stitutes a risk factor for diabetes, hypertension, dyslipidemia and some cancers (2). Obesity can cause the overproduction of free radicals as a re-sult of some accompanying states, such as hyper-glycemia, chronic inflammation, increased mus-cle activity due to being overweight, increased lipid levels, deficient antioxidant mechanism, and the production of reactive oxygen species (ROS) (2,5). Oxidative stress, a state of imbal-ance between antioxidants and oxidants such as free radicals or reactive oxygen species (3) due to free radical overproduction, may be a unifying mechanism in the progress of obesity-based co-morbidities, such as cardiovascular disease and diabetes mellitus (DM) (4). Free radical accu-mulation in obesity may modify the N-terminal region of human serum albumin (HSA) to gen-erate ischemia-modified albumin (IMA). This structural change affects the binding capacity of albumin to the transition elements (6).
It is known that oxidative stress increases in obesity (14–17), and IMA levels are elevat-ed in the context of abnormal conditions relatelevat-ed to oxidative stress. Some studies have indicated that IMA levels are increased in obesity-related abnormalities, such as hypercholesterolemia (7), type 2 diabetes (8, 9), metabolic syndrome (10) and elevated free fatty acid (FFA) levels in the body (11). IMA is also increased in other con-ditions that are identified with free radical pro-duction, such as liver cirrhosis, acute infections and advanced cancer [12]. In this respect, IMA can be considered as a marker of oxidative stress in obesity and obesity-related abnormalities (6, 7, 13). Thus, the purpose of our study is to de-termine the IMA levels in the context of obesity and to investigate their relationship with oxida-tive status and insulin resistance (IR).
Materials and methods
Selection of cases
Study Group: Sixty-one patients (32 women
and 29 men) aged 21- 72 (53.48 ± 10.55) with
body mass index (BMI) ≥ 30 were enrolled as obese cases in the study group. Study group cas-es were chosen from among patients under regu-lar medical control at Hıfzısıhha Institute-Izmir. The use of antioxidant agents (vitamins E and C), diagnoses of infectious diseases, and insuffi-cient or inappropriate sampling were accepted as exclusion criteria.
Control Group: Thirty healthy cases (25
women and 5 men) aged 21- 68 (43.80 ± 14.00) with 18.5 ≤ BMI ≤ 24.9 kg/m2 were included
as a control group. Cases in the control group had taken no medications for at least 2 months. The exclusion criteria for the control group were same as those for the study group.
Weight classifications for all cases in the study and control groups were determined ac-cording to WHO criteria as normal-healthy weight 18.5 ≤ BMI ≤ 24.9 and obese BMI ≥ 30 kg/m2 (18).
Sample collection
The study was evaluated and approved by the Ethics Committee of the Ministry of Health of Izmir Tepecik Education and Research Hospi-tal (Protocol number: 67/9) in accordance with the Declaration of Helsinki. Written informed consents were obtained from all cases before the study was initialized.
Blood samples were collected at 08:00-10:00 in the morning with the participant in a sit-ting position following an overnight fast of 8-12 hours. Samples were collected in 8-mL vacu-um gel sample tubes. Tubes were centrifuged at 1600 x g for 15 minutes, and serum samples were separated. Obtained serum samples were used to perform IR, T total antioxidant status (TAS), total oxidant status (TOS) and IMA
anal-yses. The [HOMA-IR]>2.5 insulin resistance was used as a base to categorize the control and obese groups.
Total antioxidant and oxidant analysis
Measurement of the total antioxidant status (TAS) of serum: The total antioxidant status of
the serum was determined using a colorimetric measurement method in an automated analyzer (Abbott Aeroset, Illinois, USA) (19). The meth-od is based on the prmeth-oduction of the dianisidine radical (bright yellowish-brown) by reacting hydroxyl radicals (from the production of the Fenton reaction) with the substrate O-dianisi-dine (colorless). At the end of the reaction, the changed color intensity can be determined spec-trophotometrically and is related to the total anti-oxidant status in the sample. The results are pre-sented as mmol Trolox eq/L, and the intra- and interassay CVs were lower than 3% (20).
Measurement of the total oxidant status (TOS) of serum: The TOS of the serum was
measured using a colorimetric measurement method in an automated analyzer (Abbott Aero-set, Illinois, USA) (21). In this method, ferric acid formed due to the oxidation of a ferrous ion-o-dianisidine complex to ferric ion by the ef-fects of oxidants, which yielded a colored com-plex with Xylenol orange in an acidic medium. The difference in the color intensity was associ-ated with the total number of oxidant molecules in the sample. The results are presented as the micromolar hydrogen peroxide equivalent per liter (μmol H2O2 Eq/L), and the intra- and inter-assay CVs were lower than 3% (22).
Calculation of the oxidative stress index (OSI): The percent ratio of the total oxidation
status level to the total antioxidant status was accepted as the OSI and as an indicator of the oxidative stress degree (23). The OSI value was calculated using the equation given below:
OSI= [(TOS, µmol H2O2 equivalent/l) / (TAS, µmol Trolox equivalent/l)] x100.
Ischemia-modified albumin analysis The serum IMA was measured using the
al-bumin cobalt binding test (24). The test principle
is based on the colorimetric determination of the complex of dithiothreitol (DTT) with unbound cobalt. Cobalt chloride (50µl, 0.1%) was added to patient serum (200 µl), and incubated for 10 minutes to enable albumin-cobalt binding. DTT solution (50 µl, 1.5 mg/mL) was added to en-able reaction of unbinded cobalt for 2 minutes. After 2 minutes, the reaction was terminated by adding NaCl (0.9%). The same method was fol-lowed for the sample blank, which used distilled water instead of DTT. At the end of the reaction, the absorbance values were determined at 470 nm using a spectrophotometer (Shimadzu UV-1201, Japan). The difference between the sam-ple and the samsam-ple blank was recorded as the IMA value. The method’s percent values for the intra- and interassay CVs were 3.20 and 3.91, respectively.
Other biochemical assays
Triglycerides, HDL-cholesterol and fasting blood glucose (FBG) levels were determined using routine methods (Konelab 60i/DIALAB GmBH, Wiener Neudorf, Austria). Insulin lev-els were determined using a chemiluminescence technique (Immulate 2000 analyzer, Bayer Diag-nostics, Tarrytown, New York, USA). The equa-tion (25): HOMA-IR = [fasting insulin (µU/mL) x fasting blood glucose (mmol/L)] /22.5 was used to calculate the HOMA-IR (Homeostasis Model for Assessment-Insulin Resistance) insu-lin resistance (25).
Statistics
The results of the study and control groups are expressed as the means ± standard deviations and 95% confidence intervals. Student’s t-tests and ANOVA variance analyses (Bonferroni correction) were performed for comparisons of mean values of normal and obese cases and IR
(+) and IR (-) obese cases, respectively. The con-trol and obese cases were balanced in terms of gender and age using covariance analysis. Pear-son’s correlation analysis (rho) was used to de-termine the relationships between biochemical parameters and BMI and IR. Statistical analyses were performed using SPSS 21 (SPSS for Win-dows, Chicago, Illinois, USA). Two-sided tests with a P-value <0.05 were accepted as signifi-cant.
Results
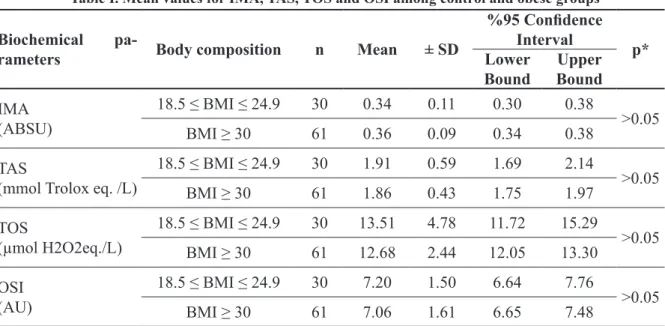
When IMA, TAS, TOS, OSI levels were compared between the control and obese groups, there was no significant difference was detect-ed (P-value >0.05) (Table I). The imbalances between the groups in terms of gender and age were determined using covariance analysis.
When total cholesterol, triglycerides, and HDL- and LDL-cholesterol levels were
com-pared between the control and obese groups, no significant alterations were detected for total cholesterol and LDL-cholesterol levels, while triglyceride levels were determined to be high-er and HDL-cholesthigh-erol levels whigh-ere dethigh-ermined to be lower in the obese group (P-value <0.05) (Table 2). BMI and HDL-cholesterol (r: -0.27, p < 0.01) and IMA and triglyceride levels (r:-0.24,
P-value <0.01) showed weak negative
correla-tions in all cases. FBG was found as higher in the obese group than in the control group (P-value
<0.05) (Table II).
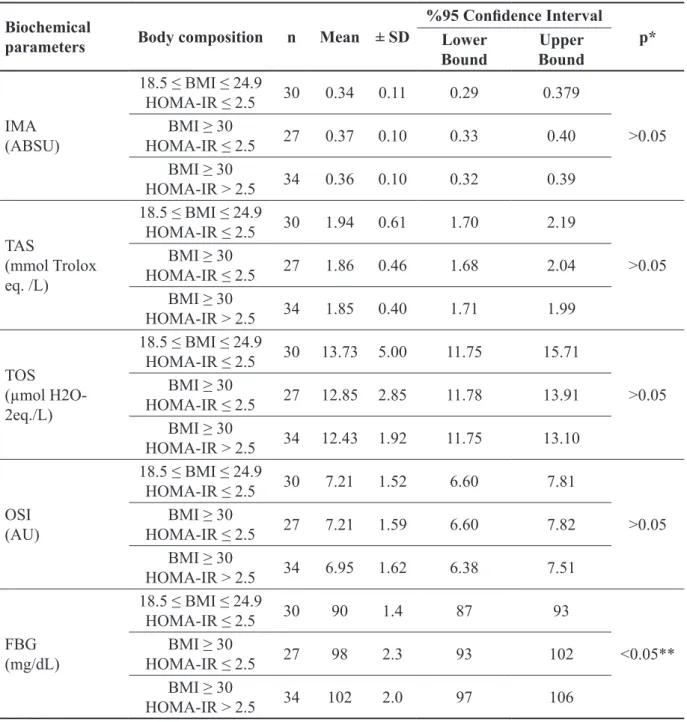
IMA, TAS, TOS, OSI and FBG levels were compared between control/IR (-) and obese/ IR (+) and obese/ IR (-) cases. No statistically significant differences were detected for IMA, TAS, TOS and OSI levels (Table III). The FBG level was determined to be higher in the obese/ IR (+) group than in the control group (P-value
<0.05).
Table I. Mean values for IMA, TAS, TOS and OSI among control and obese groups
Biochemical
pa-rameters Body composition n Mean ± SD
%95 Confidence
Interval p*
Lower
Bound BoundUpper
IMA (ABSU) 18.5 ≤ BMI ≤ 24.9 30 0.34 0.11 0.30 0.38 >0.05 BMI ≥ 30 61 0.36 0.09 0.34 0.38 TAS
(mmol Trolox eq. /L)
18.5 ≤ BMI ≤ 24.9 30 1.91 0.59 1.69 2.14 >0.05 BMI ≥ 30 61 1.86 0.43 1.75 1.97 TOS (µmol H2O2eq./L) 18.5 ≤ BMI ≤ 24.9 30 13.51 4.78 11.72 15.29 >0.05 BMI ≥ 30 61 12.68 2.44 12.05 13.30 OSI (AU) 18.5 ≤ BMI ≤ 24.9 30 7.20 1.50 6.64 7.76 >0.05 BMI ≥ 30 61 7.06 1.61 6.65 7.48
Control group: 18.5 ≤ BMI ≤ 24.9 kg/m2; Obese group: BMI ≥ 30 kg/m2. Data are expressed as mean ± SD. Results were
com-pared using the t test.
*P-value <0.05 for t test. Abbreviations: BMI, body mass index; SD, standart deviation; IMA, ischemia modified albumin; ABSU, absorbance units; TAS, total antioxidant response; TOS, total oxidant status; OSI, Oxidative stress index value; AU, Arbitrary unit
Discussion and conclusion
Even if it is assumed that obesity increases oxidative stress (14-17), it is difficult to deter-mine an obesity-associated oxidative stress re-sponse since most studies have incorporated different study designs with various oxidative stress biomarkers (2). In this study, there was no
impairment of the oxidant-antioxidant balance in obese cases and IR (+) obese cases in com-parison with the control group. Our study group consisted of outpatient individuals who attend-ed regular check-ups. Rattend-educing oxidative stress may be possible by various lifestyle modifica-tions, such as changes in dietary intake (2), low-ering insulin resistance and lipids via nutritional modifications (16), weight loss (14, 16, 26) and chronic exercise (27). However, the general
con-sensus is that obesity is a cause of increased oxi-dative stress (14-17). Brown et al. (28) identified no statistically significant differences in TAS, superoxide dismutase and reduced glutathione levels, which are parameters of oxidative stress, among healthy normal-weight (as control) and obese groups.
Our study was the first to determine that IMA levels can be the same in obese individuals without oxidative stress. Although serum IMA levels were higher in the study group in com-parison with the control group, there was no sta-tistically significant difference. Only Piva et al. (29) focused on serum IMA levels in obese in-dividuals. They indicated that elevated IMA lev-els were associated with oxidative stress. In our study group, IMA levels were higher than those of the control group, but there was no significant
Table II. Mean values for lipid parameters and fasting blood glucose among control and obese groups
Lipid
parameters Body composition n Mean ± SD
%95 Confidence
Interval p*
Lower
Bound BoundUpper
Total cholesterol (mg/dl) 18.5 ≤ BMI ≤ 24.9 30 211.47 35.20 198.32 224.61 >0.05 BMI ≥ 30 61 220.93 38.56 211.06 230.81 Triglycerides (mg/dl) 18.5 ≤ BMI ≤ 24.9 30 106.70 42.13 90.97 122.43 <0.05 BMI ≥ 30 61 154.43 111.30 125.92 182.93 HDL-cholesterol (mg/dl) 18.5 ≤ BMI ≤ 24.9 30 55.13 11.64 50.79 59.48 <0.05 BMI ≥ 30 61 47.84 9.98 45.28 50.39 LDL-cholesterol (mg/dl) 18.5 ≤ BMI ≤ 24.9 30 136.70 29.65 125.63 147.77 >0.05 BMI ≥ 30 61 141.82 32.204 133.50 150.14 FBG (mg/dL) 18.5 ≤ BMI ≤ 24.9 30 90 1.4 87 93 <0.05 BMI ≥ 30 61 100.23 2.13 93 106
Control group: 18.5 ≤ BMI ≤ 24.9 kg/m2; Obese group: BMI ≥ 30 kg/m2. Data are expressed as mean ± SD. Results were
com-pared using the t test.
*P-value <0.05 for t test. Abbreviations: BMI, body mass index; SD, standard deviation, HDL, high-density lipoprotein; LDL, low-density lipoprotein; FBG, fasting blood glucose.
Table III. Mean values for IMA, TAS, TOS, OSI and FBS among control and obese groups with or without insulin resistance
Biochemical
parameters Body composition n Mean ± SD
%95 Confidence Interval
p* Lower
Bound BoundUpper
IMA (ABSU) 18.5 ≤ BMI ≤ 24.9 HOMA-IR ≤ 2.5 30 0.34 0.11 0.29 0.379 >0.05 BMI ≥ 30 HOMA-IR ≤ 2.5 27 0.37 0.10 0.33 0.40 BMI ≥ 30 HOMA-IR > 2.5 34 0.36 0.10 0.32 0.39 TAS (mmol Trolox eq. /L) 18.5 ≤ BMI ≤ 24.9 HOMA-IR ≤ 2.5 30 1.94 0.61 1.70 2.19 >0.05 BMI ≥ 30 HOMA-IR ≤ 2.5 27 1.86 0.46 1.68 2.04 BMI ≥ 30 HOMA-IR > 2.5 34 1.85 0.40 1.71 1.99 TOS (µmol H2O-2eq./L) 18.5 ≤ BMI ≤ 24.9 HOMA-IR ≤ 2.5 30 13.73 5.00 11.75 15.71 >0.05 BMI ≥ 30 HOMA-IR ≤ 2.5 27 12.85 2.85 11.78 13.91 BMI ≥ 30 HOMA-IR > 2.5 34 12.43 1.92 11.75 13.10 OSI (AU) 18.5 ≤ BMI ≤ 24.9 HOMA-IR ≤ 2.5 30 7.21 1.52 6.60 7.81 >0.05 BMI ≥ 30 HOMA-IR ≤ 2.5 27 7.21 1.59 6.60 7.82 BMI ≥ 30 HOMA-IR > 2.5 34 6.95 1.62 6.38 7.51 FBG (mg/dL) 18.5 ≤ BMI ≤ 24.9 HOMA-IR ≤ 2.5 30 90 1.4 87 93 <0.05** BMI ≥ 30 HOMA-IR ≤ 2.5 27 98 2.3 93 102 BMI ≥ 30 HOMA-IR > 2.5 34 102 2.0 97 106
Control group: 18.5 ≤ BMI ≤ 24.9 kg/m2; Obese group: BMI ≥ 30 kg/m2. Data are expressed as mean ± SD. Results were
com-pared using the Anova test followed by the Bonferroni-correction. *P-value <0.05 for the Anova test. **Statistical significance between Control group and obese/IR (+) group. Abbreviations: BMI, body mass index; SD, standart deviation; IR, insulin resis-tance; HOMA-IR, Homeostasis model of assessment-insulin resisresis-tance; IMA, ischemia modified albumin; ABSU, absorbance units; TAS, total antioxidant response; TOS, total oxidant status; OSI, Oxidative stress index value; AU, Arbitrary unit; FBG, fasting blood glucose.
difference between the two groups. A study can be performed with larger groups to achieve prop-er numbprop-ers for a statistical analysis of increased IMA levels in obese patients without oxidative stress. However, it can be said that the increase in IMA levels is associated with oxidative stress rather than obesity or obesity-related diseases.
Piwowar et al. (9) investigated the relation-ship between IMA levels and BMI in normal weight, overweight and obese type-II diabetic individuals and reported no relationship between IMA levels and BMI. In another study, Kaefer et al. (8) showed increased IMA and high-sensitiv-ity C-reactive protein levels in type 2 diabetics, although no relationship between IMA and BMI was identified. These findings indicate that in-flammatory processes are associated with IMA rather than visceral fat and obesity.
Obesity is directly related to IR and hyper-glycemia (2). IR and hyperhyper-glycemia lead to oxi-dative stress via multiple biochemical processes (glucose auto-oxidation, stimulation of the poly-ol pathway, an imbalance between the amounts of reduced and oxidized coenzyme forms, non-enzymatic glycation and the generation of advanced glycation end-products-AGEs) (8, 9). In cases of oxidative stress, it has been reported that the capacity of albumin to bind exogenous cobalt is reduced (30). However, our study in-dicated that IR does not affect IMA levels. Al-though the individuals in the study group were obese and had insulin resistance, diabetes was not detected in these cases because they were chosen from among patients under regular med-ical control.
Piwovar et al. (9) investigated IMA levels depending on the glycemic control of type-II diabetic patients and reported that a correlation between IMA and HbA1c was only observed in patients with poor glycemic control (HbA1c > 7%). Another study by Kaefer et al. (8) reported that poor glycemic control effected IMA levels. This study indicated that levels of IMA were
only higher in the highest quartile of glucose and hs-CRP levels.
Triglycerides were higher and HDL-choles-terol levels were lower in obese cases in com-parison with the control group. Upon comparing obese cases with the control group, a statistically significant difference was observed only in tri-glyceride levels. As is well-known, dyslipidemic profiles in obesity include elevated triglycerides, lower HDL-cholesterol and elevated LDL-cho-lesterol levels (31). Triglycerides may be an important variable affecting IMA levels. In this study, we identified weak negative correlations between IMA and triglycerides in all cases (r: -0.24, p<0.01). However, in a previous study performed by Gidenne et al., there was no sig-nificantrelationship between IMA levels and tri-glycerides (32). It is not clear whether this con-dition is related to interference or the incorrect lipid profiles observed in obesity.
IMA levels increase due to the structur-al modification of human structur-albumin, which is caused by the accumulation and production of free radicals at extreme levels. Stress can also be indicated by this change, and it serves as a bio-marker. In patients with higher hypertension and diabetes percentages, there is a correlation be-tween BMI and IMA levels, as reported by Piva et al. The study suggested that increased serum albumin modification, which is related to ROS levels, together with insufficient peripheral oxy-genation could be predicted by increases in IMA levels. These subjects exhibited IMA produc-tion. Another suggestion from the study was that alterations in inflammatory and oxidative stress biomarkers in obese subjects can be indicated by diabetes, which is a dependent predictor, accord-ing to an advanced statistical analysis on BMI (33). Regarding these results, it was concluded that the oxidative stress condition must be in-creased by a comorbidity, as IMA levels cannot increase merely due to obesity. Obese patients without insulin resistance and oxidative stress do
Mechanism for obesity-induced increase in myocardi-al lipid peroxidation. Int J Obes Relat Metab Disord. 2001;25(3):378-88. DOI: 10.1038/sj.ijo.0801536 6. Borderie D, Allanore Y, Meune C, Devaux JY,
Ek-indjian OG, Kahan A. High ischemia-modified al-bumin concentration reflects oxidative stress but not myocardial involvement in systemic sclerosis. Clin Chem. 2004;50(11):2190-3. DOI: 10.1373/ clinchem.2004.034371
7. Duarte MM, Rocha JB, Moresco RN, Duarte T, Da Cruz IB, Loro VL, et al. Association between isch-emia-modified albumin, lipids and inflammation bio-markers in patients with hypercholesterolemia. Clin Biochem. 2009;42(7-8):666-71. DOI: 10.1016/j.clin-biochem.2009.01.010
8. Kaefer M, Piva SJ, De Carvalho JA, Da Silva DB, Beck-er AM, Coelho AC, et al. Association between ischemia modified albumin, inflammation and hyperglycemia in type 2 diabetes mellitus. Clin Biochem. 2010;43(4-5):450-4. DOI: 10.1016/j.clinbiochem.2009.11.018 9. Piwowar A, Knapik-Kordecka M, Warwas M.
Isch-emia-modified albumin level in type 2 diabetes mellitus - Preliminary report. Dis Markers. 2008;24(6):311-7. DOI: 10.1155/2008/784313
10. Valle Gottlieb MG, da Cruz IB, Duarte MM, Mores-co RN, Wiehe M, Schwanke CH, et al. Associations among metabolic syndrome, ischemia, inflammatory, oxidatives, and lipids biomarkers. J Clin Endocrinol Metab. 2010;95(2):586-91. DOI: 10.1210/jc.2009-1592
11. Bhagavan NV, Ha JS, Park JH, Honda SA, Rios CN, Sugiyama C, et al. Utility of serum Fatty Acid concen-trations as a marker for acute myocardial infarction and their potential role in the formation of ischemia-modi-fied albumin: a pilot study. Clin Chem. 2009;55(8):1588-90. DOI: 10.1373/clinchem.2008.123315
12. Aslan D, Apple FS. Ischemia modified albumin: clini-cal and analyticlini-cal update, Lab Med. 2004;35(1):44-47. DOI: 10.1309/XXYETJN8YM9HBD9C
13. Senes M, Kazan N, Coskun O, Zengi O, Inan L, Yucel D. Oxidative and nitrosative stress in acute ischaemic stroke. Ann Clin Biochem. 2007;44(Pt 1):43-7. DOI: 10.1258/000456307779596057
14. Yesilbursa D, Serdar Z, Serdar A, Sarac M, Coskun S, Jale C. Lipid peroxides in obese patients and effects of weight loss with orlistat on lipid peroxides levels. Int J Obes (Lond). 2005;29(1):142-5. DOI: 10.1038/
not differ in terms of IMA levels. Our results also support this consequence, which suggests that oxidative stress should be considered for evalua-tion of IMA levels in obesity and obesity-related clinical conditions. The comorbidities that may result in oxidative stress production can be used to classify a larger group of patients, which then can be used to prospectively assess IMA levels.
Study limitations
The number of cases in groups is small; this could be a reason for negative results. There were reported imbalances between the groups in terms of gender and age. Performing this study prospectively in a larger group would provide an improved balance between groups. A larger group of obese samples, classified according to comorbidities that may produce oxidative stress, should be used to prospectively assess IMA lev-els.
Conflict of interest
The authors report no conflicts of interest.
References
1. Lau DC, Dhillon B, Yan H, Szmitko PE, Ver-ma S. Adipokines: molecular links between obe-sity and atheroslcerosis. Am J Physiol Heart Circ Physiol. 2005;288(5):H2031-41. DOI: 10.1152/ ajpheart.01058.2004
2. Vincent HK, Taylor AG. Biomarkers and potential mechanisms of obesity-induced oxidant stress in hu-mans. Int J Obes (Lond). 2006;30(3):400-18. DOI: 10.1038/sj.ijo.0803177
3. Powers SK, DeRuisseau KC, Quindry J, Ham-ilton KL. Dietary antioxidants and exer-cise. J Sports Sci. 2004;22(1):81-94. DOI: 10.1080/0264041031000140563
4. Higdon JV, Frei B. Obesity and oxidative stress: a direct link to CVD? Arterioscler Thromb Vasc Biol. 2003;23(3):365-7. DOI: 10.1161/01. ATV.0000063608.43095.E2
sj.ijo.0802794
15. Prázný M, Skrha J, Hilgertová J. Plasma malondialde-hyde and obesity: is there a relationship? Clin Chem Lab Med. 1999;37(11-12):1129-30. DOI: 10.1515/ CCLM.1999.164
16. Dandona P, Mohanty P, Ghanim H, Aljada A, Browne R, Hamouda W, et al. The suppressive effect of dietary restriction and weight loss in the obese on the genera-tion of reactive oxygen species by leukocytes, lipid per-oxidation, and protein carbonylation. J Clin Endocrinol Metab. 2001;86(1):355-62.
17. Ozata M, Mergen M, Oktenli C, Aydin A, Sanisoglu SY, Bolu E, et al. Increased oxidative stress and hypozince-mia in male obesity. Clin Biochem. 2002;35(8):627-31. DOI: 10.1016/S0009-9120(02)00363-6
18. World Health Organisation. Obesity: Preventing and managing the Global Epidemic. Report of a WHO Con-sultation on Obesity. ISBN 9241208945, 2000; 3-5. 19. Erel O. A novel automated method to measure total
an-tioxidant response against potent free radical reactions. Clin Biochem. 2004;37(2):112-9. DOI: 10.1016/j.clin-biochem.2003.10.014
20. Cao G, Prior RL. Comparison of different analytical methods for assessing total antioxidant capacity of hu-man serum. Clin Chem. 1998;44(6 Pt 1):1309-15. 21. Erel O. A new automated colorimetric method
for measuring total oxidant status. Clin Biochem. 2005;38(12):1103-11. DOI: 10.1016/j.clinbio-chem.2005.08.008
22. Verit FF, Verit A, Kocyigit A, Ciftci H, Celik H, Koksal M. No increase in sperm DNA damage and seminal ox-idative stress in patients with idiopathic infertility. Arch Gynecol Obstet. 2006;274(6):339-44. DOI: 10.1007/ s00404-006-0172-9
23. Harma M, Harma M, Erel O. Increased oxidative stress in patients with hydatidiform mole. Swiss Med Wkly. 2003;133(41-42):563-6.
24. Bar-Or D, Lau E, Winkler JV. A novel assay for co-balt-albumin binding and its potential as a mark-er for myocardial ischemia-a preliminary report. J Emerg Med. 2000;19(4):311-5. DOI: 10.1016/S0736-4679(00)00255-9
25. Matthews DR, Hosker JP, Rudenski AS, Naylor BA,
Treacher DF, Turner RC. Homeostasis model assess-ment: insulin resistance and beta-cell function from fasting plasma glucose and insulin concentrations in man. Diabetologia. 1985;28(7):412-9. DOI: 10.1007/ BF00280883
26. Ozcelik O, Ozkan Y, Karatas F, Kelestimur H. Exer-cise training as an adjunct to orlistat therapy reduces oxidative stress in obese subjects. Tohoku J Exp Med. 2005;206(4):313-8. DOI: 10.1620/tjem.206.313 27. Kurban S, Mehmetoglu I, Yerlikaya HF, Gonen S,
Er-dem S. Effect of chronic regular exercise on serum isch-emia-modified albumin levels and oxidative stress in type 2 diabetes mellitus. Endocr Res. 2011;36(3):116-23. DOI: 10.3109/07435800.2011.566236
28. Brown LA, Kerr CJ, Whiting P, Finer N, McEneny J, Ashton T. Oxidant stress in healthy normal-weight, overweight, and obese individuals. Obesity (Silver Spring). 2009;17(3):460-6. DOI: 10.1038/oby.2008.590 29. Piva SJ, Duarte MM, Da Cruz IB, Coelho AC, Morei-ra AP, Tonello R, et al. Ischemia modified albumin as an oxidative stress biomarker in obesity. Clin Bio-chem. 2011;44(4):345-7. DOI: 10.1016/j.clinbio-chem.2010.12.001
30. Bourdon E, Loreau N, Lagrost L, Blache D. Differential effects of cysteine and methionine residues in the antiox-idant activity of human serum albumin. Free Radic Res. 2005;39(1):15-20. DOI: 10.1080/10715760400024935 31. Dobrian AD, Davies MJ, Prewitt RL, Lauterio TJ. De-velopment of hypertension in a rat model of diet-in-duced obesity. Hypertension. 2000;35(4):1009-15. DOI: 10.1161/01.HYP.35.4.1009
32. Gidenne S, Ceppa F, Fontan E, Perrier F, Burnat P. Analytical performance of the Albumin Cobalt Bind-ing (ACB) test on the Cobas MIRA Plus analyzer. Clin Chem Lab Med. 2004;42(4):455-61. DOI: 10.1515/ CCLM.2004.079
33. Piva SJ1, Tatsch E, De Carvalho JA, Bochi GV, Ko-ber H, Duarte T, Duarte MM, da Cruz IB, Moretto MB, Moresco RN. Assessment of inflammatory and oxida-tive biomarkers in obesity and their associations with body mass index. Inflammation. 2013;36(1):226-31. DOI: 10.1007/s10753-012-9538-2