Palta and Karadavut J. Anim. Plant Sci. 21(4):2011
696
SHOOT GROWTH CURVE ANALYSIS OF MAIZE CULTVARS UNDER BORON
DEFICIENCY
Ç. Palta and U. Karadavut*
Konya Soil and Water Sources Research Institute, Meram/KONYA *University of Ahi Evran, Agricultural Faculty, Campus of Aşık Paşa /KIRŞEHİR
Corresponding authore e-mail: [email protected]
ABSTRACT
This research was conducted in 2003-2004 in Karaaslan, Soil and Water Sources Research Institute, Konya the largest province in Central Anatolia Region. There is boron deficiency in soils. Thirteen corn cultivars (TTM 8119, MAT 97, RX 770, PİAVE, DK 585, DK 647, LUCE, TTM 815, LG 55, LG 60, T 1595, BC 566 and P 3394) were tested in completely randomized design with four replications. 0 (B-)-deficiency- and 3.0 kg B/ha (B+) of boron levels were applied as boric acid (H3BO3) before seed sowing. Richards Model was used estimation of growth. The Weighted Sum of Squares of Residual (WSS), the Akaike Information Criterion (AIC) and the Schwartz criterion (SC) were used as comparison criteria. As result, 3.0 kg B/ha (B+) dose revealed better growth than 0 (B-). Average dry matter accumulation in boron deficient plots (245.3 g/plant) was lower than the other plots (263.8 g/plant). But, boron deficiency of plot yields (1028.8 kg/da) was higher than for other plot yields (1024.8 kg/da).
Key words: Boron deficiency, Maize cultivar, Richard growth model, comparison criteria.
INTRODUCTION
Micronutrients are essential for the growth of plants. Deficiencies of micronutrient drastically affect the growth, metabolism and reproductive phase in plants (Cartwright et. al, 1983). Both macro and micronutrients are essential for plant growth and if a plant does not get enough of a particular nutrient it needs, the deficiency symptoms show in the general appearance of the plant. Despite being needed in small quantities, micronutrients are essential for the overall performance and health of the maize crop. They include iron (Fe), manganese (Mn), zinc (Zn), copper (Cu), molybdenum (Mo), and boron (B). Due to cropping practices and poor soil management, soil reserves are depleting in many arable soils and nutrient deficiencies have been linked to low maize yields across Middle Anatolia. Wide spread deficiencies of micronutrients has been found in Soils of Central Turkey (Alkan et. al., 1995). Soils of Central Anatolia are generally highly calcareous. Boron deficiency varies from 2% to 30 % in highly calcareous soils (Palta, 2006). B deficiency depresses commercial corn yield primarily through grain set failure. Boron deficiencies are usually apparent on the new leaves of maize since it is during the development of new tissue that nutrients are most required Raid et al., (2004). Symptoms may be reversed using boron fertilizer.
Crop growth models have made considerable progress in recent years and their predictive value is now quite acceptable under non-limiting conditions. However, under nutrient limited conditions, their predictive value is still poor. So far, a so-called “stress factor” is often used
to account for the lower biomass production, but the exact steps of the biomass production process which are affected by nutrient deficiency are not well identified (Pelerin and Mollier, 2001). Palta et al., (2008) compared maize cultivars with Richards growth model under effect of boron toxicity. Boron toxicity affected significantly on dry matter accumulation in maize cultivar. Boron availability is reduced under low rainfall/drought conditions or in soils low in organic matter. Farmers maintaining high levels of organic matter in their fields normally do not face boron deficiencies (Goldberg, 1997; Palta, 2006). Kakar et al. (2002) explained that 2 kg ha-1 boron doses increased biomass yield in wheat cultivars and logistic growth model fitted higher than other models.
The mechanism for loss due to B deficiency in maize has yet to be identified. There is little information about B deficiency in maize. Therefore, the objective of this study was to determine the maize growth under boron deficiency in Central Anatolian Region.
MATERIALS AND METHODS
The present research was conducted in 2003-2004 in Karaaslan, Soil and Water Sources Research Institute, Konya the largest province in Central Anatolia Region. In growing season of corn average temperature were 18.2 and 17.7oC, rainfall and humidity were 15.6, 20.0 mm and 50.2, 49.1%, in 2003 and 2004, respectively. Soils of research area have clay-loam texture, alkali (pH: 8.2), cancerously (21.8%) and slightly salt. Also, soils have low organic matter (1.04%), lime The Journal of Animal & Plant Sciences, 21(4): 2011, Page: 696-699Palta and Karadavut J. Anim. Plant Sci. 21(4):2011
697 level (7.4%) but high potassium (1.812 ppm) and phosphorous (27.1 ppm). Boron level was very low (0.25 ppm) in soil of experimental area.
Thirteen corn cultivars (TTM 8119, MAT 97, RX 770, PİAVE, DK 585, DK 647, LUCE, TTM 815, LG 55, LG 60, T 1595, BC 566 and P 3394) were tested in completely randomized design with four replications. Each plot was 3.0 m x 5.0 m = 15 m2. Planting distance was 0.75 m between rows and 0.25 m between plants to give a plant population of 53 333 plants/ha. At planting, P in the form of single superphosphate was applied at 80 kg/ha each; N was applied at 150 kg /ha in the form urea. The N fertilizer was applied in two equal splits; 75 kg N/ha at planting and the other half, 10 weeks after planting. 0 (B-) and 3.0 kg B/ha (B+) of boron levels were applied as boric acid (H3BO3) before seed sowing. Weeding was done twice by hand hoeing when the plants were 15-20 and 35-40 cm tall.
The data were collected weekly from 5 plants that were randomly selected in each plot. Maize plants at each sampling were separated into roots and shoots. The plants were oven-dried and weighted to record shoot weight. Non linear growth functions are the most appropriate for describing changes in weight with time because growth functions account for the form of the growth processes (Richards, 1969).
Richards Model was used in this study.
Richards Model; / 1 ) 1 ( e x Y
where,
; the value of asymptote,
; value of growth beginning stage,
; net growth ratio,
; parameter at inflexion point. Model selection, in terms of best fitting, was based on three basic diagnostic tools. The Weighted Sum of Squares of Residual (WSS), the Akaike Information Criterion (AIC) and the Schwartz criterion (SC) were used as comparison criteria. These criteria are given below; a) Coefficient Determination (R2)
n i i i n i i i Y Y Y Y R 1 2 1 2 ^ 2 ) ( ) ( 1b) Weighted Sum of Squares of Residual (WSS)
)
(
1
1 2 observed calculated n iY
Y
SD
WSS
c) Akaike Information Criterion (AIC)
M
WSS
N
AIC
log(
)
2
d) Schwartz Criterion (SC)M
N
WSS
N
SC
ln(
)
ln(
).
where, N; number of observation, M; number of parameters, SD; standard deviation for the mean size at age. The best model was selected as WSS, AIC and SC
were lower than others. Data were analyzed by STATISTICA 5.0 statistical package program.
RESULTS AND DISCUSSION
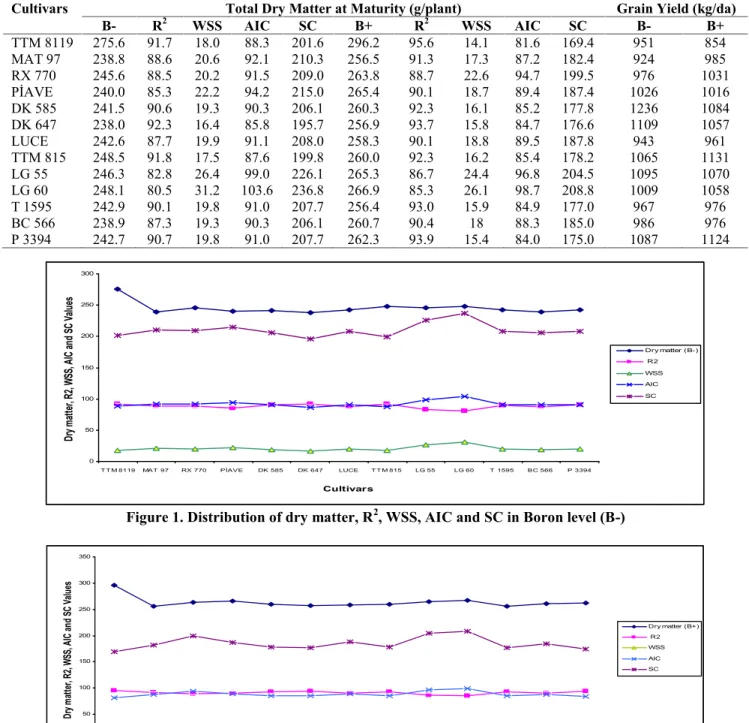
Boron deficiency depressed dry matter accumulation in corn cultivars. Especially, it affects vegetative and reproductive stages of plant growth and leads to inhibition of plant growth (Goldbach, 1997). Maize plants differ in their B requirement. Richards model generally gave a reasonable fit. The R2, WSS, AIC
and SC were evaluated for each cultivar. Total dry matter at maturity, comparison criteria and grain yield are shown in Table 1 and distribution of dry matter, R2, WSS, AIC and SC in Boron level (B-) and (B+) presented in weight or level Figure 1 and 2. Shoot of plants varied according to cultivars. Shoot of plants ranges from 238.0 g (DK 647) to 275.6 g (TTM 8119) in 0.0 kg ha-1 boron doses. But, Shoot of plants ranges from 256.4 g (T 1595) to 296.2 g (TTM 8119) in 3.0 kg ha-1boron doses. M 8119 cultivar had the higher dry matter accumulation in shoot than other cultivars. We considered value of
R
2 as a tool to make comparative study for cultivars. Coefficient of Determination (R2) ranges from 92.3 (DK 647) to 80.5 (LG 60) in 0.0 kg ha-1 boron doses and it ranges from 95.6 (T 1595) to 85.3 (LG 60) in 3.0 kg ha-1boron doses. LUCE cultivar is successfully determined by Richards’s model. Comparison criteria WSS, AIC and SC are the lower than other criteria (16.4, 85.8 and 195.7) in 0.0 kg ha-1 boron doses. TTM 8119 cultivar is successfully determined by Richards’s model. Comparison criteria WSS, AIC and SC are lower than other criteria (14.1, 81.6 and 169.4) in 3.0 kg ha-1boron doses.Grain yield range from 1236 kg da-1(DK 585) to 924 kg da-1 (MAT 97). When level of boron increased, yield decreased significantly. TTM 8119 cultivar revealed the highest reduction (14.2%). The lowest reduction was shown in LUCE cultivar (0.6%). However, T1595, P3394 and BC 566 cultivars revealed rising (13.9%, 19.9% and 0.1%, respectively). These cultivars benefit from boron toxicity. Palta (2006) explained that boron deficiency decreased maize cultivars yield significantly. This study was supported by Palta (2006).
Growth of shoot revealed nearly identically S shaped all cultivars. The board range of genotypes revealed a close relationship between shoot and growing season. The increased variation was due to a change in cultivar characteristics with ontogeny and possibly by the normal tendency for the variance of variable to increase in proportion to the mean of the variable (Ma et. al., 1992). An enhanced B deficiency symptoms in plants by increased Ca supply have been reported (Gupta, 1979). Genotypic variation in crops has also been reported with respect to B and Ca uptake (Huo-yan et al., 2003; Kanwal et. al, 2008). Boron availability in soil is affected by
Palta and Karadavut J. Anim. Plant Sci. 21(4):2011
698 several factors including soil texture, nature of clay minerals, pH, liming, organic matter, interrelationships with other elements, and environmental conditions like moderate to heavy rainfall, dry weather, and high light intensity (Moraghan and Mascagni, 1991). In addition to its effect on soil pH, calcium carbonate also acts as an
important B adsorbent in calcareous soils (Goldberg and Forster, 1991). Germination rate differed significantly according to cultivars. Boron deficiency or toxicity revealed on photosynthesis are primary or secondary, or early or late, effects in leaves (Bolan˜os et al.,2004; Reid
et al., 2004).
Table 1. Total Dry Matter at Maturity, comparison criteria and grain yield
Cultivars Total Dry Matter at Maturity (g/plant) Grain Yield (kg/da)
B- R2 WSS AIC SC B+ R2 WSS AIC SC B- B+ TTM 8119 275.6 91.7 18.0 88.3 201.6 296.2 95.6 14.1 81.6 169.4 951 854 MAT 97 238.8 88.6 20.6 92.1 210.3 256.5 91.3 17.3 87.2 182.4 924 985 RX 770 245.6 88.5 20.2 91.5 209.0 263.8 88.7 22.6 94.7 199.5 976 1031 PİAVE 240.0 85.3 22.2 94.2 215.0 265.4 90.1 18.7 89.4 187.4 1026 1016 DK 585 241.5 90.6 19.3 90.3 206.1 260.3 92.3 16.1 85.2 177.8 1236 1084 DK 647 238.0 92.3 16.4 85.8 195.7 256.9 93.7 15.8 84.7 176.6 1109 1057 LUCE 242.6 87.7 19.9 91.1 208.0 258.3 90.1 18.8 89.5 187.8 943 961 TTM 815 248.5 91.8 17.5 87.6 199.8 260.0 92.3 16.2 85.4 178.2 1065 1131 LG 55 246.3 82.8 26.4 99.0 226.1 265.3 86.7 24.4 96.8 204.5 1095 1070 LG 60 248.1 80.5 31.2 103.6 236.8 266.9 85.3 26.1 98.7 208.8 1009 1058 T 1595 242.9 90.1 19.8 91.0 207.7 256.4 93.0 15.9 84.9 177.0 967 976 BC 566 238.9 87.3 19.3 90.3 206.1 260.7 90.4 18 88.3 185.0 986 976 P 3394 242.7 90.7 19.8 91.0 207.7 262.3 93.9 15.4 84.0 175.0 1087 1124 0 50 100 150 200 250 300
T T M 8119 MAT 97 RX 770 PİAVE DK 585 DK 647 LUCE T T M 815 LG 55 LG 60 T 1595 BC 566 P 3394
Cultivars Dr y m att er, R2 , W SS , A IC an d S C V alu es Dry matter (B-) R2 WSS AIC SC
Figure 1. Distribution of dry matter, R2, WSS, AIC and SC in Boron level (B-)
0 50 100 150 200 250 300 350
TTM 8119 MAT 97 RX 770 PİAVE DK 585 DK 647 LUCE TTM 815 LG 55 LG 60 T 1595 BC 566 P 3394
Cultivars Dr y m att er, R2 , W SS , A IC an d S C V alu es Dry matter (B+) R2 WSS AIC SC
Palta and Karadavut J. Anim. Plant Sci. 21(4):2011
699 Variation in shoot growth may explain this situation. Because, germination rate, lengths of roots and shoots as well as dry matter production decreased with increasing B concentration (Ismail, 2003). The concentration of B in shoot can be affected by the inherently different growth rates (dry matter production rates) of genotypes, which can cause a dilution or concentration effects on the B concentration in the tissue. It was interesting to notice that there was a very clear inverse relationship between the total amount of B per shoot and the decreases in shoot dry matter production by B toxicity. These findings are supported by Torun et al., (2006).
The nonlinear investigation of the growth process has some advantages in not only mathematically explaining growth but also estimating the relationship among plant organs. Furthermore, nonlinear estimation techniques may contribute to determining of the economic information in plant growth mechanism. In this study, Richards growth model is found to be suitable models to fit maize leaf growth data.
Boron toxicity is an important disorder that can limit plant growth on soils of arid and semi arid environments throughout the world. A general antagonistic relationship between boron excess and salinity has been observed. We determined that low boron level affected negatively maize cultivar. The activity of specific membrane components can be influenced directly by boron toxicity, regulating the water uptake and water transport. Generally, effects of boron toxicity decreased dry matter accumulation and seed yield. But, growth model determined better this situation than normal boron level. In future, more extensive studies may be done on this subject of considerable importance.
REFERENCES
Bolan˜os, L., K. Lukaszewski, I. Bonilla, and D. Blevins. (2004). Why boron? Plant Physiol. Biochem. 42:907–912.
Cartwright, B., K. G. Tiller, B. A. Zarcinas and L. A. Spouncer, (1983). The Chemical Assessment of the Boron Status of Soils. Aust. J. Soil Res., 21: 321-332.
Goldbach, H. E. (1997). A critical review on current hypothesis concerning the role of boron in higher plants: Suggestions for further research and methodological requirements. J. Trace Microprobe Tech. 15:51–91.
Goldberg, S. (1997). Reactions of Boron with Soils. In Plant and Soil. Proceedings eds. R.W. Bell and B. Rerkasem, pp.193:35-48. Kluwer Academic Publ., Dordrecht, The Netherlands.
Goldberg, S., and H. S. Forster. (1991). Boron sorption on calcareous soils and reference calcites. Soil Sci., 152: 304–310.
Gupta, U. (1979). Boron nutrition of crops. Advances in
Agronomy 31: 273–307.
Huo-yan,W.,W.Yun-hua, Du. Chang-wen, Xu. Fang-sen, andY.Yu-hua. (2003). Effects of boron and calcium supply on calcium fractionation in plants and suspension cells of rape cultivars with different boron deficiency. J. Plant Nutrition 26 (4): 789–806.
Ismail, A. M. (2003). Response of maize and sorghum to excess boron and salinity. Biologia Plantarum. 47(2): 313-316.
Kakar, K.M., M. Tariq, M.R. Tareen, W. Ullah, (2002). Shoot Growth curve analysis of wheat (Triticum
aestivum L.) receiving different levels of boron
and iron. Pakistan J. Agronomy, 1(1):47-48. Kanwal, S., R.T. Aziz, M.A. Maqsood, N. Abbas, (2008).
Critical Ratio of Calcium and Boron in Maize Shoot for Optimum Growth. J. Plant Nutrition, 31: 1535–1542,
Ma, L., F. P. Gardner and A. Selamet (1992). Estimation of leaf area from leaf and total mass measurements in Peanut. Crop Sci. 32:467-471. Moraghan, J. T., and H. J. Mascagni (1991).
Environmental and soil factors affecting micronutrient deficiencies and toxicities. In:
Micronutrients in Agriculture, 2nd ed, eds. J. J.
Mortvedt, F. R. Cox, L. M. Shuman, and R.M. Welch, pp. 371–425. Madison, WI: SSSA. Palta, Ç. (2006). Orta Anadolu Bölgesinde Hibrit Mısır
Çeşitlerinin Bor Toksisitesi ve Noksanlığına Tepkilerinin Belirlenmesi. Selçuk Üniversitesi, Fen Bilimleri Ens. Doktora Tezi. Konya. Palta, Ç., S.Gezgin and U. Karadavut, (2008). Effects of
boron toxicity on dry matter accumulation of corn. 4. Ulusal Bitki Besleme ve Gübre Kongresi. 8-10 Ekim 2008, s; 351-358. Konya Pelerin, S. and A. Mollier, (2001). How to include
mineral nutrition in crop growth models? The example of phosphorus on maize.Plant nutrition – Food security and sustainability of agro-ecosystems. W. J. Horst et al. (Eds.),P; 110–111.
Reid, R. J., J. E. Hayes, A. Post, J. C. R. Stangoulis and R. D. Graham, (2004). A critical analysis of the causes of boron toxicity in plants. plant cell and environment 27 (11): 1405-1414.
Richards, F. S. (1969). The quantitative analysis of growth. In: Plant Physiology: A treatise. Ed: Steward, F.S. Academic Pres, New York, Vol; 5:3-77.
Torun, A. A., A. Yazıcı, H. Erdem and İ. Çakmak, (2006). Genotypic Variation in Tolerance to Boron Toxicity in 70 Durum Wheat Genotypes. Turk J Agric Forestry, 30:49-58.