İSTANBUL BİLGİ ÜNİVERSİTESİ SOSYAL BİLİMLER ENSTİTÜSÜ İKTİSAT DOKTORA PROGRAMI
THREE ESSAYS IN FINANCIAL MARKETS
Serkan Yüksel 111806004
Danışman: Prof. Dr. Ege Yazgan
İSTANBUL 2017
i
ACKNOWLEDGEMENTS
I would like express my gratitude to all the people who contributed in some way to the work in this thesis. First and the most, I would like thank my academic advisor Professor Ege Yazgan for his sincere endeavours not only in the process of accomplishment of this thesis but also in the development my academic career from the early years of my undergraduate studies. His diligent efforts and his role model of being educationalist have been the very foundational aspect of my aspiration to be academician. It has been great honour and fortune for me to be his student both at undergraduate and graduate level. He has been always tremendous mentor for me. I am beyond words of gratitude to you for your meritorious encouragement, patience, guidance and valuable comments during the preparation of this thesis. Besides my advisor, I would also like to thank the rest of my thesis committee members, Associate Professor Koray Akay, Associate Professor Cenktan Özyıldırım, Associate Professor Hüseyin Kaya and Assistant Professor Nihat Gümüş for both serving as my committee members and directing me in my graduate studies. I also thank you all for making my defence an enjoyable moment and much enriched academic discussion. Your brilliant comments and suggestions have made remarkable contributions to my thesis.
I also thank to my both academic and professional colleagues whom I shared the studies with. Their collaboration, valuable comments and selfless efforts have made important contribution to my thesis.
A special thanks goes to my family. Words are meaningless at expressing how grateful I am to them for everything they have endured throughout my studies from all the beginning. I am countlessly indebted to my wife for her praiseworthy love and support that she brings into my life.
ii CONTENTS
1. INTRODUCTION ... 1
2. ANALYSIS OF CROSS-CORRELATIONS BETWEEN FINANCIAL MARKETS AFTER THE 2008 FINANCIAL CRISIS ... 5
2.1 Introduction and Literature Review ... 5
2.2 Methodology ... 6
2.3 Data and the Results ... 10
2.3.1 Eigenvalue Analysis ... 10
2.3.2 Eigenvector Analysis ... 12
2.3.3 Global Market Mode ... 13
2.3.4 Relation between Volatility and Correlation ... 14
2.3.5 Time-Varying Largest Eigenvalue... 17
2.3.6 Correlation-Based Financial Network Analysis ... 17
2.3.7 Centrality Measures ... 20
2.4 Discussion... 23
2.5 Concluding Remarks ... 24
3. TRADING PUZZLE, PUZZLING TRADE ... 26
3.1 Introduction and Literature Review ... 26
3.2 Review of Behavioural Biases in Financial Markets ... 36
3.2.1 Overconfidence ... 36
3.2.2 Regret Minimization ... 37
3.2.3 Representativeness Bias ... 38
3.2.4 Frame Dependence ... 38
iii
3.2.6 Self-Serving Bias ... 40
3.2.7 Herding Behaviour ... 41
3.2.8 Loss Aversion ... 42
3.3 Data and Methodology ... 43
3.3.1 Data Specifications ... 43
3.3.2 Methodology and Regressions... 45
3.3 Results ... 48
3.4 Concluding Remarks ... 53
4. CAUSAL LINK BETWEEN ISLAMIC AND CONVENTIONAL BANKING: EVIDENCE FROM TURKISH BANKING SECTOR ... 55
4.1 Introduction ... 55
4.2 Islamic Finance and Applications ... 58
4.2.1 Musharakah ... 60 4.2.2 Mudarabah ... 61 4.2.3 Murabahah ... 63 4.2.4 Ijarah ... 65 4.2.5 Salam ... 67 4.2.6 Istisna ... 69
4.3 Literature Review on Islamic versus Conventional Finance ... 70
4.4 Risks in Islamic Banking and Conventional Banking ... 72
4.4.1 Risk Structure comparisons: General Risk Structure Comparison .. 73
4.4.2 Risk Structure comparisons: Risks that are Unique to IFS ... 78
4.5 Data and Methodology... 79
4.6 Results ... 81
4.7 Concluding Remarks ... 84
iv
6. REFERENCES ... 89
7. FIGURES ... 104
8. TABLES ... 131
v LIST OF FIGURES
Figure 2.1 Empirical vs. Theoretical Eigenvalue Distribution... 104
Figure 2.2(a) Simulation Finite size vs. Theoretical Eigenvalue Distribution... 104
Figure 2.2(b) Simulation Fat Tails vs. Theoretical Eigenvalue Distribution ... 105
Figure 2.3(a) Nearest Neighbour Spacing Distribution of Eigenvalues ... 105
Figure 2.3(b) Next-Nearest Neighbour Spacing Distribution of Eigenvalues ... 106
Figure 2.4 Number Variance ... 106
Figure 2.5 Density Components of the Normalized Eigenvectors ... 107
Figure 2.6(a) Kurtosis Component of Each Eigenvector ... 108
Figure 2.6(b) Skewness Component of Each Eigenvector ... 108
Figure 2.7(a) Contributions of Stock Markets: Components of the Largest Eigenvector ... 109
Figure 2.7(b) Contributions of Stock Markets: Eigenvector Corresponding to 50th Eigenvalue ... 110
Figure 2.7(c) Contributions of Stock Markets: Components of the Smallest Eigenvector ... 111
Figure 2.8 MSCI country World Index Returns vs. Global Market Mode ... 112
Figure 2.9(a) IPR of the Eigenvectors ... 112
Figure 2.9(b) PR of the Eigenvectors... 113
Figure 2.10(a) Global Volatility vs. Global Correlation ... 113
Figure 2.10(b) Global Volatility (Moving Window) vs. Global Correlation... 114
Figure 2.11(a) Kurtosis of Returns Obtained from a Moving Window ... 114
Figure 2.11(b) Skewness of Returns Obtained from a Moving Window ... 115
Figure 2.12 Time-Varying Largest Eigenvalue of the Correlation Matrix Obtained from 1-Year Length Rolling Window ... 115
Figure 2.13(a) Minimal Spanning Trees of 2005-2007 (Period 1) ... 116
Figure 2.13(b) Minimal Spanning Trees of 2009-2012 (Period 2) ... 117
Figure 2.14(a) Ultrametric Hierarchical Trees of 2005-2007 (Period 1) ... 118
Figure 2.14(b) Ultrametric Hierarchical Trees of 2009-2012 (Period 2) ... 119
Figure 2.15 Frequency Distribution of Node Degree ... 120
Figure 2.16 Frequency Distribution of Node Strength ... 120
Figure 2.17(a) Frequency Distribution of Eigenvector Centrality (Period 1) .... 121
Figure 2.17(b) Frequency Distribution of Eigenvector Centrality (Period 2).... 121
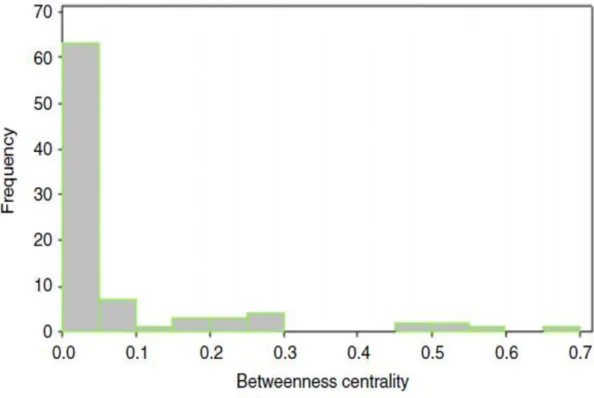
Figure 2.18(a) Frequency Distribution of Betweenness Centrality (Period 1) .. 122
Figure 2.18(b) Frequency Distribution of Betweenness Centrality (Period 2) .. 122
Figure 2.19(a) Frequency Distribution of Closeness Centrality (Period 1) ... 123
Figure 2.19(b) Frequency Distribution of Closeness Centrality (Period 2) ... 123
Figure 3.1 Portion of Individual Investors in Market Capitalization and Monthly Traded Value ... 124
vi
Figure 3.3 Portfolio Sizes of Individual Investors in Data ... 125
Figure 3.4 Relationship between Turnover and Return ... 125
Figure 3.5 Relationship between Portfolio Size and Return ... 126
Figure 4.1 Profit Loss Sharing Ratios for Islamic Banks ... 126
Figure 4.2 Term Deposit Rates for Conventional Banks ... 127
Figure 4.3. Impulse Response Functions for 2002-2013 Period ... 128
Figure 4.4 Impulse Response Functions for pre-Crisis Period... 129
Figure 4.5 Impulse Response Functions for post-Crisis Period ... 130
Figure 3.6 Portfolio Size Comparison ... 149
Figure 3.7 Portfolio Age Comparison ... 150
Figure 4.6 Impulse Response Functions for 2002-2013 Period (3 Months Maturity) ... 153
Figure 4.7 Impulse Response Functions for 2002-2013 Period (6 Months Maturity) ... 154
Figure 4.8 Impulse Response Functions for 2002-2013 Period (12 Months Maturity) ... 155
vii LIST OF TABLES
Table 2.1 Markets with Highest Node Degrees... 131
Table 2.2 Markets with Highest Node Strength ... 132
Table 2.3 Markets with Highest Eigenvector Centrality ... 132
Table 2.4 Markets with Highest Betweenness Centrality ... 133
Table 2.5 Markets with Highest Betweenness Centrality ... 133
Table 3.1 Demographic Characteristics of Data Set ... 134
Table 3.2 Descriptive Statistics by Age, Gender and Portfolio Sizes ... 134
Table 3.3(a) Turnover and Return Performance of Individual Investors ... 135
Table 3.3(b) Winners and Losers ... 136
Table 3.4 Return Performances and Turnover Ratios ... 137
Table 3.5 Return Performances and Portfolio Size ... 138
Table 3.6 Relationship between Portfolio Size and Return ... 139
Table 3.7 Cross Sectional Regression of Return ... 140
Table 3.8 Cross Sectional Regression of Return ... 141
Table 4.1 Balance Sheet comparison of Islamic and Conventional Banks ... 142
Table 4.2 Risk Perception for Islamic Finance Products ... 143
Table 4.3 Unit Root Tests for both Islamic and Conventional Banks ... 144
Table 4.4 Granger Causality for both Islamic and Conventional Banks on Difference TDRs ... 145
Table 4.5 Granger Causality Tests for both Islamic and Conventional Banks pre-2008 Crisis ... 145
Table 4.6 Granger Causality Tests for both Islamic and Conventional Banks post-2008 Crisis ... 146
Table 2.6 Analyse Market Exchanges in Selected Countries ... 147
Table 3.9 Individual Investors’ Detailed Portfolio Information ... 150
Table 3.10 Individual Investors Total Portfolio Size ... 151
Table 3.11 City of Residence of Individual Investors’ ... 151
Table 3.12 Age Interval of Individual Investors ... 152
viii
ABBREVIATIONS
AAOFI: Accounting and Auditing Organization for Islamic Financial Institutions ACWI: All Country World Index
ADF: Augmented Dickey-Fuller Test BIS: Bank for International Settlements BIST: Borsa İstanbul
CAPM: Capital Asset Price model
CBRT: Central Bank of the Republic of Turkey EU: European Union
IAH: Investment Account Holders IFI: Islamic Financial Institutions IFSB: Islamic Financial Services Board
IIFS: Islamic Institutions and Financial Services IPR: Inverse Participation Ratio
LIBOR: London Interbank Offered Rate MENA: Middle East and North Africa MKK: Merkezi Kayıt Kuruluşu
MSCI: Morgan Stanley Capital International MST: Minimal Spanning Tree
OLS: Ordinary Least Squares PLS: Profit Loss Sharing Ratio RMT: Random Matrix Theory SIC: Schwartz Information Criteria TDR: Term Deposit Rates
UHT: Ultrametric Hierarchical Tree VAR: Vector Autoregression
ix ABSTRACT
This dissertation thesis focus on financial markets using various econometric applications. Main goal of this thesis to address various questions in financial markets especially within the effects of 2008 financial crisis. Three essays included in this thesis focus on financial econometrics, behavioural finance and Islamic Finance.
The first essay applies Random Matrix Theory in order the map of correlations between the global financial markets. The cross-correlation matrix C of the index returns of the main financial markets analysed by using methods of Random Matrix Theory. Cross-correlation matrix properties studied for both periods: before the 2008 crisis and after. The effect of 2008 crisis on the financial markets traced by the interactional change between the financial markets. We test the eigenvalues of C for universal properties of random matrices and find that the majority of the cross correlation coefficients arise from randomness. However, we also show that eigenvector of the largest deviating eigenvalue of C represents true information about all the market characteristics. Results present that high correlation exists between collective market movement and volatility indicating that, diversification cannot be helpful to reduce systematic risk in times of crises. We identify and compare the connection and cluster structure of markets before and after the crisis using minimal spanning and ultrametric hierarchical trees. We find that after the crisis, the co-movement degree of the markets increases. Results indicate that cross-correlation between markets are not totally random hence there exist a non-linear relationship between financial markets. Moreover, the non-linear relationship between the financial markets increases after the 2008 crisis. We have identified connection structure of cross-correlation of financial markets. Our findings indicate that the connection structure includes some leader markets that has been followed by other markets. Spill over effect of the crisis has been represented by the ultrametric hierarchical trees. Moreover, our results show that the connection structure has greatly changed after the global financial markets.
x
These results have important implications to support the argument that global interdependence of the stock markets is time varying and the connection structure changes after the 2008 crisis.
With the scope of the financial market interactions result indicated in first essay, the second essay focuses on the internal market factors. In the second essay, we tried to understand the market nature of anomalies that have important role in the elevation of the crisis. Since the market movements are consequences of human judgment, interactions and behaviour, the relationship between return performance of the individual investors and their investment patterns is analysed. We examine the return performance of individual investors with respect to various factors such as portfolio size, turnover, holding period and also demographic factors: gender and age. The daily trades in Borsa İstanbul (formerly Istanbul Stock Exchange) of 20,000 individual investors over two year period 2011-2012. Utilizing a weekly data set, we bring new evidence to the current debates on individual investors’ trading patterns. First the Capital Asset Pricing Model (CAPM) regression has been applied. Then the Ordinary Least Square (OLS) has been used via a cross section regression of the returns on the before mentioned variables. Our findings can be summarized as follows: There is a positive relationship between holding period and return up a certain return level. The return of the individual portfolio is positively correlated with the portfolio size. The return of the individual portfolio is positively correlated with the portfolio size. Almost 70% of all individual investors cannot beat the market. Investors who have high turnover underperform compared to those who have lower turnover. Male investors trade more and lose more vis-à-vis the female and older investors have higher returns. Hence the behavioural aspects of the individual investors affect the return performance. Behavioural biases have important effect on the return performance of the individual investor portfolios. As a result behavioural biases creates discretions that results deviation from the market efficiency which has played major role in elevation of the global financial crisis. Our findings indicate that behavioural biases has been important reason for the higher trading paradigm in financial markets which played catalyser role in escalation of the 2008 crisis.
xi
Third study focuses on the alternative finance paradigm such as Islamic finance. Inappropriate risk pricing experience during the global financial crisis triggered the research on alternative finance paradigms. Asset based nature of Islamic finance potentially could prevent the toxic debt based finance models. However the Islamic finance represents the very limited portion of global finance assets. Hence the how much Islamic finance is different from the conventional finance models is the main question that should be answered in order to mitigate more on alternative finance methods. Third study provides analysis to determine the relationship between Islamic finance and conventional finance. By looking at the causal relationship between the deposit returns of both Islamic banks (profit-loss-sharing ratio substitute for deposit rates for Islamic finance) and conventional banks, we try to map the causal link between two. Returns in the conventional banking expected to be heavily influenced by the interest rate in the money market. However, Islamic banking returns are interest-free so that interest rate changes are not expected to affect the profit-loss sharing ratio in Islamic banks. Interest rates in the economy is a proxy to highlight the general risk level of the economy. By looking at the causal relationship between the deposit returns of both Islamic banks and conventional banks, it is possible to address the different types of banking in the general risk structure of the economy. We apply Vector Auto Regression (VAR) model and use Granger causality to term deposit rates of Islamic and Conventional Banking. We extend the analysis into pre and post 2008 crisis to address the potential causality effect of the 2008 crisis. Our results suggest that there is no significant relationship between both banking sectors. We report that inferences from pairwise Granger causality alone might be spurious since the analysis based on non-stationary series can be consequence of time functional characteristics of the time series. By subsampling the data for pre and post-crisis periods, Granger causality is rejected. Our results provide evidence that the Islamic finance methods are different from the conventional finance. Interdependence between these two financial models are limited. Moreover the relationship structure greatly changes after the crisis experience which provides further inside that the Islamic finance
xii
model can be important candidate to reduce market frictions that has raised the crisis experience into global economic crisis.
JEL classification: G02; G12; G14; G15; Z12
Keywords: Cross-correlations, Random matrix theory, Complex systems, Minimal spanning tree, Centrality measures, Individual Investor, Turnover, Portfolio Size, Stock Returns, Holding Period, Islamic Banking, Systematic Risk, Granger Causality, Term Deposit Rates, Vector Auto Regression
xiii ÖZET
Bu tez, farklı ekonometrik modeller kullanarak finansal piyasalardaki bazı sorulara ilişkin üç temel çalışma içermektedir. Tezin ana amacı, 2008 krizi sonrasında finansal piyasalarda ortaya çıkan gelişmeleri incelemek ve finansal piyasalarda yaşanan değişimler sonrası ortaya çıkan sorulara dair yanıtlar getirmektir. Bu tezi oluşturan üç makale sırasıyla finansal ekonometri, davranışsal finans ve İslami finans alanlarında literatüre katkı sağlamaktadır.
İlk makalede “Rastsal Matriks Teorisi” uygulanarak, küresel piyasalarda 2008 krizi öncesi ve sonrasında korelasyon haritası çıkarılmış, ve bu korelasyon etkileşim haritası etkileşim incelenmiştir. Küresel piyasalardaki endeks getirilerinden oluşturulan kesit korelasyon matriksi C’nin yapısı, Rastsal Matriks Teorisi metodu ile incelenmiştir. Böylelikle 2008 krizinin finansal piyasalara etkisi araştırılmıştır. Bu C matriksinin yapısı hem kriz öncesi dönem, hem de kriz sonrası dönemde incelenmesi ile birlikte krizin finansal piyasalarda etkileşim yapısında ne gibi değişikliklere neden olduğu gözlenmiştir. C matriksinin karakteristik köklerinin (özdeğerleri) Rastsal Matriks özelliklerine sahip olup olmadığı test edilmiş ve bu karakteristik köklerin çoğunlukla rastsallık teorisine uygun özellikleri sahip olduğu saptanmıştır. Rastsallık Teorisi’nden ayrışan karakteristik kök bulunarak, bu karakteristik köke ait karakteristik vektörün tüm market etkileşim bilgisini içeren vektör olduğu gösterilmiştir.
Bulgular, finansal piyasalarda yüksek korelasyonun olduğunu, böylelikle finansal piyasaları etkileyen şokların bir piyasadan diğerine kolayca aktarıldığını göstermektedir. Ayrıca, özellikle kriz dönemlerinde “yayılma etkisi” ile bir piyasada gözlenen volatilitenin, diğer piyasalara sıçradığı saptanmıştır. Böylelikle sistematik yapısal riskten portföy çeşitlendirmesi ile kaçınmanın çok da mümkün olmadığı gözler önüne serilmiştir. Piyasalar arasında yüksek korelasyonun yüksek volatilite dönemlerinde daha da arttığı saptanmış, ve kollektif piyasa hareketinin tüm piyasaları kapsadığı sonucuna varılmıştır. Çalışmada bağlantı ve kümelenme yapısı “Minimal Kümelenme Haritası Ağaçları” ve “Ultrametrik Hiyerarşi
xiv
Ağaçları” yöntemleri ile ortaya konulmuştur. Bu bağlantı haritası kriz öncesi ve kriz sonrası olmak üzere iki ayrı dönem için incelenmiştir. Çalışma sonuçlarına göre, 2008 krizi sonrası finansal piyasalarda entegrasyon artmıştır. Bu duruma ek olarak, lineer olmayan korelasyon ilişkisinde 2008 krizi sonrasında artışlar gözlenmiştir. Kesitsel korelason ilişkisi tamamen rastsal olmayıp, bu linear olmayan ilişkide takip edilen öncü piyasalar olduğu ortaya konulmuştur. Linear olmayan ilişki yapısının haritası çıkarılmış ve bu harita üzerinde etkileşim ağacı oluşturulmuştur.Etkileşim ağacında kriz öncesi ve sonrası yayılma etkisi Ultrametrik Hiyerarşi Ağaçları yöntemi ile gösterilmiştir. Tüm bu bulgular, 2008 krizinin nasıl yayıldığı ve kriz sonrasında değişen etkileşim ve korelasyon yapısını gözler önüne sermek ve küresel bağımlılığın kriz sonrası arttığı hipotezini desteklemek açısından literatüre önemli katkılar sağlamaktadır.
İlk çalışmada finansal piyasların küresel etkileşimi ve krizin yayılma yapısının gösterilmesi ardından, ikinci makalede finansal piyasaların içsel yapısı incelenmiştir. Özellikle krize neden olarak gösterilen piyasaların işleyişinde ortaya çıkan anomaliler ikinci makalede konu edilmiştir. Piyasalarda nominal değişkenler aslında insanların karar mekanizmaları ve davranışları sonucunda ortaya çıkan parametrelerdir. Bu parametreler içinde finansal piyasalarda etkin piyasa hipotezinin öngördüğünden fazla sayıda işlem yapılması en temel piyasa anomalisi olarak karşımıza çıkmaktadır. Özellikle kriz sonrasında gelişen davranışsal finans literatüründe bu husus çokça gündeme gelmiştir.
İkinci makalede, küresel piyasalar içinde en fazla işlem yapılan piyasalar arasında yer alan Türkiye’nin tek sermaye piyasası işlem platformu olan Borsa İstanbul’da işlem yapan bireysel yatırımcılar çalışılmıştır. Literatürde bahsedilen fazla işlem anomalisin net bir şekilde gözlendiği Borsa İstanbul’da bireysel yatırımcıların portföy yapıları incelenerek, bu bireysel yatırımcıların fazla işlem anomalisine neden olan karakteristik yapı ortaya konulmuştur. Yatırımcıların portföy işlem hacimlerine göre getirileri karşılaştırılmış ve işlem sayısı ile portföy getirisi arasında negatif ilişki olduğu saptanmıştır. Bu durum, davranışsal finans
xv
literatüründe konu edilen “aşırı güven” sendromunun Borsa İstanbul’da da gözlendiğini ortaya koymuştur.
2011-2012 yılları arasında işlem yapan yirmibin bireysel yatırımcı örnekleminin portföy getirisi, portföy büyüklüğü, portföy saklama zamanı ve demografik özellikler açısından kategorize edilmiştir. CAPM Modeli uygulanarak bireysel yatırımcıların piyasa ortalamasından daha kötü protföy getirisi elde ettiği ortaya konulmuştur. Kesit regresyon yöntemleri ile farklı parametreler için portföy getirisi ile ilişkileri incelenmiştir.
Bulgular, portföy saklama zamanı ile portföy getirisi arasında pozitif ilişki olduğunu göstermektedir. Böylelikle al-sat yapmayan bireysel yatırımcıların ortalamadan daha iyi portföy getirisi elde ettiği gözlenmiştir. Bu durum da, davranışsal finans literatüründe belirtilen “aşırı güven” davranışsal yanılmasının, aşırı al-sat yapmaya neden olduğu savı ile uyumludur. Aynı zamanda çalışmamızda bu davranışsal yanılmanın getiri performansını olumsuz etkilemekte olduğu sonucuna varılmıştır. Bu durum, portföy devir süratı açısından da incelendiğinde, yüksek portföy devir süratıne sahip bireysel yatırımcıların (çok al-sat yapan yatırımcılar) ortalama getirilerinin genel ortalamanın altında kaldığı sonucumuz ile benzeşmektedir.
Farklı demografik özelliklere göre de portföy performansı kesit regresyonlar yöntemi ile incelenmiştir. Tüm sonuçlar, demografik özelliklere göre davranışsal yanılmaların şiddetinin farklılaştığı ve tüm bu davranışsal yanılmaların bireysel yatırımcıları etkin piyasa hipotezindeki varsayımın dışında davranmaya ittiğini göstermektedir. Bu makale, davranışsal yanılmaların fazla işlem yapma paradigmasının en önemli nedenleri arasında olduğuna dair davranışsal finans literatürüne katkı sağlamaktadır. Ayrıca genel olarak 2008 finansal krizi değerlendirildiğinde, krizin şiddetinin artmasında temel etken olan aşırı işlem hacmi paradigmasının davranışsal finansal yanılmaları sebebiyle gerçekleştiği yönünde bulguları da ortaya koymaktadır.
Üçüncü makalede, 2008 krizi sonrasında gündemde daha çok yer tutmaya başlayan İslami Finans modeli üzerine çalışmaya yer verilmiştir. Özellikle küresel
xvi
kriz tecrübesinde, doğru fiyatlanmayan risklerin yol açtığı finansal yapıların sorgulanması ile birlikte İslami Finans gibi alternatif finans modelleri gündeme gelmiştir. İslami Finans’ın varlığa dayalı finans modeli ürünleri, kriz esnasında toksik borçlanma sertifikalarına alternatif olması ve daha sağlıklı finans modeli sağlama potansiyeli, bu finans modeline duyulan ilgiyi artırmıştır. Ancak İslami finans varlıkları küresel finans varlıklarının çok sınırlı bir kısmını kapsamaktadır. Bu açıdan bu varlıkların küresel finans varlıkları ile olan ilişkisi incelenmesi gerekmektedir. Bu açıdan, alternatif modeller değerlendirlirken, var olan finans modelinden ne kadar farklılaştığı sorusu gündeme taşınmıştır. Bu soruya yanıt bulmak için, üçüncü makalede İslami Finans’ın konvansiyonel finanstan ne kadar ayrıştığı hususunda çalışmaya yer verilmiştir.
İki finans alternatifi arasında nedensellik ilişkisi “Granger Nedenselliği” metodu ile incelenmiştir. İncelemede konvansiyonel bankacılığın mevduat oranları ile İslami bankacılığın kar-zarar ortaklığı rasyosu kullanılmıştır. Konvansiyonel bankacılığın meduat oranları para piyasalarıdaki faiz getirilerine göre oluşmaktadır. Böylelikle, piyasa riski etkisi direkt olarak mevduat oranlarına yanısmaktadır. İslami bankacılıkta ise faiz yasaklanmıştır ve bu yüzden teorik olarak kar-zarar ortaklığı oranı verilen kredilerin kazanç-kayıp ortalamalarına göre oluşmaktadır. Bu iki parametre arasındaki ilişki, iki finans alternatifinin piyasa risklerinden ne kadar farklı etkilendiğine dair bilgi içermektedir. Küresel risk yapısı içinde bu iki modelin ne kadar ayrıştığını ya da benzeştiğini görmek için nedensellik analizleri yapılmıştır. Ayrıca, Vektör Otoregresif (VAR) ekonometrik modelleme ile, konvansiyonel bankacılığa gelen şokların İslami bankacılığı ne kadar etkilediği test edilmiştir. Benzer şekilde yine aynı model yöntemi ile İslami bankacılığa gelen şokların da konvansiyonel bankacılığı ne kadar etkilediği test edilmiştir. Böylelikle aynı piyasada birlikte var olan finans alternatiflerinin birbirlerinden ne kadar etkilendiği sorusuna dair yanıt aranmıştır. Analiz 2008 krizi öncesi ve sonrası dönem için de ayrı ayrı yapılarak, kriz tecrübesi sonrasında nedensellik yönünün nasıl etkilendiği sorgulanmıştır.
xvii
Bulgularımıza göre Granger Nedenselliği uzun dönemde iki taraflı reddedilmiştir. Zaman serilerinin durağanlaştırılması sonrasında uygulanan analizlerde VAR parametreleri de bu sonucu desteklemektedir. Böylelikle İslami finans modelinin konvansiyonel finans modelinden farklılaşmadığı argümanına ters kanıt elde edilmiştir. Ayrıca, nedensellik analizlerine kriz öncesi ve sonrası için yinelendiğinde, kriz sonrasında nedensellik ilişkisinin daha çok reddedildiği gözlenmiştir. Bu durum, kriz sonrasında alternatif finans modeli olarak İslami Finans’ın farklı bir paradigma getirme potansiyeli olduğu argümanını desteklemektedir.
JEL Klasifikasyonu: G02, G12, G15, Z12
Anahtar Kelimeler: Kesit Korelasyon, Rastsal Matriks Teorisi, Komplike Yapılar, Minimal Kapsama Ağacı, Bireysel Yatırımcılar, Portföy Analizleri, Davranışsal Finans, Risk Yapısı, İslami Finans, Sistematik Risk, Granger Nedenselliği, Vetor Otoregresyon Analizi.
1
1. INTRODUCTION
The crisis that we have experienced in 2008 has been important cornerstone in global financial markets. It has triggered many academic and practical questions. Effects of the financial crisis have transformed into global level which generally accepted to be the great recession. Main economic paradigms have been revisited and wide array of new research have aroused to discuss effects and the reasons of the crisis. This thesis correspondences to the growing literature that analyse the 2008 crisis environment. The thesis provides applied research on financial markets. Main contribution of this thesis is to address various questions raised within the global financial crisis experience. The results of this study gives important insides about the how the financial crisis spread from one market to another, market anomalies that has played significant role in the development of the financial crisis. This thesis also discusses the alternative finance paradigm such as Islamic Finance in order to elaborate on the alternative finance models that could limit the negative effects of the 2008 crisis. Three field of studies -risk analysis, behavioural finance and Islamic Finance- conducted using various econometric modelling and applications.
First study focuses on the financial market integration. 2008 crisis thought us that the market connection could easily extend the effect of a crisis into global level. In first essay we try to understand the global interconnection between the markets. Since the markets are connected to each other in many aspects, a linear analysis would not be complete to determine the potential relationship matrix. Hence we have taken advantage of the benefits of Random Matrix Theory which roughly enables identifying the cluster structure of financial markets. We have found that global financial markets are connected to each other in a way that random relationship hypothesis can be rejected. Further on these findings, we tried to find the relationship cluster leaders between the markets. Our findings indicate that the relationship matrix before and after the crisis experience has changed. Main contribution of the study is to determine the connection structure of the markets to
2
denote main financial centers. Denoting such a map would help to identify the spill over effect of the any financial crisis. Study also contributes to the literature by showing the difference of cluster connections before and after the financial crisis. Mapping the time varying nature of the connection structure would be beneficial to further study on the channelling the evolution of the connection structure of the financial markets.
After analysing the general market integration, this thesis concentrate on the micro-finance drivers behind the 2008 financial crisis. There is growing literature of behavioural finance which focus on the behavioural biases in the market which have deepened the effect of the crisis. From the global network of the crisis, these biases have been catalyser in the demolishing effects of the crisis. We concentrate on the financial market anomalies especially related to individual investor level biases. Return performance of the investor was the main behavioural aspect of the financial markets. Concerning on the portfolio choices of the individual investors, we analyse the Capital Asset Price Model (CAPM) assumptions. Under the efficient market hypothesis, assets should be priced effectively and the individual investors should react to these effective prices. However high trading level of the stock market was claimed to be inconsistent with the rational expectation models. Analysing such within market anomaly would help to understand micro-financial level biases that accumulated in the financial crisis experience.
Further on, the statistical characteristics of the return performance represented. Return performance of the individuals have been categorized for different demographic specifications. To best of our knowledge, this study is the first study that analyses the individual level data contains the whole financial market investors. The portfolio returns of the individuals are calculated weekly contrary to the most of the literature which use monthly aggregated data. We also differ from most of the studies utilizing a sample from the official depository agency of the country, not a single securities firm.
In third study, the causality between Islamic and conventional finance methods has been questioned. With the 2008 crisis experience, toxic assets nature
3
of the conventional finance was the main driver of the 2008 financial crisis. Debate on the alternative finance methods that does not have toxic property became main debate topic. Alternative asset structures came into consideration and due to its asset based nature Islamic finance become hot topic. The question: “if the alternative Islamic finance paradigm would be important portion of global assets, would the effect of the crisis be limited than the experience that we have faced?” came into consideration by the literature. Though Islamic finance assets represents very limited portion of the global finance markets, studies on Islamic finance has extended. This study is one of the few invocative studies in Islamic finance literature. The difference of the Islamic finance from the conventional finance has not been studied extensively.
Islamic banking and conventional banking are considered to be different kind of sources for funding. Returns in the conventional banking expected to be heavily influenced by the interest rate in the money market. However, Islamic banking returns are interest-free so that interest rate changes are not expected to affect the deposit returns in Islamic banks. Interest rates in the economy is a proxy to highlight the general risk level of the economy. By looking at the causal relationship between the deposit returns of both Islamic banks and conventional banks, it is possible to address the different types of banking in the general risk structure of the economy.
Third study tried to reveal the relationship between conventional finance and Islamic finance. In order to analyse causality, it is needed to study financial market which includes both financing methods. Hence Turkey would be one of the few natural candidates to map the relationship. With using vector auto regressive analysis and Granger Causality for the term deposit rates of two different finance alternatives, the analysis provide to reveal the relationship between two. By doing so, we are able to track the effects of financial crisis on both conventional and Islamic banks. We present comparative analysis on the impact of the global finance crisis of 2008. Pre and post crisis term deposit returns of conventional and Islamic banks are considered. Term deposit rates are considered to be center of financial
4
activities so that our analysis study gives important implications on the risk structure. If Islamic banks are not affected much from the financial crisis, this situation can be taken as an implication that Islamic banks are less prone to the systematic risk.
5
2. ANALYSIS OF CROSS-CORRELATIONS BETWEEN FINANCIAL MARKETS AFTER THE 2008 FINANCIAL CRISIS
2.1 Introduction and Literature Review
The global financial system is composed of a large variety of markets that are positioned in different geographic locations and in which a broad range of financial products are traded. Despite the diversity of markets, index movements often respond to the same economic announcements or market news [Ederington and Lee (1993), Balduzzi and Green (2001), Andersen et al. (2007)] which implies that financial time series can display similar characteristics and be correlated. Since the work of Markowitz (1952), correlations of financial time series are constantly a subject of extensive studies both at the theoretical and practical levels. It is important not only for understanding the collective behaviour of a complex system but also for asset allocation and estimating the risk of a portfolio. In particular since the recent 2008 financial crisis, which originated in the US and then spread to almost all markets in the world, many economists have been studying the correlation structure between financial markets and the transmission of volatility from one to another. One of the major difficulties in these studies are the complicated unknown underlying interactions of the financial markets. As Plerou et al. (2000) indicates, correlations between markets need not be just pairwise but may rather involve clusters of markets and relationship between any two pair may change in time. In earlier times, physicists experienced similar problems. The problem became popular by Wigner’s work in the 1950’s for application in nuclear physics, in the study of statistical behaviour of neutron resonances and other complex systems of interactions. (See also Mehta (1994)). He tried to understand the energy levels of complex nuclei, when model calculations failed to explain experimental data. To overcome this problem, he assumed that the interactions between the constituents comprising the nucleus are so complex that they can be modelled as random. Based on this assumption, he derived the statistical properties
6
of very large symmetric matrices with i.e. entries and the results were in remarkable agreement with experimental data. More recently Random Matrix Theory (RMT) has been applied to analyse the financial time series (Plerou et al. (2000), Shen and Zheng (2009), Junior and Franca (2012)). In particular, correlation matrices are computed for the empirical data and quantities associated with these matrices are compared to those of random matrices. Wilcox (2007) showed the extent to which properties of the correlation matrices deviate from random matrix predications clarifies the status of the information derived from the computation of covariances. The literature focuses on the correlations between individual stocks in a market; however, in this study we will analyse the cross-correlations between 87 main financial markets in the world by tools of RMT.
The rest of the paper is organized as follows; in Section 2.2, we give a brief description of the methodology. Section 2.3 describes the data and contains several results of our analysis; in particular Sections 2.3.1, 2.3.2 and 2.3.4 present the eigenvalue and eigenvector analysis of the correlation matrix with discussion of the relation between volatility and correlation of financial markets. In Section 2.3.6, we construct a correlation based market network and compare the structure before and after the 2008 financial crisis by tools of graph theory. In Section 2.4, we use an alternative approach to the construction of the correlation matrix, present the related results and discuss possible further studies. Finally, Section 2.5 contains some concluding remarks.
2.2 Methodology
To observe the correlations between the index movements of different stock markets, index fluctuations are measured such that the result is independent of the scale of the measurement. Let Pi(t)be the index of the stock market i = 1, 2, . . . , N at time t and t = 0, 1, . . . , T . The logarithmic index return of the ith market index over a time interval t is given by
7 ) ( ) ( ln ) (t P t t P t Ri i i (1)
Each index have different levels of volatility, so we consider the normalized returns
i i i i R R t r ) ( (2)
where i(t) Ri2Ri2 is the standard deviation of R and i ⟨・ ・ ・⟩ is the
time average over the considered period. Then the equal time cross-correlation matrix C is the matrix with elements
i j
ij rr
c (3)
which represents the correlation between returns market indices i and j. By construction, C is symmetric with cij 1 and c takes values from [-1,1]. The ij
elementscij 1, cij 1and cij 0 defines perfect correlation, perfect anti-
correlation and uncorrelated pair of markets respectively. In matrix notation, the interaction matrix C can be written as
t RR T
C 1 (4)
where R is an N ×T matrix with entries rim ri(mt) with i=1,2,...,N; m=1,...,T and
t
R denotes the transpose of R. The stochastic modern approach about the dynamics
of return is given by
dW dt
dRi i i (5)
where dW is a Wiener process with dW following a normal distribution that 0
dW and dW21, iis the mean return and i is the volatility. Therefore the standardized returns r are expected to follow a standard normal distribution. i
8
We will compare the properties of the interaction matrix C with those of a random
cross-correlation matrix.
Random Matrix Theory (RMT) was first introduced by Wishart and RMT studies gained momentum after Mehra’s invention of the orthogonal polynomial method. Statistical properties of the random matrices have been developed in mathematics and physics literature and have been applied to in many disciplines extensively. To summarize general frame of RMT, Letxi(t); i = 1, 2, . . . , N where
) (t
xi are independent, identically distributed random variables. We define the N × T matrix A by elementsait xi(t). The matrix W defined as
t AA T
W 1 (6)
is called a Wishart matrix as explained in detail by Baker at al. (1998), Edelman (1998) and Sengupta and Miltra (1999). Let each xi(t)be normally distributed and rescaled to have zero mean and constant unit standard deviation. Under the restriction,N, T with QT/N1is fixed, the probability density function rm() of eigenvalues of the matrix W as shown in Edelman (1998) and Sengupta and Mitra (1999):
( )( ) 2 ) ( Q max min rm (7) Q Q 1 2 1 1 max min (8)
Where maxmin are the maximum and minimum eigenvalues of W . For the rest of the
paper, the analysed eigenvalues are rank ordered i.e. i j for all i and j i
denote the corresponding unfolded eigenvalues for all i. The distribution of nearest neighbour eigenvalue spacing of W is given by Wigner–Dyson distribution (Guhr et al. (1998))
9 ) 4 exp( 2 ) (s s s2 wmn (9)
wheresi1i. The distribution of next-nearest neighbour eigenvalue spacing of W is given by Brody et. al. (1981):
) 9 64 exp( 3 2 ) ( 6 3 4 2 18 s s s wmn (10)
where s(i2 i)/2. The number variance
2
is defined as the variance of the number of unfolded eigenvalues in the intervals of lengthl , around each i(Brody
et al. (1981) and Guhr et al. (1998)), 2 2 ) ) , ( ( ) (l n l l (11)
Where n( is unfolded eigenvalues in the interval ,l)
l/2,
l/2
and ... denotes an average over all α. For large values of l , the number variance for W behaves like 2 lnland if the eigenvalues are uncorrelated then 2 l(Brody et al. (1981) and Guhr et al. (1998)). Let v be the eigenvector corresponding to the keigenvaluek. We denote the jth component of v as k vk,j. By construction we have
, 2 11
N k j
j v . If we normalize the eigenvectors vk vk ' such that Nj
vk j N 2 , ' 1then the components of each normalized eigenvector v'k have a Gaussian
distribution with mean zero and unit variance should be as follows as noted in Laloux et al. (1999), ) 2 exp( 2 1 ) ( 2 ' ' v v (12)
A useful quantity in characterizing the eigenvectors is the so-called Inverse Participation Ratio (IPR) in Plerou et al. (2001). For the eigenvector v , is defined k
as
N j j k k v IPR 1 4 , (13)10
For our purposes it is sufficient to know that the reciprocal of the IPR quantifies the number of significant components of the eigenvector v . In RMT, the expectation k
of IPR is 3/N since the kurtosis for the distribution of the eigenvector component k
is 3.
2.3 Data and the Results
We analyse daily closing values of 87 main benchmark indexes in the world between 01/01/2009 and 31/07/2012 (data are obtained from Bloomberg). To reflect the market dynamics better, index values are not converted to a single currency. Markets in some countries do not operate on Fridays; in that case Saturdays’ values are considered as Fridays’. If a market is closed on a business day, we carry over the last value. The list of indexes is in the Appendix.
2.3.1 Eigenvalue Analysis
We take t1 day and compute the 87 × 87 cross-correlation matrix C. We have N = 87 and T = 933 giving Q ≈10.73, with theoretical lower and upper limits
48 . 0
min
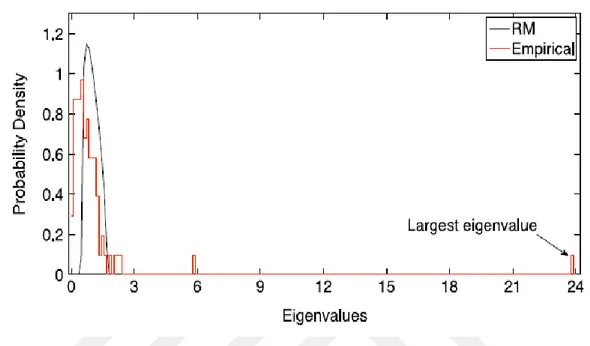
and max 1.71for the eigenvalues of C . First, eigenvalues of C are compared with the theoretical distribution rm() (See Figure 2.1).One immediate thing to note is that the largest eigenvalue of C is 23.8 which is 14 times larger than the theoretical upper limit and stands out from all others. Also a first view suggests the presence of a well-defined bulk of eigenvalues. Although 52%of the eigenvalues fall into the theoretical interval, 93%of the eigenvalues are smaller than max
11
Since the theoretical distribution is valid strictly forN, T , we must test that the deviations for the largest few eigenvalues are not finite size effects as explained in detail by Plerou et al. (2001). First, we construct N = 87 mutually uncorrelated time series generated to have (a) standard normal distribution (as in theory), and (b) identical power-law tails (as in empirical examples in Plerou et al. (1999)) each having length T = 933. Then we compare eigenvalue densities of their cross-correlation matrices with the theoretical distribution (see Figure 2.2(a) and figure 2.2(b)).
[Insert Figure 2.2(a) and 2.2(b) about here]
We find good agreement with the theory suggesting that the deviations of the few largest eigenvalues from RMT in figure 2.1 are not caused by finite size effects or the fact that returns are fat tailed.1 We apply further RMT tests to strength our claim. The first independent test is the comparison of the distribution of empirical nearest neighbour eigenvalue spacing nn(s)with (s)
nn
W
The agreement suggests that the positions of two adjacent empirical unfolded eigenvalues at the distance s are correlated similar to the eigenvalues of W .
The next test is the comparison of the distribution of empirical next-nearest neighbour eigenvalue spacing nnn(s) with (s)
nnn
W
. We demonstrate this correspondence in figure 2.3(a) and figure 2.3(b) which shows a nice agreement between empirical data and the theory.
[Insert Figure 2.3(a) and 2.3(b) about here]
To test for long-range two point eigenvalue correlations, we consider the number variance. It is clear that the number variance of empirical data agrees well
12
with the theory (See Figure 2.4). It can be concluded that the bulk of the eigenvalue statistics of the empirical cross-correlation matrix C are consistent with those of the
real symmetric random matrix W and the deviations from the RMT contain genuine
information about the correlations in the system.
[Insert Figure 2.4 about here]
2.3.2 Eigenvector Analysis
The deviations of eigenvalue statistics from the RMT results suggest that these deviations should also be displayed in the statistics of corresponding eigenvector components (Plerou (1999)). First, we choose some of the normalized eigenvectors and display their component distribution in figure 2.5 which shows that the probability density of eigenvector components corresponding to eigenvalues in the bulk agrees well with the RMT. However, the component distribution of i max shows significant deviation from the theory. In particular (v87' )is almost uniform.
[Insert Figure 5 about here] The kurtosis and skewness of the components of each ' i
v are given in figure 2.6. For the bulk, kurtosis and skewness fluctuate around 3 and 0 respectively which is consistent with normal behaviour. Components of thev87 suggest that most of the financial markets participate in this eigenvector.
[Insert Figure 2.6(a) and 2.6(b) about here]
In addition, almost all components are positive. To have a clear picture, we look at figure 2.7a-c showing the contributions of the stock markets to the eigenvector corresponding to (a) the largest eigenvalue, (b) an eigenvalue from the bulk and (c) the smallest eigenvalue. For the largest eigenvalue, the majority of the markets have positive representations which is an indicative of a common factor that affects almost all markets with the same bias. This gives us a reason to believe
13
that v87 represents a global market itself that is, the result of the interactions between markets. (Please refer to Junior (2012) for determining deviating eigenvector).
[Insert Figure 2.7(a), 2.7(b) and 2.7(c) about here]
2.3.3 Global Market Mode
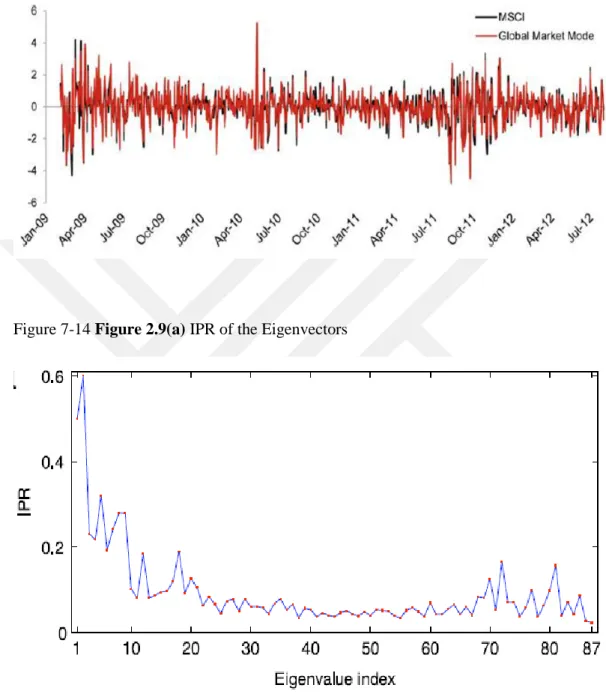
To see if v87 represents a global market itself, we take the projection of the time series Ri(t) on the v87 and compare it with a standard measure of a global performance. In our case, the most related global index is the Morgan Stanley Capital International (MSCI) All Country World Index (ACWI). It is a free-float weighted equity index which includes both emerging and developed world markets. The projection of the time series Ri(t) on v87 is given by the following,
87 1 , 87 ( ) ) ( 87 i i i v t v R t R (14) ) ( 8 7 tRv is usually called the market mode by many studies (Plerou (2001), Bouchaud 2011). (in this study we will call it the global market mode). Figure 2.8 shows a comparison of the global market mode and the returns of the MSCI index (we standardize both series to have zero mean and unit variance).
[Insert Figure 2.8 about here]
We find remarkable similarity between the two return series. The empirical correlation coefficient between them is 0.93. The good agreement shows that v87
corresponds to a global market factor showing the general trend of all market and quantifies the worldwide influence on them (Plerou (1999)).
14
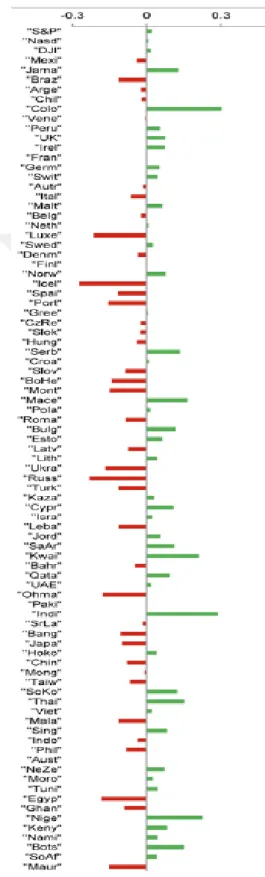
Considering components of v87 we see that the top six contributers are from European countries. On the other hand, the majority of the markets have very small contributions that are proportional to the size and liquidity of these markets. An interesting case is the very small contributions of the big and liquid markets of South Korea, India and Russia. Since the market eigenvector can be considered as a general trend of all markets, this situation can be identified as the positive diversification of these emerging markets from others after the 2008 crisis.
[Insert Figure 2.9(a) and 2.9(b) about here]
For each eigenvector, the number of markets with a significant participation can be accurately quantified by the IPR. Figure 2.9(a) and Figure 2.9(b) shows the IPR and PR as functions of the eigenvalue index. Eigenvectors corresponding to the bulk have participation ratios around RMT prediction N/3 = 29. However, v87 has the highest number (44) of significant participants which is far from the suggested value. We also see that eigenvectors corresponding to the smallest eigenvalues have the lowest number of significant participants.2
2.3.4 Relation between Volatility and Correlation
In order to examine the evolution of the correlations in the financial system, we investigate the mean correlation of returns by a rolling window approach. We pick window length l = 22 (business month) and roll the time window through the data one day at a time. Explicitly, the mean correlation cl(t)for the correlation coefficients cijl(t)in a time window [t − l + 1, t] is defined as
j i l ij l c t N N t c ( ) ) 1 ( 2 ) ( (15)2 That differs from the observations on the US stock market Plerou et al. 2001 where large values of PRs have been found
15
We want to compare the mean correlation of the financial markets with the system’s volatility. We take the absolute value of the global market mode as the daily volatility proxy of the financial system. A comparison of mean correlation and volatility is given in Figure 2.10 which shows that high levels of global volatility and correlation are strongly linked.3 Furthermore, after the times of high
volatility, markets still stay highly correlated for some period4 although we have to keep in mind that the procedure of shifting the window by one data point is partially responsible in this case.
[Insert Figure 2.10(a) and 2.10(b) about here]
It is a good measure of the overall global correlation between the financial markets and it allow us to compare the mean correlation of the financial markets with the system’s volatility. The volatility of the market mode is considered as the system’s global volatility and the absolute value of market mode is used as the volatility proxy. A comparison of mean correlation and volatility is given in figure 2.10(a) with their actual values. Figure 2.10(a) shows that high levels of global volatility and global correlation are strongly linked. Another observation is that after the times of high volatility, markets still stay highly correlated for some period, although we have to keep in mind that the procedure of shifting the window by one data point is partially responsible in this case. Persistence of the long effect of the shocks in volatile times between markets can be inferred as the effect of the belief that market movements connectedness turns into a self-fulfilling prophecy after the crisis. On the other hand, we can apply the same rolling window procedure for the volatility to understand the co-movement better. Taking a window of the
3 Other studies find similar results by empirical analyses (Onnela et al. (2003), Solnik et al. (1996), Erb et al. (1994)) and
agent based model simulations in LeBaron et al. (1999). For example, Solnik et al. (1996) reveals that cross correlations between nine highly developed markets fluctuate strongly with time and increase in periods of high market volatility. Moreover, based on this phenomenon, Zheng et al. (2001) constructs an indicator of systemic risk by principle component analysis.
4 In Dalkir (2009) such a situation is explained as the effect of the belief that market movement connectedness turns into
16
same length, we observe the evolution of global volatility and global correlation in figure 2.10(b). We also standardize both series to have zero mean and unit variance. In the beginning of the considered time period, system already has a high volatility and correlation probably because of the continuing effects of 2008 crisis. Then for almost a year volatility stays steady, until the May 2010, volatility does not show any significant high values until August 2011 when S&P downgraded US credit rating, and volatility stays at high levels for a few months after then, mostly because of Eurozone’s growing debt crisis. Top four volatility values are observed in the weeks of;
(i) 10.05.2010: European Union finance ministers agreed an emergency loan package that with IMF support could reach 750 billion euros to prevent a sovereign debt crisis spreading through the euro zone, (ii) 08.08.2011: Credit rating agency S&P downgraded credit rating of
the US federal government from AAA (out- standing) to AA+ (excellent),
(iii) 22.09.2011: Moody’s downgraded three US banks: Bank of America, Citigroup and Wells Fargo; S&P downgraded seven Italian banks: Mediobanca, Findomestic Banca, Intesa Sanpaolo, Banca IMI, Banca Infrastrutture Innovazione e Sviluppo, Cassa di Risparmio in Bologna and Banca Nazionale del Lavoro; and Fed announced significant downside risks to US economy,
(iv) 02.04.2009: European Central Bank lowered the interest rate to %1.25 which was record low at that time. Global correlation also takes some of its highest values around the times when the above cases (i)-(iv) occur (see figure 2.10(a)).
These results clearly indicate the information and announcements have some effect on the volatility.
We also analyse the skewness and kurtosis of return distributions by rolling the time window of length l = 264 (business year) through the full data set (see Figure 2.11(a), figure 2.11(b), fat tails are demonstrated by excess kurtosis).
17
[Insert Figure 2.11(a) and 2.11(b) about here]
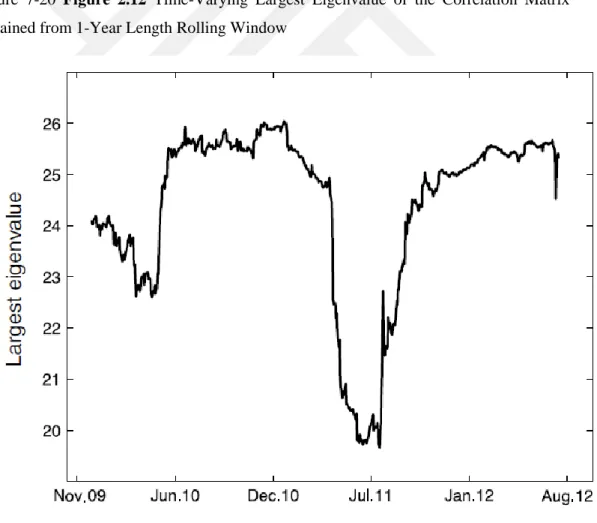
2.3.5 Time-Varying Largest Eigenvalue
After revealing that the largest eigenvalue carries true information, we apply a similar approach of Podobnik (2010) to our data. With a one-year length rolling window, we obtain the time-varying largest eigenvalue of the return correlation matrix and observe its characteristics. Figure 2.12 shows that the largest eigenvalue peaks during the highest global volatility levels and there is a strong link between the magnitude of this eigenvalue and the volatility levels in general. 5
[Insert Figure 2.12 about here]
2.3.6 Correlation-Based Financial Network Analysis
Financial markets around the world can be regarded as a complex system. This forces us to focus on a global-level description to analyse the interaction structure among markets which can be achieved by representing the system as a network. During the recent years, networks have proven to be a very efficient way to characterize and investigate a wide range of complex systems including stock, commodity and foreign exchange markets6. In this study, we are interested in
identifying the connection structure and hierarchy in the network of financial markets formed with cross-correlations of returns. In order to do that we construct the Minimal Spanning Tree (MST) and the Ultrametric Hierarchical Tree (UHT) associated with it (Gopikrishnan et al. (2001), Onnela et al. (2003)). To create a
5Which coincides with the findings of Podobnik et al. (2010): The authors study 1340 time series with 9 year daily data
and investigate how the maximum singular value λ changes over (time lags) for different years and find that it is greatest in times of crises.
6There are numerous applied studies. Onnela (2003), Tuminello et al (2005), Bonanno (2001), Micchihe and Bonanno
18
network based on return correlations, we use the metric defined by Mantegna (1999), ) 1 ( 2 ij ij c d (16)
It is a valid Euclidean metric since it satisfies the necessary properties; (i) dij 0, (ii) dij i j, (iii) d ij dji and (iv) dij dik dkj. This transformation creates a
NxN distance matrix D from the NxN cross-correlation matrix C. The distance d ij
varies from 0 to 2 with small distances corresponding to high correlations and vice versa. MST is constructed as follows: start with the pair of elements with the shortest distance and connect them; then the second smallest distance is identified and added to the MST. The procedure continues until there are no elements left, with the condition that no closed loops are created. Finally we obtain a simply connected network that connects all N elements with N − 1 edges such that the sum of all distances is minimum.7 . This can be seen as way to find the N − 1 most relevant connections among a total of (N (N − 1))/2 connections. This is especially plausible for extracting the most important information concerning connections when a large number of markets is under study. In terms of financial markets, MSTs can also be considered as filtered networks enabling us to identify the most probable and the shortest path for the transmission of a crisis.
After defining the Euclidean space of financial markets, we next move to the ultrametric space. An ultrametric space is the space where all distances within it are ultrametric. The ultrametric distance d is understood as a regular distance ij*
with properties (i)–(iii) and property (iv) is replaced by a stronger condition; ) , max( * * * kj ik ij d d
d . Ultrametric distances are important to hierarchical clustering since they redefine the distance between two elements as the distance between their closest ancestors. The MST provides the sub-dominant ultrametric hierarchical
7
This can be seen as a way to find the N − 1 most relevant connections among a total of N(N − 1)/2 connections which is especially appropriate for extracting the most important information concerning connections when a large number of markets is under consideration. In terms of financial markets, MSTs can also be considered as filtered networks enabling us to identify the most probable and the shortest path for the transmission of a crisis.
19
structure of the markets into what is called UHT. The MST is associated with the single-linkage clustering algorithm as methodology suggested by Tumminello et al. (2007), so we present the UHT using the same method. The most important issue of the construction above is that while it is robust for strongly clustered networks, it has a tendency to link poorly clustered groups into chains by successively joining them to their nearest neighbours, thus the information obtained from MST should be used with caution.
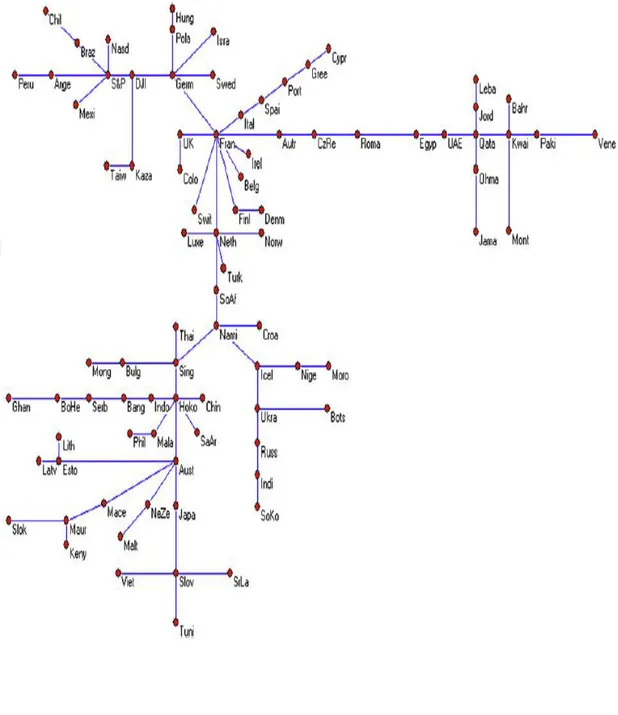
To understand the effects of the 2008 financial crisis on markets’ integration structure, we analyse the cases corresponding to two different time periods; period one: 01/01/2005–01/01/2007 and period two: 01/01/2009– 31/07/2012. The MSTs and the UHTs of these periods are given in figures 2.13 and 2.14 respectively.8
[Insert Figure 2.13a and 2.13b about here] [Insert Figure 2.14a and 2.14b about here]
For both periods, the three US market indexes are close together as expected and Germany serves as a hub for the connection between two main clusters; North America and Europe. France seems to be the central node as it has the highest number of linkages in both cases and surprisingly the US market, which is usually accepted as the world’s most important financial market, displays a somewhat looser connection with the others. The European Union (EU) seems to form the central trunk of the MSTs and the clusters appear to be organized principally according to a geographical position and historical and linguistic ties (Gilmore, Lucey and Boscia (2010)).
In period one, The European countries do not form a single body but tend to form several subgroups. UK serves as a hub for connection between developed European countries and developing countries of Eastern Europe. Eurozone members are connected except Austria and Greece. Austria heads a branch that
8Since data were unavailable, we had to omit three markets; Bosnia and Herzegovina, Kuwait and Serbia in the analysis
20
includes clusters of additional Europe countries. Six new members of European Union of that time, seems closely related in two different groups; Estonia, Lithuania, Latvia and Czech Republic, Hungary, Poland. Luxembourg connects West Europe to Asia. Hong Kong, which is a key financial centre in the world, acts as a bridge for connecting three other main financial markets in Asia; Singapore, China and South Korea to Europe. South Korea and Singapore head branches with several groupings. Similarly Western and Central Asia countries like Qatar, UAE, Bahrain, Jordan, and Oman form a group tied to West Europe markets through East Europe markets. Some weird connections like Kazakhstan to Malaysia, Venezuela to Slovakia or Macedonia with Bahrain which occur due to the aforementioned problem with MST.
However, major changes are observed between two periods. In particular, the effect of the Eurozone debt crisis shows itself on the financial markets in period 2. The problematic countries Greece, Italy, Portuguese, Spain and Cyprus are all tied together, showing that bond market connection results with stock market connection. UK, not a Eurozone member, loses its importance in the network in period 2. Three important markets that are positively diversified from the others through the 2008 crisis (Russia, India and South Korea) stand isolated in the network.
2.3.7 Centrality Measures
In network theory, the centrality of a node determines the relative importance of that node within a network. Next, we perform a detailed analysis on MSTs using different quantitative definitions of centrality.9
9Before beginning the analysis, we point out an important observation: even we have an extra three edges in the network
in period two, the total distances in the MST is 82.593 whereas this values is 87.651 in period one. This shows increased strength in the correlation of financial markets after the 2008 crisis. A similar conclusion is obtained by using the time-varying correlation data from the Section 2.3.4. In particular, we split the time-varying correlations into two sets as pre and post 2008. A non-parametric median comparison test reveals that the set of correlations in post 2008 has a significantly larger median.