1968-2007
Article in Fresenius Environmental Bulletin · January 2012
CITATIONS
10
READS
89
3 authors:
Some of the authors of this publication are also working on these related projects:
Re-evaluation of trends in annual streamflows of Turkish rivers for the period 1968-2007View project
HORTICULTURAL RESEARCH INSTITUTE DIRECTORATE, Soil and Water Resources Tarsus Location, Dept. of Water ManagementView project Fatih Topaloğlu
Cukurova University
23PUBLICATIONS 186CITATIONS SEE PROFILE
Ahmet Irvem
Mustafa Kemal University
20PUBLICATIONS 201CITATIONS SEE PROFILE
Mete Özfidaner
Republic of Turkey Ministry of Agriculture and Forestry
17PUBLICATIONS 33CITATIONS SEE PROFILE
RE-EVALUATION OF TRENDS IN ANNUAL STREAMFLOWS
OF TURKISH RIVERS FOR THE PERIOD 1968-2007
Fatih Topaloğlu1,*, Ahmet İrvem2 and Mete Özfidaner1
1 University of Çukurova, Faculty of Agriculture, Department of Agricultural Structures and Irrigation, 01330 Adana, Turkey 2 University of Mustafa Kemal, Faculty of Agriculture, Department of Agricultural Structures and Irrigation 31040 Antakya, Turkey
ABSTRACT
The Mann-Kendall rank correlation test was performed to detect trends in this study. The research investigated 3 annual stream-flow variables including annual instanta-neous minimum, mean and instantainstanta-neous maximum stream-flows for a network of 57 Turkish streamflow gauging stations in 25 basins of Turkey, during 1968-2007. The application of trend detection technique to 3 stream-flow variables has resulted in the identification of significant decreasing trends at the 0.05 level, appearing mostly in the basins in western and partly in southeastern Turkey, whereas almost no evidence of significant change was experienced with a general downward direction in the rest of the country. Of the 25 basins, however, only basins with the numbers of 12 and 22 exhibited significant in-creasing trend for one station each. The number of sta-tions showing a decreasing trend is more than 9-fold that of stations with an upward trend whereas the significant downtrend exceeded the uptrends 49-fold. Besides, almost 2/3 of the decreasing trends (144 times over 159) were found to be statistically significant while approximately 13% of the increasing trends (15 times) exhibited signifi-cant trend.
KEYWORDS : Trend; Mann-Kendall rank correlation test; annual stream-flows; Turkey
1. INTRODUCTION
Understanding the possible impacts of global climate change on water resources is of great importance for the appropriate design and management of water resources of the country [1]. Undeveloped and developing countries where semi-arid climate prevails and water resources are not properly developed will be affected most severely from climate changes [2]. Moreover, global and regional * Corresponding author
projections of climate change could further decrease the stream-flow in countries around the Mediterranean [2, 3]. Water resources are among the most vulnerable natural systems [4] to changes in precipitation [5], to temperature [6], and to agricultural practices and land-use [7]. In Tur-key, water is the most critical resource, especially for agricultural use with a 74% share, and changes in water resources associated with climate change and their impli-cations for agricultural production are also important for future water resources planning and sustainable agricul-tural development strategy [1, 8]. Turkey is also the source of the rivers that provide water for many countries in the Near East, a region of prime geopolitical and historical importance. Water is the cornerstone of agricultural viabil-ity, public health and political stability in Turkey where competition over scarce water supplies looms as a poten-tial flash point for all countries sharing this resource [9]. As a result, the Middle East is extremely vulnerable to any, either natural or human-induced, reduction in avail-able water resources [10].
The relationship between the climatic regimes over a river basin and its hydrologic response, through its stream-flow, presents different degrees of complexity due to the physical characteristics of the basin [11]. Chiew et al. [12] have mentioned that the changes in precipitation are am-plified in stream-flow, and that, in general, it is easier to detect a variation in discharge than directly in the basic climatic variables, such as precipitation or temperature. Stream-flow is a synthesis of precipitation, evapotrans-piration and the rest of the hydrologic cycle components, together with possible anthropogenic influences [11]. There-fore, the detection of trends in stream-flow time series has received a great attention throughout the world, e.g. for United States [7, 13-17], South American rivers [18-20],
Canada [6, 21-23], England [24, 25], China [26], and
Switzerland [27]. As for Turkey, many studies concerning stream-flow trend analysis have been carried out at the
national [28-34] and regional (basin) scale [8, 35-41].
These national and regional studies imply that there were significant decreases in monthly stream-flows, annual mean, maximum and minimum stream-flows in western, middle and southern regions of Turkey covering the pe-riod of 1935-2001, for varying record pepe-riods each.
The results of those studies may vary widely depend-ing mostly on the study area, the record period and the statistical tests used. Besides, no previous study has in-vestigated trends in stream-flow for up-to-date records of the same record lengths. The objective of this paper is to identify changes through time in the annual mean, instan-taneous minimum and instaninstan-taneous maximum stream-flows from 1968 to 2007 (40 years) using the non-parametric Mann-Kendall rank correlation test.
2. MATERIALS AND METHODS
Turkey consists of 26 river basins having a drainage
area of 779,452 km2. The data used are a set of 57
stream-flow gauging stations over 25 hydrologic regions (Fig. 1), and cover 3 annual stream-flow variables including annual instantaneous minimum, mean and instantaneous maximum stream-flows for a 40-year period (1968-2007). However, we used some stations having shorter records [stations 515, 701, 1611 and 1612 for annual instantaneous mini-mum stream-flows (1968-2006); station 1003 for annual Fehler!
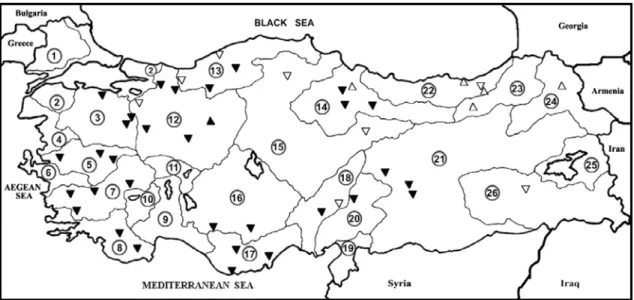
FIGURE 1 - Spatial distribution of 57 stream-flow gauging stations over Turkey.
TABLE 1 - Some properties of the selected stream-flow gauging stations in Turkey [29].
Available Stations for Basin
Number Name of Rivers Mean and
Maximum
Minimum Drainage Area (km2)
Average Precipita-tion (mm/year) Total Streamflow (mm/year) 1 Meriç 1 0 14,560 604.0 91.35 2 Marmara 1 0 24,100 728.7 345.64 3 Susurluk 3 3 22,399 711.6 242.42 4 Aegean 1 0 10,003 624.2 208.94 5 Gediz 3 3 18,000 603.0 108.33 6 Little Menderes 1 0 6,907 727.4 172.29 7 Big Menderes 4 4 24,976 664.3 121.32 8 West Mediterranean 2 2 20,953 875.8 426.19 9 Central Mediterranean 1 0 19,577 1000.4 564.95 10 Burdur Lake 1 0 6,374 446.3 78.44 11 Afyon 1 0 7,605 451.8 64.43 12 Sakarya 7 6 58,160 524.7 110.04
13 West Black Sea 5 4 29,598 811.0 335.50
14 Yeşilırmak 4 4 36,114 496.5 160.60 15 Kızılırmak 3 2 78,180 446.1 82.89 16 Central Anatolia 2 2 53,850 416.8 83.94 17 East Mediterranean 3 3 22,048 745.0 502.09 18 Seyhan 2 2 20,450 624.0 391.69 19 Hatay 2 0 7,796 815.6 150.08 20 Ceyhan 1 1 21,982 731.6 326.63 21 Euphrates 3 3 127,304 540.1 248.30
22 East Black Sea 3 3 24,077 198.2 618.85
23 Çoruh 1 1 19,872 629.4 317.03
24 Aras 1 1 27,548 432.4 168.07
25 Van Lake 0 0 19,405 474.3 123.16
mean and instantaneous maximum stream-flows (1969-1994)] in the analysis for having more than and/or, at least, one station in each basin (Fig. 1). These 57 stations selected among more than 700 stations are observed and recorded by the General Directorate of Electrical Power Resources Survey and Development Administration [42-44], and determined to be unaffected by significant up-stream regulation and diversion [45]. The main considera-tions for selecting these staconsidera-tions were the following: spa-tial distribution of the stations across the country; avail-ability of the longest possible records within the period 1935-2007; continuity of the records that could have no missing data points. Stations are broadly distributed, not only across the country but also across the river basins of Turkey; the exceptions are basins with the numbers of 1, 2, 4, 6, 9-11, 20 and 23-26, mainly due to a greater num-ber of missing values, shorter record lengths, and insuffi-cient numbers of gauging stations. Besides, no station was found in basin number 25 due to upstream regulation. The contributing drainage areas for the stations used range
from 23.10 to 60,559.60 km2 with a median of 1,995.60
km2 and cover 46.77% of Turkey (Table 1).
Turkey is separated into 7 geographical regions, and is a large peninsula surrounded by the Mediterranean Sea in the south, the Aegean Sea in the west, and the Black Sea in the north. Precipitation as main source of runoff process exhibits a considerable serial and regional vari-ability over Turkey. Most of the precipitation falls during late autumn, winter and early spring due to main precipi-tation sources of moist air masses coming from the Atlan-tic Ocean and the Mediterranean Sea [46]. Totals of mean annual precipitation decrease generally from the coastal belts to interiors. The range of mean annual precipitation totals are from 350 to 500 mm in the central Anatolia region; 600 to 800 mm in the Marmara and Aegean re-gions. Annual precipitation totals increase from the conti-nental southeastern Anatolia (400 mm) to eastern Anato-lia (800 mm). Mean annual precipitation is above 800 mm in the Mediterranean region where precipitation mostly occurs in winter. Mean annual precipitation totals are above 1000 mm along western Mediterranean, and west-ern and eastwest-ern Black Sea coastal areas where rainfall shows almost uniform distribution over time. For more details on the climatology of Turkey, readers are referred to Türkeş [46, 47], Kadıoğlu [48] and Türkeş et al. [49].
2. MATERIALS AND METHODS
The rank-based non-parametric Mann-Kendall (MK) statistical test has been commonly used to assess the sig-nificance of trends in hydro-meteorological time series [23]. It is resistant to the influence of extremes, and is good for use with skewed variables [16]. It is also robust with re-spect to missing and tied values, seasonality, non-normality, non-linearity, and serial dependency [39]. The test exam-ines whether a random response variable monotically
de-creases or inde-creases with time. Each data point xi is used
as a reference point and compared with all other data points
xj as follows: < = > = i j i j i j i j x x x x x x x x for 1 -for 0 for 1 ) -( sgn (1)
The MK test statistic S is calculated as follows:
(
)
∑ ∑
= =+ = 1 1 1 -sgn n-i n i j i j x x S (2)where, n is the length of the data set. The statistic S,
when n ≥ 8, is approximately normally distributed with
the mean and the variance given by:
[ ]
S =0 E (3) 18 ) 5 2 )( 1 ( -5) 2 )( 1 ( ) Var(∑
=1 + − + − = p i i i i t t t n n n S (4)where, p is the number of tied groups in the data set,
and ti is the number of data points in the ith tied group.
The summation term in Eq. (4) is only used if data values are tied in the series. The standardized MK statistic Z is computed by: < + = > − = 0 for ) Var( 1 0 for 0 0 for ) Var( 1 S S S S S S S Z (5)
and follows the standard normal distribution with mean of zero and variance of one under the null hypothesis of no trend in the series. The null hypothesis is rejected if |Z| ≥ Z1-α/2 at the α level of significance, where Z1-α/2 is the
(1-α/2)-quantile in the standard normal distribution. A positive Z value indicates an upward trend, whereas a negative value indicates a downward trend.
3. RESULTS
The Mann-Kendall rank correlation test was used to test for statistically significant trends in 3 stream-flow vari-ables, namely, annual mean, annual instantaneous maximum and annual instantaneous minimum stream-flow series. The results are presented in Table 2. Table 2 reveals that 159 out of 159 data had a trend of which 100 stations (62.89%) are significant according to Z calculated by Eq. (5) at the significance level of 5%. There are many more downtrends (144 times) than uptrends (15 times). The downtrends exceeded the uptrends by 9.6 to 1 when averaged over all 3 stream-flow variables. In contrast, the significant down-trends (98 times) exceeded the significant updown-trends (2 times)
TABLE 2 - Summary of the Mann-Kendall rank correlation test results for 3 stream-flow variables over Turkey. Stream-flow
variables
Stations tested
No. with de-creasing trends
No. with signifi-cant decreasing
trends
No. with in-creasing trends
No. with signifi-cant increasing trends No. of signifi-cant trends Percent with significant trends Minimum 45 39 31 6 1 32 71.11 Mean 57 52 39 5 1 40 70.18 Maximum 57 53 28 4 0 28 49.12 Total 159 144 98 15 2 100 -
by 49.0 to 1. In other words, 98.0% of the significant trends are decreasing. Generally, these results are in good agreement with those of national and regional studies [28-41]. The percentage of the stream gauging stations show-ing statistically significant trends ranges from 49.12% to 71.11%.
3.1. Trend analysis of annual instantaneous minimum stream-flows
Annual instantaneous minimum stream-flow gener-ally decreased significantly (31 stations over 45) across Turkey, except for the basins of Sakarya (No. 12, for only 1 station out of 6), Yeşilırmak (No. 14, for 1 station out of 4), east Black Sea (No. 22, 2 stations out of 3), Çoruh (No. 23, for only 1 station out of 1) and Aras (No. 24, for only 1 station out of 1) exhibiting increase (Fig. 2). Sig-nificant increase was only found in the basin of Sakarya (No. 12) among the 6 increased stations. Furthermore, no trend evaluation was made for basins with the numbersof 1, 2, 4, 6, 9-11 and 19 due to lack of data (Table 1). Lins and Slack [16] indicated that decreasing pattern in annual minimum stream-flow suggests increasing drought. A decreasing minimum stream-flow across Turkey indicates that base-flows are also decreasing suggesting increased
drought. Besides, Türkeş [47] indicated that southeastern Anatolia (covers mostly the lower part of Euphrates (No. 21) and western part of Tigris (No. 26) basins) and the central Anatolia regions (includes stations of 1224, 1535, 1611 and 1612, in this study) could be arid lands that are affected by desertification processes, due to the climatic
factors. Türkeş [47] also concluded that the
Mediterra-nean region (basins with the numbers of 8-10, 17, 19 and lower part of 18 and 20) could also be considered as an area that may be more vulnerable to desertification proc-esses in the future. Moreover, Topaloğlu [30] noted that the Marmara (basins with the numbers of 1-3 and the upper part of 12) and Aegean (basins with the numbers of 4-7 and 11) regions may also be considered as regions vulnerable to desertification processes, with respect to a regional de-crease in stream-flow. Global and regional projections of climate change could further decrease the stream-flow in countries around the Mediterranean [2], and lead to in-creased water shortages. Recently, in a climate change study using 4 different Global Circulation Models,
Fuji-hara et al. [50] have also found an increase in
tempera-ture, and decrease in precipitation combined with de-crease in stream-flow in the Seyhan river basin (No. 18) located in the Mediterranean region.
Fehler!
FIGURE 2 - Trends in annual instantaneous minimum stream-flow over Turkey. Upward (∆) and downward (∇) pointing open triangles
indicate insignificant increasing and decreasing trends at the 5% level, respectively. Trends significant at the 5% level (-1.96 ≥ Z ≥ +1.96) are
3.2. Trend analysis of annual mean stream-flows
A large number of downward trends was observed at 52 stations over 57 stations for annual mean stream-flow, suggesting a reduction in water amount over Turkey (Fig. 3). The downtrends were determined to be generally significant at 39 stations, located mostly in the central and western part of Turkey. However, only 1 station (2233) in east Black Sea basin (No. 22) showed a significant uptrend among 5 uptrends prevalent mostly in the basins with the
numbers of 12, 22, 23 and 24. Zhang et al. [22], in their
study, explained this decreasing trend in annual mean stream-flow by increasing trends in temperature combined
with almost no change in precipitation. Türkeş [46] has
also pointed out that slightly insignificant decreases in annual rainfall series were generally observed over Tur-key. Kadıoğlu [51] has found that the mean annual tem-perature records in Turkey exhibited a warming trend over
the 1939-1989 periods, but a cooling trend from 1955 to
1989. Recently, Türkeş et al. [49] have also revealed
in-creased trends for the annual, winter and spring mean tem-peratures, particularly over southern regions of Turkey for the period 1929-1999, and decreasing trends for summer and, particularly, autumn mean temperatures over the con-tinental inner and northern regions. More recently, Fujihara
et al. [50] have determined an increase in temperature but decrease in precipitation over Turkey.
3.3. Trend analysis of annual instantaneous maximum stream-flows
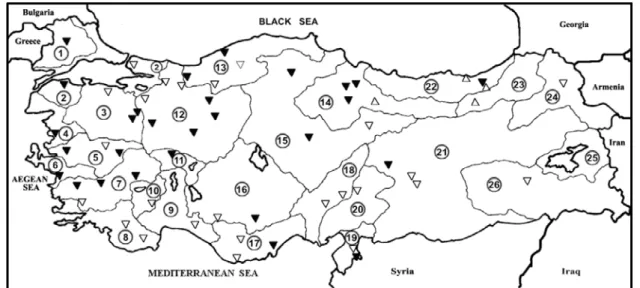
The majority of the stations (53 times over 57) showed downward trends for annual instantaneous maximum stream-flow; only 28 stations, located mostly in the central and western part of Turkey, are significant at the 5% level (Fig. 4). However, 1 station in the basins of Yeşilırmak
FIGURE 3 - Trends in annual mean stream-flow over Turkey (for details: see Fig. 2).
(No. 14, station 1418) and Çoruh (No. 23, station 2304) and 2 stations in the basin of east Black Sea (No. 22, stations 2202 and 2233) exhibited insignificant increases.
Zhang et al. [22] indicated that annual maximum daily
stream-flow, particularly those in large basins, generally associated with snowmelt appearing to be decreased where temperature was rising. The earlier warming in spring re-sulted in earlier but more gradual snowmelt because of shorter length of day and lower sun angle. It should also be noted that it is difficult to attribute exact causes to the trends in some variables, such as the decreasing trend in annual instantaneous maximum stream-flow, without additional detailed regional analysis [22]. For example, Zhang et al. [52] found no increasing trends in the num-ber of heavy precipitation events, or in the magnitudes of annual maximum daily precipitation across Canada. However, mean annual precipitation studied by research-ers in Turkey [46-48] is not necessarily sufficient to gen-erate an increase in producing maximum streamflows. Therefore, Lins and Slack [16] have suggested to know if there are trends in annual daily maximum precipitation (>100 mm).
4. CONCLUSIONS AND DISCUSSION
Trends in annual mean, instantaneous minimum and instantaneous maximum were evaluated for 25 basins of Turkey using the Mann-Kendall rank correlation test statis-tics. The number of stations showing a decreasing trend is more than 9-fold that of stations with an upward trend whereas the significant downtrend 49-fold exceeded the up-trends. In other words, almost 2/3 of the decreasing trends were found to be statistically significant while approxi-mately 13% of the increasing trends exhibited significant trends. Statistically significant decreasing trends appeared widely in the central and western parts of Turkey for all stream-flow variables whereas only some parts of south-ern region showed significant trend existence. However, only 2 stations (1226 and 2233) in 2 basins out of 25, namely, the basins of Sakarya and east Black Sea, were determined to be the basins exhibiting a significant in-crease in annual stream-flow variables. Besides, stations showing insignificant upward trends are stations with the numbers of 1226, 1402, 1418, 2202, 2233, 2304 and 2409. It should also be mentioned that no systematic patterns were found in the trends of annual stream-flows in Turkey. These results are in general good agreement with those of the national and regional studies [28-41].
There are relatively few significant trends in the an-nual instantaneous maximum stream-flow (49.12%) com-pared to the annual (70.18%) and minimum (71.11%) means. Cigizoglu et al. [31, 34], Topaloğlu [32] and Ba-yazit et al. [33] noted that mean and low flows have more trends than maximum flows. It could be concluded that Turkey is generally getting drier and less extreme.
Re-cently, Fujihara et al. [53] have also reached similar
findings using an inverse modelling approach in a climate change study in the Seyhan river basin (No. 18). They have concluded that flood events will occur much less frequently whereas drought events will occur much more frequently under the changing climate conditions. More-over, in an attempt to determine whether regional trends have occurred in Turkish stream-flow over 15 stream-flow variables, Topaloğlu [30] found only significant decreasing and no trends at regional scales rather than upward trends. More extreme events due to enhanced hydrologic cycle were suggested by some general circulation model
simu-lations of climate under increasing atmospheric CO2
con-ditions [22]. This has not been regularly observed in
stream-flow data of Turkey due possibly to the effect of a given change in precipitation and temperature [50] vary-ing substantially between catchments, dependvary-ing on cli-mate regime, catchment physical characteristics and
an-thropogenic factors. Besides, Türkeş et al. [54] indicated
that only eastern Anatolia appeared to show similar be-havior to the global warming trend.
The specific causes of these variations on stream-flow variables are not simply and immediately explained; their wide spatial consistency is quite sufficient to suggest some systematic cause or causes. Among recent stream-flow trend studies, Lettenmaier et al. [15] stressed that the trends in stream-flow are not fully parallel to the changes in precipitation and temperature due to a combination of climate and water management effects. Similarly, Beven [55] indicated that climate effects, such as changing rain-fall patterns, are not the only possible cause of change to flood regimes, even when considering change at a national scale. However, Sankarasubramanian et al. [5] and Fujihara
et al. [50] found that there is a high regional sensitivity of stream-flow to changes in precipitation. Burn and Elnur [6] also indicated that trends in hydrologic variables are re-lated to trends in meteorological variables due to similari-ties in trends and patterns in the hydrologic variables, and meteorological variables at selected locations. Recently,
Fu et al. [26] reported that land-use/land-cover change,
including agricultural activities, deforestation/forestation, urbanization and road building with effects that may out-weigh any climatic trends, are one of the major factors resulting in the observed runoff reduction. Changnon and
Demissie [56] showed that human-induced changes mask
the effects of climatic variability. It is evident that the re-sults of these studies have varied widely depending on the hydrological behavior of the study area. It should also be remembered in evaluating trends in hydrologic time series that the multidecadal variability could appear as a trend in 30-50 years record lengths [22]. Therefore, it would be inappropriate to express that the observed trends in Turk-ish stream-flow patterns have occurred primarily as a consequence of climate change. Moreover, the trend attri-bution and the relation between the observed stream-flow trends and climate change should be addressed in future studies with the inclusion of the influences of climate variables [29]. Finally, the findings of the study will help
to DSİ (State Hydraulics Works), which is the primary state agency responsible for overall management of water resources of Turkey, to review the basin management practices, such as the operational rules for existing reser-voirs and future irrigation developments.
REFERENCES
[1] Pamuk Mengu, G., Akkuzu, E., Anac, S. and Sensoy, S. (2011) Impact of climate change on irrigated agriculture. Fre-senius Environmental Bulletin 20(3a), 823-830.
[2] IPCC (2001) Climate Change 2001: Impacts, Adaptation, and Vulnerability. Contribution of Working Group II to the third assessment Report of the Intergovernmental Panel on Climate Change, Cambridge University Press, Cambridge, U.K. [3] Rodríguez Díaz, J. A. and Topcu, S. (2010) Sustaining
Medi-terranean irrigated agriculture under a changing climate. Out-look on Agriculture 39(4), 269-275.
[4] Salinger, M.J. and Griffiths, G.M. (2001) Trends in New Zealand daily temperature and rainfall extremes. Interna-tional Journal of Climatology 21, 1437-1452.
[5] Sankarasubramanian, A., Vogel, R.M. and Limbrunner, J.F. (2001) The climate elasticity of streamflow in the United States. Water Resources Research 37(6), 1771-1782. [6] Burn, H.B. and Elnur, M.A.H. (2002) Detection of hydrologic
trends and variability. Journal of Hydrology 255, 107-122. [7] Gebert, W.A. and Krug, W.R. (1996) Streamflow trends in
Wisconsin’s driftless area. Water Resources Bulletin 32(4), 733-744.
[8] Ozkul, S. (2009) Assesment of climate change effects in Ae-gean river basins: the case of Gediz and Buyuk Menderes Basins. Climatic Change 97(1-2), 253-283.
[9] Touchan, R., Garfin, G.M., Meko, D.M., Funkhouser, G., Er-kan, N., Hughes, M.K. and Wallin, B.S. (2003) Preliminary reconstructions of spring precipitation in southwestern Tur-key from tree-ring width. International Journal of Climatol-ogy 23, 157-171.
[10] Cullen, H.M. and deMenocal, P.B. (2000) North Atlantic in-fluence on Tigris-Euphrates streamflow. International Journal of Climatology 20, 853-869.
[11] Krepper, C.M., García, N.O. and Jones, P.D. (2003) Interan-nual variability in the Uruguay river basin. International Journal of Climatology 23, 103-115.
[12] Chiew, F., Whetton, P. and McMahon, T. (1995) Detection of climate changes in recorded runoff volumes in south-east Australian rivers. International Journal of Climatology 13, 643–653.
[13] Pupacko, A. (1993) Variations in northern Sierra Nevada streamflow: implications of climate change. Water Resources Bulletin 29(2), 283-290.
[14] Lins, H.F. and Michaels, P.J. (1994) Increasing US stream-flow linked to greenhouse forcing. EOS, Transactions, American Geophysical Union 75, 284-285.
[15] Lettenmaier, D.P., Wood, E.F. and Wallis, J.R. (1994) Hy-droclimatological trends in the continental United States 1948-1988. Journal of Climate 7, 586-607.
[16] Lins, H.F. and Slack, J.R. (1999) Streamflow trends in the United States. Geophysical Research Letters 26(2), 227-230. [17] Douglas, E.M., Vogel, R.M. and Kroll, C.N. (2000) Trends in
floods and low flows in the United States: impact of spatial correlation. Journal of Hydrology 240, 90-105.
[18] Marengo, J.A. (1995) Variations and change in South Ameri-can streamflow. Climatic Change 31, 99-117.
[19] García, N.O. and Vargas, W. (1998) The temporal climatic variability in the ‘Rio de la Plata’ basin displayed by the river discharges. Climatic Change 38, 359-379.
[20] Genta, J.L., Perez-Iribarren, G. and Mechoso, C.R. (1998) A recent increasing trend in the streamflow of rivers in south-eastern South America. Journal of Climate 11, 2858-2862. [21] Westmacott, J.R. and Burn, D.H. (1997) Climate change
ef-fects on the hydrologic regime within the Churchill-Nelson River Basin. Journal of Hydrology 202, 263-279.
[22] Zhang, X., Harvey, K.D., Hogg, W.D. and Yuzyk, T.R. (2001) Trends in Canadian streamflow. Water Resources Re-search 37(4), 987-998.
[23] Yue, S., Pilon, P. and Cavadias, G. (2002) Power of the Mann-Kendall and Spearman’s rho tests for detecting mono-tonic trends in hydrological series. Journal of Hydrology 259, 254-271.
[24] Robson, A.J., Jones, T.K., Reed, D.W. and Bayliss, A.C. (1998) A study of national trend and variation in UK floods. International Journal of Climatology 18, 165-182.
[25] Zaidman, M.D., Keller, V., Young, A.R. and Cadman, D. (2003) Flow-duration-frequency behaviour of British rivers based on annual minima data. Journal of Hydrology 277, 195-213.
[26] Fu, G., Chen, S., Liu, C. and Shepard, D. (2004) Hydro-climatic trends of the Yellow river basin for the last 50 years. Climatic Change 65, 149-178.
[27] Birsan, M.V., Molnar, P., Burlando, P. and Pfaundler, M. (2005) Streamflow trends in Switzerland. Journal of Hydrol-ogy 314, 312-329.
[28] Önöz, B. and Bayazıt, M. (2003) The power of statistical tests for trend detection. Turkish Journal of Engineering and Environmental Sciences 27, 247-251.
[29] Kahya, E. and Kalaycı, S. (2004) Trend analysis of stream-flow in Turkey. Journal of Hydrology 289, 128-144. [30] Topaloğlu, F. (2006) Regional trend detection of Turkish
river flows. Nordic Hydrology 37, 165-182.
[31] Cigizoglu, H.K., Bayazit, M. and Önöz, B. (2005) Trends in the maximum, mean and low flows of Turkish rivers. Journal of Hydrometeorology 6(3), 280-290.
[32] Topaloğlu, F. (2006) Trend detection of streamflow variables in Turkey. Fresenius Environmental Bulletin 15(7), 644-653. [33] Bayazit, M., Cigizoglu, H.K. and Onoz, B. (2002) Trend
analysis in Turkish river flows. Turkish Engineering News 420-421-422, 8-10, (in Turkish).
[34] Cığızoğlu, H.K., Yıldız, M., Bayazıt, M., Malkoç, Y. ve Önöz, B. (2002) Türkiye nehirleri taşkın, ortalama ve düşük akımlarındaki trendler. İstanbul Teknik Üniversitesi ve Elek-trik İşleri Etüd İdaresi Genel Müdürlüğü, İTÜ Araştırma Fonu Projesi, 265s.
2050 [35] Topaloğlu, F., Tülücü, K., Çetin, M. ve Yücel, A. (1997)
Some statistical pre-analyses of hydrological data and their practice. J. of the Agricultural Faculty of Univ. of Çukurova 12 (4), 21-30, (in Turkish).
[36] Topaloğlu, F. (1999) Determining an appropriate method for esti-mating flood magnitude and frequencies in the rivers of Seyhan Basin. University of Çukurova, Faculty of Agriculture, Dept. of Ir-rigation and Agricultural Structures, Ph.D. Thesis No: 524, 219 pp, Adana, Turkey, (in Turkish)
[37] Topaloğlu, F., Yücel, A., Tülücü, K. ve Çetin, M. (1999) Use of Peak Discharges in Flood Frequency Analyses. Turkish Journal of Agriculture and Forestry 23, Supp. 1, 187-192. [38] Kukul, Y.S., Anaç, S., Yeşilırmak, E. and Moraes, J.M.
(2007) Trends of precipitation and stream-flow in Gediz river basin, Western Turkey. Fresenius Environmental Bulletin 16(5), 477-488.
[39] Yenigün, K., Gümüş, V. and Bulut, H. (2008) Trends in streamflow of the Euphrates basin, Turkey. Proceedings of the Institution of Civil Engineers-Water Management 161(4), 189-198.
[40] Yıldırım, Y.E., Türkeş, M. and Tekiner, M. (2004) Time-series analysis of long-term variations in stream-flow data of some stream-flow stations over the Gediz Basin and in pre-cipitation of the Akhisar Station. Pakistan Journal of Biologi-cal Sciences 7(1), 17-24.
[41] Partal, T. (2010) Wavelet transform-based analysis of peri-odicities and trends of Sakarya Basin (Turkey) streamflow data. River Research and Applications 26, 695-711.
[42] EİE (2005) Su Akımları Yıllık Ekstremler ve Ortalamalar [1935-2000]. General Directorate of Electrical Power Re-sources Survey and Development Administration, 684 pp, Ankara, Turkey.
[43] EİE (2008) Su Akımları Aylık Ortalamaları [1935-2005]. General Directorate of Electrical Power Resources Survey and Development Administration, 740 pp, Ankara, Turkey. [44] EİE (2010) 2000-2007 Arası Su Akımları Yıllığı. General
Di-rectorate of Electrical Power Resources Survey and Devel-opment Administration, Ankara, Turkey.
[45] EİE (2010) Aylık Akım Gözlem ve Yıllık Akım Gözlem İs-tasyonları Verileri. General Directorate of Electrical Power Resources Survey and Development Administration, 3 Cilt, Ankara, Turkey.
[46] Türkeş, M. (1996) Spatial and temporal analysis of annual rainfall variations in Turkey. International Journal of Clima-tology 16, 1057-1076.
[47] Türkeş, M. (2003) Spatial and temporal variations in precipi-tation and aridity index series of Turkey. Mediterranean Cli-mate: Variability and Trends. Hans-Jürgen Bolle (editor), Regional Climate Studies. Springer Verlag, Heidelberg, Chapter 5, 181-213.
[48] Kadıoğlu, M. (2000) Regional variability of seasonal precipi-tation over Turkey. International Journal of Climatology 20, 1743-1760.
[49] Türkeş, M., Sümer, U.M. and Demir, İ. (2002) Re-evaluation of trends and changes in mean, maximum and minimum temperatures of Turkey for the period 1929-1999. Interna-tional Journal of Climatology 22, 947-977.
[50] Fujihara, Y., Tanaka, K., Watanabe, T. and Kojiri, T. (2006) Potential impacts of climate change on the hydrology and water resources of the Seyhan river basin. Proceedings of In-ternational Symposium on Water and Land Management for Sustainable Irrigated Agriculture, April 4-8, Adana, Turkey, Abstract p. 251, Paper p. 1-9 on CD.
[51] Kadıoğlu, M. (1997) Trends in surface air temperature data over Turkey. International Journal of Climatology 17, 511-520.
[52] Zhang, X., Hogg, W.D. and Mekis, E. (2001) Spatial and temporal characteristics of heavy precipitation events over Canada. Journal of Climate 14, 1923-1936.
[53] Fujihara, Y., Simonovic, S.P., Topaloğlu, F., Tanaka, K. and Watanabe, T. (2008) An inverse-modelling approach to as-sess the impacts of climate change in the Seyhan River Basin, Turkey, Hydrological Sciences Journal 53(6), 1121-1136. [54] Türkeş, M., Sümer, U.M. and Kılıç, G. (1995) Variations and
trends in annual mean air temperatures in Turkey with re-spect to climatic variability. International Journal of Clima-tology 15, 557-569.
[55] Beven, K. (1993) Riverine flooding in a warmer Britain. Geographical Journal 159, 157-161.
[56] Changnon, S.A. and Demissie, M. (1996) Detection of changes in streamflow and floods resulting from climate fluc-tuations and land use-drainage changes. Climatic Change 32, 411-421. Received: April 26, 2011 Accepted: June 14, 2011 CORRESPONDING AUTHOR Fatih Topaloğlu University of Çukurova Faculty of Agriculture
Department of Agricultural Structures and Irrigation 01330 Adana
TURKEY
Phone: +90 505 8829090 Fax: +90 322 3386386 e-mail: [email protected]
![TABLE 1 - Some properties of the selected stream-flow gauging stations in Turkey [29]](https://thumb-eu.123doks.com/thumbv2/9libnet/4146613.63469/3.892.77.806.751.1158/table-properties-selected-stream-flow-gauging-stations-turkey.webp)