DOMESTIC DEMAND UNDER PRESSURE
Zümrüt İmamoğlu* ve Barış Soybilgen**
Executive Summary
In January, seasonally adjusted Industrial Production Index (IPI) increased by 1.1 percent from the previous month. Export volume index increased by 1.1 percent, whereas import volume index decreased by 0.5 percent. Industrial production accelerated due to the increase in exports supported by broadening recovery in Europe. However, economic indicators relating to investment and consumption are mostly negative. We expect that net exports will be the main engine of growth in the first quarter.
Strong data on exports and production in January push our forecast for the first quarter above our expectations. Our quarter on quarter growth forecast is 0.5 percent, and the corresponding year on year (YoY) forecast is 3.8 percent. Current account in January was below expectations at $4.9 billion. 12-month rolling current account deficit fell by $1 billion and was $64 billion. We expect the current account deficit to GDP ratio to remain at 7.9 percent in the first quarter and gold excluded current account deficit to be 6.5 percent.
* Dr. Zümrüt İmamoğlu, Betam, Research Associate. [email protected]
†Barış Soybilgen, Betam, Research Assistant,
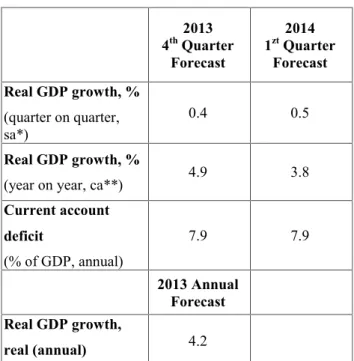
Table 1. Betam's quarterly and annual growth rate forecasts
Source: Betam. *sa: seasonally and calendar day adjusted **ca: calendar day adjusted.
January production data is encouraging Industrial production in January increased more than expected, 1.1 percent from the previous month, and 7.3 percent from the same month of the previous year. Year-on-year rate was high due to base effect from the previous year but monthly increase was mainly due to the increase in exports, particularly exports to Europe. Increases in automobile and textile goods sectors, which export mostly to European countries, were the main
2013 4thQuarter Forecast 2014 1ztQuarter Forecast Real GDP growth, % (quarter on quarter, sa*) 0.4 0.5 Real GDP growth, %
(year on year, ca**) 4.9 3.8
Current account deficit (% of GDP, annual) 7.9 7.9 2013 Annual Forecast Real GDP growth, real (annual) 4.2
Economic Outlook and Forecasts:
March 2014
drivers of industrial production. Will the surge in exports continue? Turkish exporters' assembly's leading export data indicates a YoY increase in exports in February, too. And this might contribute to the IPI in the coming month, however, falls in capacity utilization rate both in January and February imply that industrial production might slow down or turn negative in the coming months. Indicators for private investment and consumption in January imply downward pressure on domestic demand. Durable goods production and investment goods production fell, consumer and investment goods imports declined and deterioration in confidence indices that began in January continued through February. On the other hand, real sector confidence index recovered in February since the exchange rate stabilized following the interest rate hike by the Central Bank.
Data released so far shows that growth will be mainly export-led in the first quarter. Our quarter on quarter growth forecast is 0.5 percent. Our year on year (YoY) forecast for the first quarter is 3.8 percent. We expect the current account deficit to GDP to remain at 7.9 percent in the first quarter and gold excluded current account deficit to remain at 6.5 percent.
Strong January data may not be enough January production data implies that there may not be a significant contraction in the economy in the first quarter contrary to concerns. However, the deterioration in business sentiment and the increase in exchange rate in January may have negative effects in the coming months. By
adjusting back to its orthodox policy and tight monetary policy stance, the Central Bank established some confidence at the end of the month and the exchange rate stabilized as a result. However, these developments are not enough for a revival in investment. Political uncertainty remains high and negatively affects investment and consumption behavior by firms and consumers. Under these conditions, the government may try supporting growth by increasing expenditures but is limited by fiscal constraints. Overall, first quarter growth will depend on increase in exports and government spending.
Private consumption is decelerating In January, non-durable goods production increased by 1.9 percent, from the previous month. On the other hand, durable goods production and consumer goods imports declined by 3.5 percent and 1.5 percent, respectively. In line with the fall in consumption goods imports, special tax income declined by 0.4 percent.
Deterioration in consumer confidence index continues at full speed. In both December and January, consumer confidence index fell by 4.1 percent consecutively. In February, it declined further by 4.9 percent. Indicators for January depict a gloomy picture for the first quarter of 2014. Overall, we believe that private consumption expenditure will stagnate in the first quarter.
Investment continues to stagnate
In January, intermediate goods imports and investment goods imports decreased by 3.2 percent and 3.4 percent, respectively, from the previous month. In the same period, investment goods production declined by 1.7 percent. On the other hand, IPI increased by 1.1 percent in January.
Capacity Utilization Rate (CUR) continued to decline. In February, CUR fell 0.2 percentage points from the previous month. After consecutive falls in last three months, real sector confidence index recovered slightly. We expect private investment expenditure to stagnate as it did in the last quarter.
Exports increased in January
Figure 2 shows monthly changes of seasonally adjusted import and export volume indices. In January from the previous month, export volume index increased by 1.8 percent, and import volume index declined by 0.5 percent. In the same period, gold excluded exports increased by 3.9 percent and 1.2 percent, respectively. Exports to Europe has been the main driver for the increases in the EPI lately. Further acceleration in European
growth is expected to continue increasing Turkey's exports. We expect net exports to contribute positively to the GDP growth in the first quarter. Current account deficit is below expectations in
January
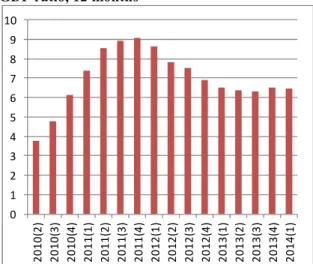
In January, the current account deficit was $4.9 billion, below expectations. In the same month of the previous year, the current account deficit was $5.8 billion. Therefore, 12-month rolling current account deficit declined from $65 billion to $64 billion, and gold-excluded current account deficit fell from $53.2 billion to $52.3 billion.
Net capital outflow was $3.1 billion in January. The current account deficit was mainly financed by the Central Bank reserves. In January, Central Bank directly intervened in the market and tried to stabilize the exchange rate by selling high amounts of foreign currency. Therefore, reserves decreased by $5,8 billion. Net errors and omissions indicated $2.2 billion inflow.
We expect that the current account deficit to GDP will remain at 7.9 percent at the end of first quarter. Our gold excluded current account deficit forecast is 6.5 percent.
Table 2: Monthly and quarterly changes of Betam’s selected indicators (real and sa)
Economic Indicators
November
December
January
February
Quarter2013 4th Quarter2014 1stExports
2.7
-1.7
1.8
**
5.0
1.5
Imports
-1.8
0.9
-0.5
**
5.5
-0.6
Intermediate goods import
0.8
5.1
-3.2
**
4.2
0.3
Consumer goods import
3.1
-2.0
-1.5
**
0.9
-1.9
Investment goods import
5.6
3.4
-3.4
**
0.9
0.5
Exports excluding gold***
6.9
-3.7
3.9
**
1.3
3.6
Imports excluding gold***
1.6
1.5
1.2
**
0.7
2.8
Industrial Production Index
2.1
0.2
1.1
**
1.1
1.9
Nondurable consumer goods
1.9
1.5
1.9
**
0.7
3.6
Durable consumer goods
2.1
-0.2
-3.5
**
-0.7
-3.0
Intermediate goods
3.4
-1.5
3.4
**
1.8
3.5
Investment goods
2.4
0.0
-1.7
**
0.7
-0.9
Capacity Utilization Rate
-0.8
0.9
-1.3
-0.2
0.6
-1.1
Nondurable consumer goods
-0.4
0.7
0.1
0.8
0.2
0.8
Durable consumer goods
-0.4
0.5
-1.4
0.5
0.2
-1.0
Intermediate goods
-0.1
1.3
-1.2
0.6
1.0
-0.1
Investment goods
1.1
1.4
-1.3
-2.2
0.2
-1.0
Soft Data
Consumer confidence index
(Turkstat)
3.0
-4.1
-4.1
-4.9
1.0
-8.2
Real sector confidence index
-0.4
-0.6
-5.6
0.4
3.8
-6.0
Financial Data
IMKB 100 (Stock Exchange)
-3.0
-5.7
-8.7
-4.2
-0.6
-14.9
Other
Special consumption tax*
(SCT)
0.4
1.3
-0.4
**
-2.1
0.6
Passenger Cars
2.6
-8.5
14.3
-9.5
-5.4
3.5
Commercial Vehicles
2.1
-20.4
-7.3
14.9
-6.4
-14.3
Source: TurkStat, CBRT, Treasury, ISE, Betam. All series are real (or inflation adjusted) wherever necessary and seasonally adjusted. *This tax is collected on sales of goods such as gas. fuel oils. alcohol. tobacco products and automobiles.
**Data not yet released.
Figure 1: Capacity utilization rate and industrial production index (sa, left axis for CUR and right axis for IPI)
Source: TurkStat, Betam.
Figure 2: Volume indices of exports and imports (sa)
Source: Turkstat, Betam.
Figure 3: Gold included current account deficit to GDP ratio, 12 months
Source: TurkStat, TCMB, Betam.
Figure 4: Gold excluded current account deficit to GDP ratio, 12 months
Source: Turkstat, TCMB, Betam.
85 90 95 100 105 110 115 120 125 68 69 70 71 72 73 74 75 76 77 78 Ja n-10 M ay -1 0 Se p-10 Ja n-11 M ay -1 1 Se p-11 Ja n-12 M ay -1 2 Se p-12 Ja n-13 M ay -1 3 Se p-13 Ja n-14 CUR IPI 80 90 100 110 120 130 140 Ja n-10 M ay -1 0 Se p-10 Ja n-11 M ay -1 1 Se p-11 Ja n-12 M ay -1 2 Se p-12 Ja n-13 M ay -1 3 Se p-13 Ja n-14 Export Import 0 1 2 3 4 5 6 7 8 9 10 11 20 10 (2 ) 20 10 (3 ) 20 10 (4 ) 20 11 (1 ) 20 11 (2 ) 20 11 (3 ) 20 11 (4 ) 20 12 (1 ) 20 12 (2 ) 20 12 (3 ) 20 12 (4 ) 20 13 (1 ) 20 13 (2 ) 20 13 (3 ) 20 13 (4 ) 20 14 (1 ) 0 1 2 3 4 5 6 7 8 9 10 20 10 (2 ) 20 10 (3 ) 20 10 (4 ) 20 11 (1 ) 20 11 (2 ) 20 11 (3 ) 20 11 (4 ) 20 12 (1 ) 20 12 (2 ) 20 12 (3 ) 20 12 (4 ) 20 13 (1 ) 20 13 (2 ) 20 13 (3 ) 20 13 (4 ) 20 14 (1 )
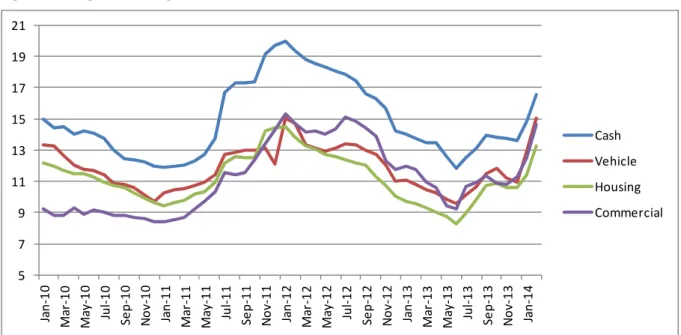
Figure 5: Weighted Average Interest Rates for Turkish Lira Banks' Loans (%) Source: CBRT. 5 7 9 11 13 15 17 19 21 Ja n-10 M ar -1 0 M ay -1 0 Ju l-1 0 Se p-10 No v-10 Ja n-11 M ar -1 1 M ay -1 1 Ju l-1 1 Se p-11 No v-11 Ja n-12 M ar -1 2 M ay -1 2 Ju l-1 2 Se p-12 No v-12 Ja n-13 M ar -1 3 M ay -1 3 Ju l-1 3 Se p-13 No v-13 Ja n-14 Cash Vehicle Housing Commercial