SLIGHT INCREASE IN NONAGRICULTURAL UNEMPLOYMENT
Seyfettin Gürsel
*Gökçe Uysal
and Mine Durmaz
Abstract
Seasonally adjusted labor market data shows that nonagricultural unemployment rate has reached 12.8 percent,
increasing by 0.1 percentage points in the period of November 2014 compared to the period of October 2014.
During last three months, nonagricultural unemployment rate has stagnated at the level of 12.8 percent. In the
period of November 2014, employment in manufacturing sector decreased by 80 thousand and employment in
services and in construction expanded by 50 and 46 thousand, respectively. According to Betam forecasting model
based on Kariyer.net data, nonagricultural unemployment rate will remain constant in the period of December
2014.
Nonagricultural labor force and employment continue to soar
According to data released by TurkStat in the period of November 2014, nonagricultural labor force increased by 1
million 710 thousand (7.8 percent), non-agricultural employment increased by 1 million 119 thousand (5.7 percent)
and non-agricultural unemployment increased by 591 thousand compared the same period in the previous year
(Figure1). In spite of steady increases in agricultural employment, the number of unemployed persons in
non-agricultural sectors has been rising parallel to rapidly increasing non-non-agricultural employment since July 2014.
Figure 1 Year-on-year changes in non-agricultural labor force, employment, and unemployment
Source: TurkStat, Betam
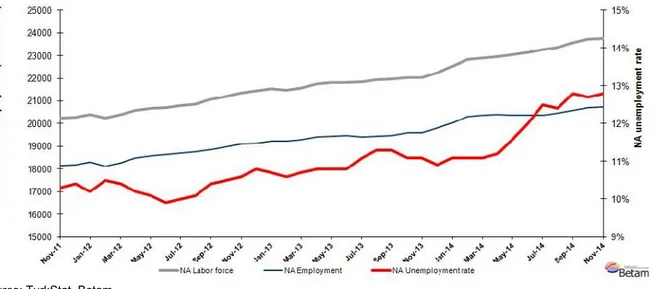
Nonagricultural unemployment is holding its level
According to seasonally adjusted data, in the period of November 2014 non-agricultural labor force increased by 46
thousand compared to the period of October 2014, and reached 23 million 764 thousand (Figure 2, Table 1).
Non-agricultural employment increased by 16 thousand and recorded 20 million 722 thousand. Hence, the number of
*Prof. Dr. Seyfettin Gürsel, Betam, Director,[email protected] Yrd. Doç. Dr. Gokce Uysal, Betam, Vice Director,[email protected] Mine Durmaz, Betam, Research Assistant,[email protected]
Labor Market Outlook:
February 2015
www.betam.bahcesehir.edu.tr
2
persons unemployed in non-agricultural sectors increased by 30 thousand and non-agricultural unemployment rate
in this period compared to previous period increased slightly to 12.8 percent. Seasonally adjusted non-agricultural
unemployment rate holds its level at about 12.8 percent since September 2014.
Figure 1 Seasonally adjusted non-agricultural labor force, employment, and unemployment
Source: TurkStat, Betam
Stagnating trend will continue in December period
Kariyer.net's
1application per vacancy series used in the Betam forecasting model is depicted in Figure 3.
According to Kariyer.net data, applications per vacancy increased slightly in the period of December 2015 (average
of November 2014, December 2014, and January 2015). Moreover, Betam's forecasting model predicts that
non-agricultural unemployment will remain constant in the next period (December 2015).
2In previous month, Betam's
forecasting model had predicted an increase in nonagricultural unemployment in November 2014. Indeed,
nonagricultural unemployment rate increased even if slightly (from 12.7 percent to 12.8 percent).
Figure 2 Seasonally adjusted non-agricultural unemployment rate and application per vacancy
Source: Kariyer.net, TurkStat, Betam
1Betam has ben calculating aplication per vacancy using series released by Kariyer.net for a while. Seasonal and calendar adjustment
procedure is aplied to aplication per vacancy series. A decrease in aplications per vacancy may be caused by an increase in vacancies or by a decrease in the number of aplications. An increase in vacancies signals economic growth while decreasing number of aplications indicates a decrease in number of people loking for a job. Monthly labor market series released by TurkStat is the average of thre months. Therefore, aplication per vacancy statistics calculated using Kariyer.net series is the average of thre months as wel.
2 For detailed information on Soybilgen's forecasting model, please see Betam Research Brief 168 titled as "Kariyer.net Verisiyle Kısa Vadeli Tarım Dışı İşsizlik Tahmini"
Losses in manufacturing employment
According to seasonally adjusted labor market series, employment increased in all sectors except manufacturing in
November 2014 (Figure 4, Table2).
3In line with the industrial production index, manufacturing employment
decreased by 80 thousand. Employment in services and construction increased by 50 thousand and 46 thousand
respectively.
3Employment in each sector is seasonally adjusted separately. Hence the sum of these series may differ from the seasonally adjusted series of
total employment. The difference stems from the non-linearity of the seasonal adjustment process. .
www.betam.bahcesehir.edu.tr
4
Figure 3 Employment by sectors (in thousands)
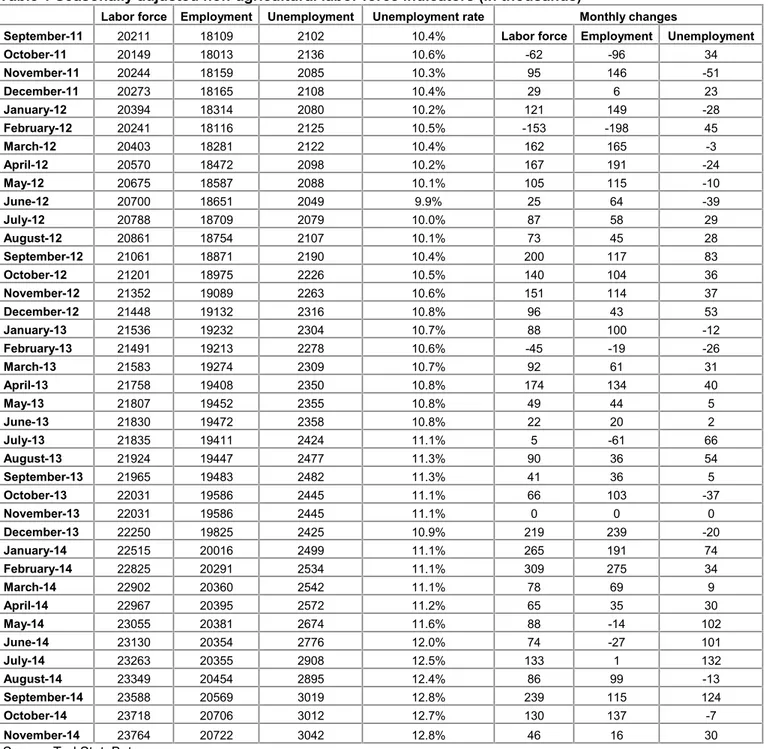
Table 1 Seasonally adjusted non-agricultural labor force indicators (in thousands)*
Labor force Employment Unemployment Unemployment rate Monthly changes
September-11 20211 18109 2102 10.4% Labor force Employment Unemployment
October-11 20149 18013 2136 10.6% -62 -96 34 November-11 20244 18159 2085 10.3% 95 146 -51 December-11 20273 18165 2108 10.4% 29 6 23 January-12 20394 18314 2080 10.2% 121 149 -28 February-12 20241 18116 2125 10.5% -153 -198 45 March-12 20403 18281 2122 10.4% 162 165 -3 April-12 20570 18472 2098 10.2% 167 191 -24 May-12 20675 18587 2088 10.1% 105 115 -10 June-12 20700 18651 2049 9.9% 25 64 -39 July-12 20788 18709 2079 10.0% 87 58 29 August-12 20861 18754 2107 10.1% 73 45 28 September-12 21061 18871 2190 10.4% 200 117 83 October-12 21201 18975 2226 10.5% 140 104 36 November-12 21352 19089 2263 10.6% 151 114 37 December-12 21448 19132 2316 10.8% 96 43 53 January-13 21536 19232 2304 10.7% 88 100 -12 February-13 21491 19213 2278 10.6% -45 -19 -26 March-13 21583 19274 2309 10.7% 92 61 31 April-13 21758 19408 2350 10.8% 174 134 40 May-13 21807 19452 2355 10.8% 49 44 5 June-13 21830 19472 2358 10.8% 22 20 2 July-13 21835 19411 2424 11.1% 5 -61 66 August-13 21924 19447 2477 11.3% 90 36 54 September-13 21965 19483 2482 11.3% 41 36 5 October-13 22031 19586 2445 11.1% 66 103 -37 November-13 22031 19586 2445 11.1% 0 0 0 December-13 22250 19825 2425 10.9% 219 239 -20 January-14 22515 20016 2499 11.1% 265 191 74 February-14 22825 20291 2534 11.1% 309 275 34 March-14 22902 20360 2542 11.1% 78 69 9 April-14 22967 20395 2572 11.2% 65 35 30 May-14 23055 20381 2674 11.6% 88 -14 102 June-14 23130 20354 2776 12.0% 74 -27 101 July-14 23263 20355 2908 12.5% 133 1 132 August-14 23349 20454 2895 12.4% 86 99 -13 September-14 23588 20569 3019 12.8% 239 115 124 October-14 23718 20706 3012 12.7% 130 137 -7 November-14 23764 20722 3042 12.8% 46 16 30
6
Table 2 Seasonally adjusted employment by sectors (in thousands)*
Agriculture Manufacturing Construction Service Monthly changes
September-11 5384 4866 1763 11480 Agriculture Manufacturing Construction Service
October-11 5416 4823 1681 11510 32 -43 -82 30 November-11 5405 4870 1667 11622 -11 47 -14 112 December-11 5328 4873 1633 11659 -77 3 -34 37 January-12 5333 4864 1706 11745 5 -9 73 86 February-12 5276 4808 1562 11746 -57 -56 -144 1 March-12 5222 4850 1577 11853 -54 42 15 107 April-12 5249 4930 1652 11890 27 80 75 37 May-12 5292 4908 1728 11951 43 -22 76 61 June-12 5249 4900 1750 12001 -43 -8 22 50 July-12 5260 4926 1742 12041 11 26 -8 40 August-12 5257 4892 1764 12097 -3 -34 22 56 September-12 5321 4911 1780 12179 64 19 16 82 October-12 5360 4917 1784 12274 39 6 4 95 November-12 5363 5003 1797 12289 3 86 13 15 December-12 5345 5051 1772 12309 -18 48 -25 20 January-13 5330 5073 1810 12349 -15 22 38 40 February-13 5297 5023 1800 12389 -33 -50 -10 40 March-13 5281 5083 1785 12406 -16 60 -15 17 April-13 5270 5176 1807 12425 -11 93 22 19 May-13 5207 5200 1753 12498 -63 24 -54 73 June-13 5179 5163 1788 12521 -28 -37 35 23 July-13 5194 5146 1736 12528 15 -17 -52 7 August-13 5218 5117 1755 12575 24 -29 19 47 September-13 5212 5096 1780 12607 -6 -21 25 32 October-13 5122 5090 1852 12644 -90 -6 72 37 November-13 5073 5064 1795 12726 -49 -26 -57 82 December-13 5057 5131 1888 12806 -16 67 93 80 January-14 5400 5232 1945 12839 343 101 57 33 February-14 5529 5359 2016 12916 129 127 71 77 March-14 5600 5365 1982 13014 71 6 -34 98 April-14 5564 5373 1907 13115 -36 8 -75 101 May-14 5564 5364 1862 13155 0 -9 -45 40 June-14 5488 5332 1812 13210 -76 -32 -50 55 July-14 5413 5243 1818 13295 -75 -89 6 85 August-14 5371 5257 1857 13340 -42 14 39 45 September-14 5357 5306 1876 13388 -14 49 19 48 October-14 5358 5353 1897 13456 1 47 21 68 November-14 5372 5273 1943 13506 14 -80 46 50