NON-AGRICULTURAL UNEMPLOYMENT STAGNATES
Seyfettin Gürsel
*Gökçe Uysal
∗∗and Ayşenur Acar
∗∗∗Executive Summary
Seasonally adjusted labor market data shows that non-agricultural unemployment rate is 11.2 percent in the
period of May 2012. Both unemployment and non-agricultural unemployment rate remained stagnant in this
period. According to the Kariyer.net data, we believe that non-agricultural unemployment rate will continue to
stagnate in the period of June 2012. Also, we observe employment losses in manufacturing and increases in
service and construction employment.
There is a slowdown in the non-agricultural labor market
According to the labor market statisics released by TurkStat on August 15
th, in the period of May 2012 (April
– May – June) non-agricultural labor force only increased by 465 thousand ( 2.3 percent), non-agricultural
employment increased by 747 thousand (4.1 percent) and the number of unemployed persons in
non-agricultural decreased by 282 thousand to 2 million 196 thousand on a year-on-year basis (Figure 1).
Figure 1 Year-on-year changes in non-agricultural labor force, employment and unemployment
Source: TurkStat, Betam
No decline in non-agricultural unemployment
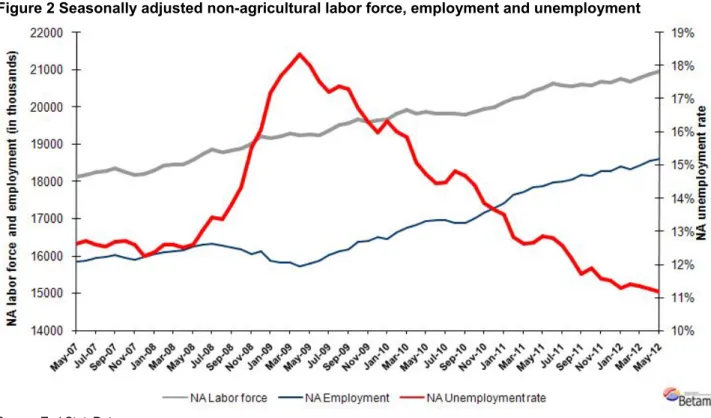
According to seasonally adjusted series, non-agricultural labor force increased by 66 thousand to 20 million
961 thousand in the period of May compared to the period of April 2012 (Figure 2, Table 1). Non-agricultural
* Prof. Seyfettin Gürsel, Betam, Director, [email protected]
∗∗ Assoc. Prof. Gökçe Uysal, Betam, Vice Director, gokce.uysal @bahcesehir.edu.tr ∗∗∗ Ayşenur Acar, Betam, Research Assistant, [email protected]
May 15, 2012
Labor Market Outlook:
August 2012
employment increased by 71 thousand and reached 18 million 618 thousand. Consequently, the number of
unemployed persons in agricultural sectors decreased by 5 thousand and seasonally adjusted
non-agricultural unemployment rate remained 11.2 percent (Figure 2). We observe that non-non-agricultural
unemployment rate has been stagnating since the period of December 2011.
Figure 2 Seasonally adjusted non-agricultural labor force, employment and unemployment
Source: TurkStat, Betam
According to Kariyer.net series non-agricultural employment will continue to stagnate
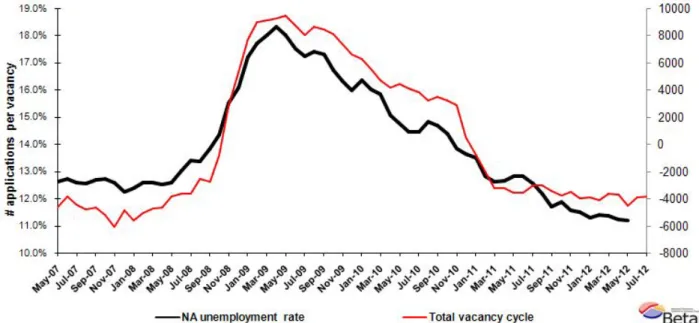
In the previous research briefs, we used seasonal and calendar adjusted application per vacancy series
released by Kariyer.net. However, we started using total vacancy series as the total application series
contains a structural break due to technical difficulties since April 2012
1.
According to data released by Kariyer.net on vacancies provided by the firms, we believe that
non-agricultural unemployment rate will continue to stagnate in the period of June 2012.
1
Seasonal and calendar adjustment procedure is applied to total vacancy series released by Kariyer.net. Total vacancy series is continuously increasing given that the customers base of Kariyer.net is widening overtime. Therefore we calculate the cycle of the series by subtracting the absolute number from the trend calculated by a Hodrick-Prescott fitler. Since the changes in the number of vacancies are negatively correlated with the changes in unemployment we use the inverse of total vacancy series by multiplying it with -1. Although this vacancy series are not as strong forecasters as the application per vacancy series, it gives an idea for the direction of non-agricultural unemployment.
Figure 3 Seasonally adjusted non-agricultural unemployment rate and total vacancy cycle
Data source: Kariyer.net, TurkStat, Betam
Construction employment has been increasing
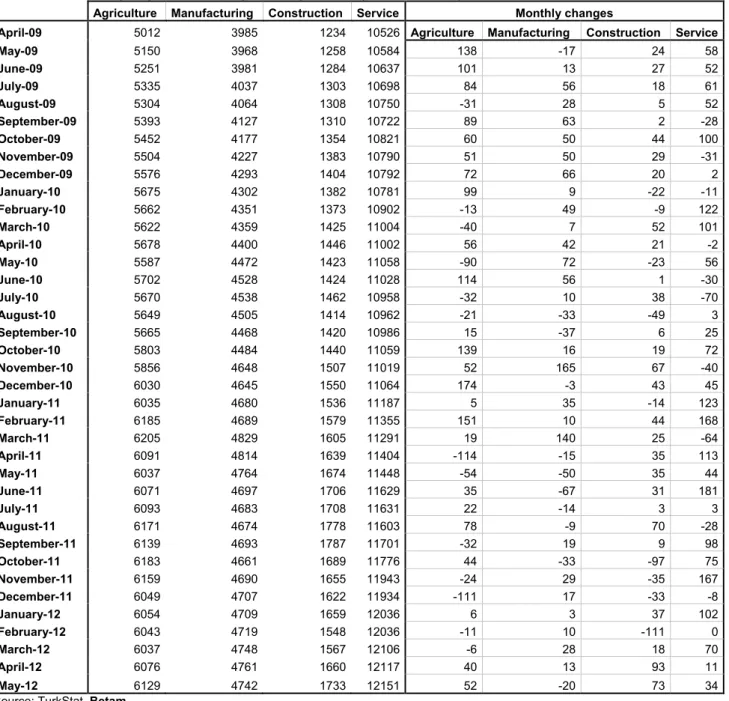
According to seasonally adjusted figures, employment in manufacturing decreased by 20 thousand in the
period of May 2012 (Table 2, Figure 4)
2. However, employment in services and construction increased by 34
thousand and 73 thousand, respectively. Albeit a relatively small share of construction employment in
non-agricultural employment (10 percent), strong increases in these past two periods have cumulated to above
150 thousand. Consequently, developments in the construction sector had considerable effects on the labor
market.
2 Seasonal adjustment procedure is applied to each sector of employment series separately. Hence the sum of these series may
differ from the seasonally adjusted series of total employment. The difference stems from the non-linearity of the seasonal adjustment process.
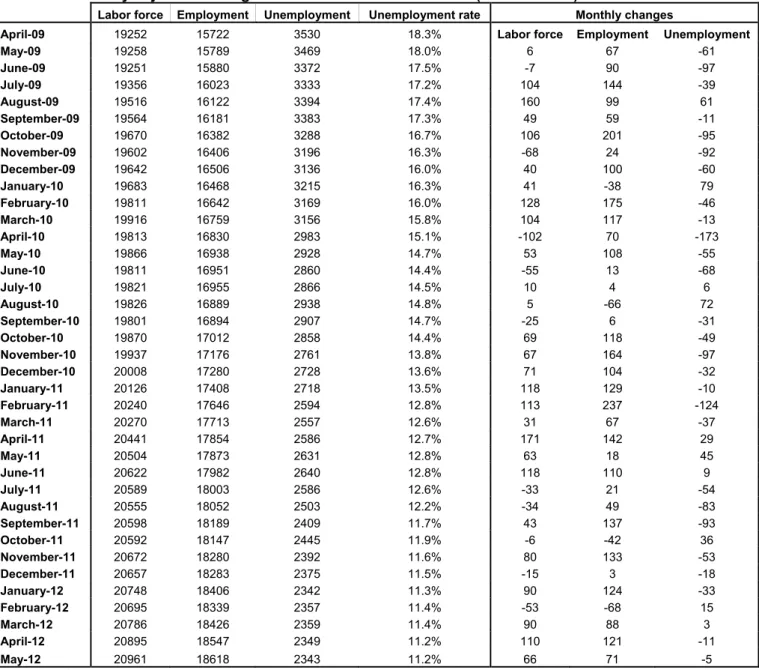
Table 1 Seasonally adjusted non-agricultural labor force indicators (in thousands)
Labor force Employment Unemployment Unemployment rate Monthly changes
April-09 19252 15722 3530 18.3% Labor force Employment Unemployment
May-09 19258 15789 3469 18.0% 6 67 -61 June-09 19251 15880 3372 17.5% -7 90 -97 July-09 19356 16023 3333 17.2% 104 144 -39 August-09 19516 16122 3394 17.4% 160 99 61 September-09 19564 16181 3383 17.3% 49 59 -11 October-09 19670 16382 3288 16.7% 106 201 -95 November-09 19602 16406 3196 16.3% -68 24 -92 December-09 19642 16506 3136 16.0% 40 100 -60 January-10 19683 16468 3215 16.3% 41 -38 79 February-10 19811 16642 3169 16.0% 128 175 -46 March-10 19916 16759 3156 15.8% 104 117 -13 April-10 19813 16830 2983 15.1% -102 70 -173 May-10 19866 16938 2928 14.7% 53 108 -55 June-10 19811 16951 2860 14.4% -55 13 -68 July-10 19821 16955 2866 14.5% 10 4 6 August-10 19826 16889 2938 14.8% 5 -66 72 September-10 19801 16894 2907 14.7% -25 6 -31 October-10 19870 17012 2858 14.4% 69 118 -49 November-10 19937 17176 2761 13.8% 67 164 -97 December-10 20008 17280 2728 13.6% 71 104 -32 January-11 20126 17408 2718 13.5% 118 129 -10 February-11 20240 17646 2594 12.8% 113 237 -124 March-11 20270 17713 2557 12.6% 31 67 -37 April-11 20441 17854 2586 12.7% 171 142 29 May-11 20504 17873 2631 12.8% 63 18 45 June-11 20622 17982 2640 12.8% 118 110 9 July-11 20589 18003 2586 12.6% -33 21 -54 August-11 20555 18052 2503 12.2% -34 49 -83 September-11 20598 18189 2409 11.7% 43 137 -93 October-11 20592 18147 2445 11.9% -6 -42 36 November-11 20672 18280 2392 11.6% 80 133 -53 December-11 20657 18283 2375 11.5% -15 3 -18 January-12 20748 18406 2342 11.3% 90 124 -33 February-12 20695 18339 2357 11.4% -53 -68 15 March-12 20786 18426 2359 11.4% 90 88 3 April-12 20895 18547 2349 11.2% 110 121 -11 May-12 20961 18618 2343 11.2% 66 71 -5 Source: TurkStat, Betam
Table 2 Seasonally adjusted employment by sector (in thousands)
Agriculture Manufacturing Construction Service Monthly changes
April-09 5012 3985 1234 10526 Agriculture Manufacturing Construction Service
May-09 5150 3968 1258 10584 138 -17 24 58 June-09 5251 3981 1284 10637 101 13 27 52 July-09 5335 4037 1303 10698 84 56 18 61 August-09 5304 4064 1308 10750 -31 28 5 52 September-09 5393 4127 1310 10722 89 63 2 -28 October-09 5452 4177 1354 10821 60 50 44 100 November-09 5504 4227 1383 10790 51 50 29 -31 December-09 5576 4293 1404 10792 72 66 20 2 January-10 5675 4302 1382 10781 99 9 -22 -11 February-10 5662 4351 1373 10902 -13 49 -9 122 March-10 5622 4359 1425 11004 -40 7 52 101 April-10 5678 4400 1446 11002 56 42 21 -2 May-10 5587 4472 1423 11058 -90 72 -23 56 June-10 5702 4528 1424 11028 114 56 1 -30 July-10 5670 4538 1462 10958 -32 10 38 -70 August-10 5649 4505 1414 10962 -21 -33 -49 3 September-10 5665 4468 1420 10986 15 -37 6 25 October-10 5803 4484 1440 11059 139 16 19 72 November-10 5856 4648 1507 11019 52 165 67 -40 December-10 6030 4645 1550 11064 174 -3 43 45 January-11 6035 4680 1536 11187 5 35 -14 123 February-11 6185 4689 1579 11355 151 10 44 168 March-11 6205 4829 1605 11291 19 140 25 -64 April-11 6091 4814 1639 11404 -114 -15 35 113 May-11 6037 4764 1674 11448 -54 -50 35 44 June-11 6071 4697 1706 11629 35 -67 31 181 July-11 6093 4683 1708 11631 22 -14 3 3 August-11 6171 4674 1778 11603 78 -9 70 -28 September-11 6139 4693 1787 11701 -32 19 9 98 October-11 6183 4661 1689 11776 44 -33 -97 75 November-11 6159 4690 1655 11943 -24 29 -35 167 December-11 6049 4707 1622 11934 -111 17 -33 -8 January-12 6054 4709 1659 12036 6 3 37 102 February-12 6043 4719 1548 12036 -11 10 -111 0 March-12 6037 4748 1567 12106 -6 28 18 70 April-12 6076 4761 1660 12117 40 13 93 11 May-12 6129 4742 1733 12151 52 -20 73 34 Source: TurkStat, Betam
Figure 4 Employment by sectors (in thousands)
3Source: TurkStat, Betam