Understanding predictor effects of computational
thinking skills and media and technology use and
attitudes of pre-service teachers for STEM awareness
Rıdvan Ata
Mugla Sitki Kocman University, TurkeyMustafa Çevik
Karamanoglu Mehmet Bey University, TurkeyAbstract
This study proposes and tests a model that explains STEM awareness of pre-service teachers by examining computational thinking skills, media and technology use and attitudes, and demographic variables including gender, high school type and parent educational background. A total of 337 participants who enrolled in education faculties at three state universities in different regions of Turkey participated in the study. “STEM Awareness Scale”, “Computational Thinking Skills Scale”, “Media and Technology Use and Attitudes Scale” and demographic information forms were used as data collection instruments. The data were analyzed through statistical tests including structural equation modelling. Fit indices of the established model were within an acceptable range. Analysis demonstrated a positive relation amongst computational thinking and media and technology use and attitudes and STEM awareness. In addition, results of structural equation modeling revealed that these factors were significant predictors of STEM awareness. Similarly, the study found that STEM awareness was significantly predicted by some demographic variables such as majors, age, and mother’s educational background. Recommendations for educationalists and policymakers are proposed.
Keywords: STEM awareness, computational thinking, media and technology usage, pre-service teachers
KEDI Journal of Educational Policy-ISSN 1739-4341
Introduction
There has been a great emphasis on STEM (Science, Technology, Engineering, Mathematics) education, which integrates these four disciplines into a holistic approach to equip individuals with skills including problem-solving, critical thinking, creativity, and digital literacy to overcome real-world challenges. It is believed that STEM education plays an important role in the development of 21st century skills (Ergün, 2019). Core elements of these skills are identified as problem-solving, collaboration, critical thinking, creativity, self-awareness, and digital literacy (Ahonen & Kinnunen, 2015; Van Laar, Van Deursen, Van Dijk, & De Haan, 2017). Arguably, these skills can be attained through STEM or currently STEAM (Science, Technology, Engineering, Art, & Mathematics) education (Barak, 2017; Çorlu, Capraro, & Capraro, 2014). The theoretically advocated concepts in STEM education can be identified as critical thinking, creativity, analytical thinking, problem solving, design, production, originality, entrepreneurship and so on. In this context, a 21st century teacher is expected to have high-level skills, be technology literate, provide opportunities for students to prepare and develop materials, develop students’ creativity, apply scientific research methods and techniques, and have entrepreneurial and innovative thinking. However, there are serious obstacles to the implementation of STEM education in many countries, especially in developing countries including Turkey. The fact that STEM disciplines are included in the curriculum as separate courses, the current school climate, inadequate teacher competences, and inappropriate measurement and assessment approaches are some of the obstacles (Capraro & Nite, 2014). Furthermore, there has been a steady decline in STEM areas career choice of students in Turkey (OECD, 2015; OECD, 2017a). More surprisingly, Turkey, the founding member of the Organization for Economic Co-operation and Development (OECD), has the lowest proportion of employed young adults, compared to the average of OECD countries (OECD, 2019). This situation confirms that urgent interventions should be made to encourage students to stay in the STEM pipeline and that STEM careers need to be promoted especially in developing countries like Turkey. More research is needed to identify what factors can enhance pre-service teachers’ STEM awareness and increase their interest in pursuing STEM careers.
STEM and its social and economic value is high on the agenda of countries that desire to remain advanced and competitive (Yusoff, 2019). However, putting efforts into raising STEM to the desired level might be pointless without the required awareness, knowledge and interest. Considering the relevant studies in the literature (Bakırcı & Karışan, 2018; Erdogan & Ciftci, 2017), the first aspect of STEM awareness is perception regarding the benefits of STEM on students’ skills such as problem-solving, critical thinking and analytical thinking. The second aspect of STEM awareness is perception regarding the effects of STEM on teachers’ skills such as technology use, proactivity and planning. The last aspect of STEM awareness is perception regarding the effects of STEM on the subjects such as relationship with daily life, material traits, and hands-on activities. One of the most important steps to establish the integrated interdisciplinary approach brought by STEM in the education system is to ensure that teachers are fully aware of STEM education (Knowles, Kelley, & Holland, 2018) and develop a positive attitude towards STEM. It is important to develop awareness of STEM when considering failures in STEM fields and the decrease in the number of graduates in these fields. Enhancing students’ awareness to pursue careers in STEM fields could help in developing 21st century skills (Kan & Murat, 2018).
Furthermore, universities, Council of Higher Education (CoHE) and the Ministry of National Education (MoNE) are the trivet of teacher education in Turkey. The faculties of education in universities are responsible for educating pre-service teachers. CoHE coordinates and regulates the curriculum for the teacher education programs and MoNE holds the responsibility for selecting new teachers to employ at public schools. These three major institutional stakeholders are involved in the teacher education system and prepare pre-service teachers for all education levels. Primary, secondary and high school teacher candidates take the Public Personnel Selection Exam (KPSS) in order to start working in a public school after graduating from the faculties of education. In the KPSS exam, which is a multiple-choice exam in the fields of general culture, general proficiency and educational sciences, there are no questions regarding subject matter knowledge. After this, they take field exams based on their specialism. Those who are successful in these two exams are interviewed to identify whether they have the necessary qualities to become a teacher. Candidates are appointed on the basis of their average scores from all these exams subject to the availability of placements. (MoNE, 2015).
Purpose of the study
The rise in importance of computation with respect to STEM fields is a primary motivation of this study. Since digital skills are considered as a core component for STEM disciplines (García-Peñalvo & Mendes, 2018; Hendry, Hays, Lynch, & Challinor 2016; Hunter & O’Brien, 2018; Scaradozzi et al., 2016), computational thinking skills as well as technology usage and attitudes may take a central role in STEM education as a means of driving higher-order thinking skills. It is argued that computational thinking particularly relates to the STEM fields (National Research Council, 2011). As Günbatar and Bakırcı (2019) suggest, computational thinking may have the most significant effect in STEM education, but has not yet sufficiently penetrated into education programs in Turkey. Therefore, possessing effective computational thinking skills may lead students to pursue STEM-related majors (Weintrop et al., 2016). The concepts and implementations of computational thinking and digital technologies appear to be fundamental in STEM education in terms of acquiring knowledge of the relevant disciplines. Here, a debate and discussion, for quick acceleration in awareness, interest, attitudes and skills for STEM, can be raised around key questions such as: How is computational thinking and digital technology use related to STEM awareness? To what extent does computational thinking and digital technology use predict STEM awareness? Our aim in this paper is to explore and develop on what characterizes computational thinking and technology use and attitudes to advance STEM education. The contribution of this work is to provide a model that can be used to enrich STEM education. For administrators and policy makers, the model is meant to help set priorities for STEM education in this data-driven era. Furthermore, enhancing understanding of how these concepts are related may also help stakeholders design better professional development interventions which consider teachers’ needs.
Theoretical framework
Computational thinking has become increasingly predominant in the literature in recent years. Although there is no consensus on the definition of this term, it can be considered as a process of developing design, application and algorithmic thinking skills to solve a series of problems. It includes identifying a problem, understanding the problem, and introducing the algorithms for problem-solving (Brennan & Resnick, 2012; Román-González, Pérez-González, & Jiménez-Fernández, 2017). Similarly, Shute, Sun and Asbell-Clarke (2017) conceptualize computational thinking as having six basic pillars that are decomposition, i.e., breaking a complex problem into smaller units, abstraction, i.e., extracting the core features of complex problems, algorithm design, i.e., creating a series of ordered steps/instructions to implement solutions, debugging, i.e., identifying and fixing errors when solutions do not operate as expected, iteration, i.e., iterative process of patterns to accomplish the goal, and generalization, i.e., reusing problem-solving strategies in different contexts. Rather than raising generic arguments about computational thinking, this present study refers to the key elements highlighted by Korkmaz, Çakir and Özden (2017) and these are creative thinking, algorithmic thinking, critical thinking, problem-solving, cooperative learning and communication. In line with this perspective, the key features of computational thinking include problem-solving, understanding problems, formulating problems and algorithmic thinking (Liu & He, 2014; Wing, 2006; Wing, 2014). It was identified by the International Society for Technology Education as one of the seven skills that today’s students should acquire (ISTE, 2016). Computational thinking employs common ways of mathematical thinking in the process of problem-solving, of engineering in designing and assessing a complex system and of scientific thinking in understanding concepts such as computability, intelligence, mind and human behavior (Wing, 2011). Similarly, Kalelioğlu (2015) emphasizes that computational thinking is an ability to abstract information through computer applications or to perform abstraction and modelling skills. From this point of view, it can be said that the goal of introducing the computational thinking is essential to prepare young generations for their futures and STEM education in this increasingly technological age.
Connectivity through mobile and digital technologies and the use of social media has grown worldwide. According to the Turkish Statistical Institute (TUIK), computer use was 59.6% and internet use was 72.9% within the 16-74 age group in Turkey in 2018 (TUIK, 2018). Furthermore, 83.8% of households had access to the internet from home. In addition, 51% of the population were active social media users (We Are Social, 2018). These stunning developments also have an impact on education which has a close relation with social change. That is, the classroom practices have greatly changed over time due to advancing technology. Effective and efficient use of current technologies is of great importance for teaching settings. At this juncture, teachers are key stakeholders in raising digitally literate students in the process of keeping pace with the fast and dynamic structure of the digital age and of evolving into an information society. Thus, the perceptions, beliefs, attitudes, and daily usage intensity of teachers are essential not only for effective use and adoption of digital technologies but also develop students’ creativity, problem-solving and thinking skills, which are essential for both computational thinking and STEM education. We therefore proposed the following hypotheses:
H1 Pre-service teachers’ computational thinking skills positively influence their STEM awareness.
H2 Pre-service teachers’ media and technology use and attitudes positively influence their STEM awareness.
H3 There is a positive relation between computational thinking skills and media and technology and attitudes of pre-service teachers.
There is evidence that STEM-related course experience is a statistically significant indicator of success and that academic discipline is an important factor in STEM teaching (Günbatar & Bakırcı, 2019; Kokkelenberg & Sinha, 2010). Contrastingly, some studies indicate that particular students’ characteristics, rather than STEM experience, are the key predictors (Wladis, Hachey & Conway, 2014). Arguably, the age and experience of teachers appears to influence the implementation of education in STEM disciplines in Turkey. Hence, we set forth the following hypotheses:
H4 STEM-related majors of pre-service teachers positively influence their STEM awareness. H5 Pre-service teachers’ STEM awareness is positively related to their age range.
Likewise, the literature varies with respect to investigation of the relations between STEM and gender-based differences. According to Hill, Corbett, and Rose (2010) women pursue STEM programs at lower rates than men and Wang and Degol (2013) state that women graduate with fewer than one-third of undergraduate degrees in mathematics, computer science, engineering, and the physical science. This indicates that females perceive STEM disciplines to be male gendered and are much more likely to pursue degrees outside of the STEM fields. As a result, females are often underrepresented in STEM-related professions (Shute et al., 2017). At this point, computational thinking may be considered to motivate individuals, females in particular, to major in science fields. However, there are other studies suggesting that women and men are equally committed to their academic careers in STEM (Xu, 2008). Therefore, we put forth the following hypothesis:
H6 Pre-service teachers’ STEM awareness is positively related to their gender.
Furthermore, several studies demonstrate that there is a significant relationship between STEM and school-based factors. For instance, Maltese and Tai (2011) indicate that majority of students who specialize in STEM make that choice during high school. Similarly, Alacaci and Erbaş (2010) reveal that school type is a considerable factor in students’ success in STEM subjects in Turkey. Thus, we generated the following hypothesis:
H7 Pre-service teachers’ STEM awareness is positively related to their high school types. In addition, Moakler and Kim (2014) find that students are more likely to choose STEM majors if they have parents with STEM occupations. Similarly, parents’ educational background is influential on students’ decisions on what to major in and ultimately, whether to earn a STEM degree (Crisp, Nora, & Taggart, 2009). In this framework, we put forth the following hypotheses:
H8 Pre-service teachers’ STEM awareness is positively related to the educational backgrounds of their fathers.
H9 Pre-service teachers’ STEM awareness is positively related to the educational backgrounds of their mothers.
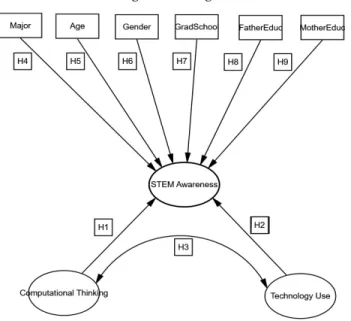
We believe that it is essential to examine how important it is to raise awareness of STEM, a contemporary approach in education, in this century in which media and technology use has become widespread in all areas of life in the age of computational thinking. In this context, our primary interest in this study is in exploring how the aforementioned variables relate to STEM awareness and the extent to which STEM awareness among pre-service teachers is explained by computational thinking skills level as well as media and technology use and attitudes considering the variables of “majors, age, gender, high school type, parent educational background.” That is, it was tested whether pre-service teachers’ computational thinking levels and their media and technology usage and attitudes considering these variables predict their STEM awareness through a proposed model.
Method
This study proposes a model that explains and predicts the relations between computational thinking skills, technology usage and attitudes, STEM awareness and a set of other variables. Therefore, this research is a relational survey model (Karasar, 2005).
Research design
The conceptual research model is given in Figure 1.
Participants
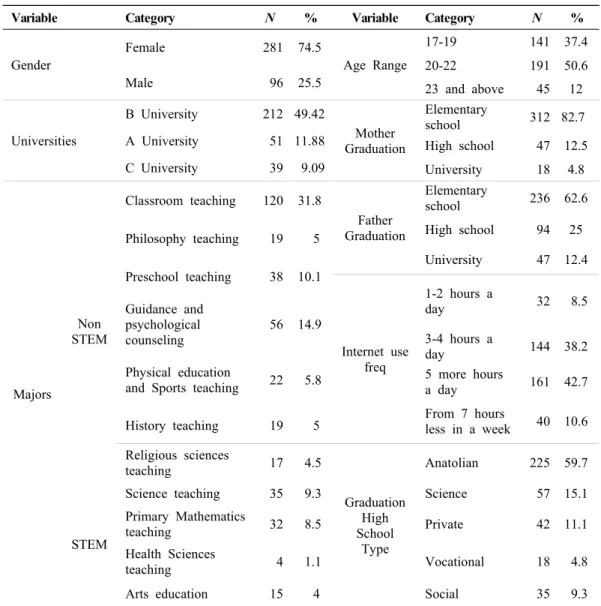
Participants comprise 377 undergraduate students who studied in the 2018-2019 academic year. These participants were selected using the convenient sampling method from non-random sampling methods and voluntarily involved in the research. The pre-service teachers studied in three different state universities in the south, north and central parts of Turkey. Participants’ descriptive information is given in Table 1. To define a STEM major, we use the categorization utilized by the National Science Foundation Advance Program [NSFAP] (2001) where majors such as engineering, physical sciences, earth, atmospheric or ocean sciences, mathematical and computer sciences, and biological and agricultural sciences are considered to fall within the STEM category.
Table 1. Descriptive information about participants
Variable Category N % Variable Category N %
Gender
Female 281 74.5
Age Range
17-19 141 37.4
20-22 191 50.6
Male 96 25.5 23 and above 45 12
Universities B University 212 49.42 Mother Graduation Elementary school 312 82.7
A University 51 11.88 High school 47 12.5
C University 39 9.09 University 18 4.8 Majors Non STEM Classroom teaching 120 31.8 Father Graduation Elementary school 236 62.6 High school 94 25 Philosophy teaching 19 5 University 47 12.4 Preschool teaching 38 10.1 Internet use freq 1-2 hours a day 32 8.5 Guidance and psychological counseling 56 14.9 3-4 hours a day 144 38.2 Physical education
and Sports teaching 22 5.8 5 more hours a day 161 42.7
From 7 hours less in a week 40 10.6 History teaching 19 5 Religious sciences teaching 17 4.5 Graduation High School Type Anatolian 225 59.7 STEM
Science teaching 35 9.3 Science 57 15.1
Primary Mathematics
teaching 32 8.5 Private 42 11.1
Health Sciences
teaching 4 1.1 Vocational 18 4.8
Three different regions were preferred in choosing the universities with official permits to reflect the overall country. University A, which was opted for conducting the study, is an institution preferred by students from different cultures in the capital city and has a STEM center. University A is one of the first universities to have an educational faculty in Turkey. University B was founded in 2008 and is generally preferred by students living in southern regions. It is a university with a STEM workplace within the education faculty. University C was also founded in 2008 and is situated in the northern part of Turkey. It is a university in which STEM studies are carried out within the faculty of education. Both Universities B and C are fresh and dynamic institutions. The main reason for choosing these three universities is that the participants were somehow familiar with STEM education.
A wide range of majors such as religion, guidance and psychological counselling, and arts were purposively included in the study. It was considered that inclusion of different disciplines in addition to STEM fields could have led to interesting findings. The educational backgrounds of pre-service teachers are also important as it is possible to become a teacher after graduating from different high schools in Turkey. For instance, a student who graduated from a teacher training high school can continue their undergraduate education in education faculties, and a student who graduated from a vocational and technical high school can also enroll in the education faculty. In this context, it was considered that high school types of pre-service teachers could be an important factor in the proposed model. Considering parental education, the majority of mothers are primary school graduates as are the fathers. However, fathers appear to graduate with a slightly higher level than mothers.
Data collection instruments
Computational Thinking Scale was developed by Korkmaz, Çakir and Özden (2017) for university students. It consists of 29 items and five factors in total. “Creativity” (α = .84) sub-dimension consists of 8 items (e.g. I believe I can solve problems that may arise when I experience a new situation). “Algorithmic Thinking” (α = .86) sub-dimension consists of 6 items (e.g. I can immediately set up the equation to solve a problem). “Cooperation” (α = .84) sub-dimension consists of 4 items (e.g. I like to have cooperative learning experiences with my group friends). “Critical Thinking” (α = .78) sub-dimension consists of 5 items (e.g. There is a systematic method that I use when comparing and making choices) and “Problem Solving” (α = .72) sub-dimension consists of 6 items (e.g. I have difficulty in imagining the solution of the problem in my mind). Goodness of fit indices revealed that the model was confirmed and this structure is valid for measuring computational thinking (χ2 = 1169.93, d = 362, p < .01, CMIN/DF = 3.23, RMSEA = 0.06, SRMR = 0.04, GFI = 0.91, AGFI = 0.90, CFI = 0.95, IFI = 0.97). Cronbach alpha (α) consistency coefficient observed for the scale used in this study is at a high level (.85).
Media and Technology Usage and Attitudes Scale was developed by Rosen,Whaling, Carrier, Cheever, and Rokkum, (2013) and was adapted into Turkish by Özgür (2016). It consists of 60 items and 15 factors in total. “Smartphone usage” (α = .89) sub-dimension consists of 9 items (e.g. Accessing the internet on mobile phone), “general social-media usage” (α = .82) sub-dimension consists of 9 items (e.g. Checking Facebook page or other social networks), “internet searching” (α = .78) sub-dimension consists of 4 items (e.g. Searching on the internet to obtain information via any devices), “E-mailing” (α = .74)
sub-dimension consists of 4 items (e.g. Receiving, reading and sending emails (except spam or junk e-mail), “media sharing” (α = .85) sub-dimension consists of 4 items ( e.g. Sharing your own media files such as photos and videos on the computer), “text messaging” (α = .76) sub-dimension consists of 4 items (e.g. Receiving and sending text messages (SMS) by mobile phones), “video gaming” (α = .71) sub-dimension consists of 3 items (e.g. Playing games on your own on PC, video console (PlayStation, Xbox, etc.) or on your smartphone) , “phone calling” (α = .84) sub-dimension consists of 2 items, “television viewing” (α = .83) sub-dimension consists of 2 items (e.g. Watching programs, films, etc. on TV), “online friendships” (α = .85) sub-dimension consists of 2 items (e.g. How many people have you met online with whom you have never met face-to-face?), “social media friendships” (α = .87) sub-dimension consists of 2 items (e.g. How many of your friends do you personally know on Facebook?) , “positive attitude towards technology” (α = .76) sub-dimension consists of 6 items (e.g. I feel it's important to be able to access any information online whenever I want), “anxiety and dependence” (α = .74) sub-dimension consists of 3 items (e.g. I feel worried when there is no access to the internet), “negative attitude towards technology” (α = .82) sub-dimension consists of 3 items (e.g. New technologies make life more complicated) , and “multitasking preferences” (α = .82) sub-dimension consists of 4 items (e.g. I prefer to work on various projects throughout the day instead of finishing long term projects and moving on to another). Goodness of fit indices revealed that the model was confirmed and this structure is valid to measure media and technology use and attitudes (χ2 = 4330.49, d = 1605, p < .05, CMIN/DF = 2.69, RMSEA = .04, SRMR = .046, GFI = .93, AGFI = .91, CFI = .95, IFI = .95). Cronbach alpha (α) consistency coefficient observed for the scale in this study is at a high level (.94).
STEM Awareness Scale was developed by Çevik (2017) to identify the STEM awareness of teachers. It consists of 15 items and three factors. “effects to student” (α = .81) sub-dimension consists of 6 items (e.g. STEM improves students' analytical thinking skills), “effects to course” (α = .71) sub-dimension consists of 5 items (e.g. High-level materials are needed for STEM), and “effects to teacher” (α = .70) sub-dimension consists of 4 items (e.g. Teachers can easily plan STEM education in in-class / extra-curricular activities). Goodness of fit indices revealed that the model was confirmed and that this structure is valid for measuring STEM awareness (χ2 = 156.87, d = 247, p < .01, GFI = 0.92, AGFI = 0.90, SRMR = 0.057, NFI = 0.94, NNFI = 0.96, CFI = 0.97, IFI = 0.96). Cronbach alpha consistency coefficient observed for the scale in this study is at a high level (.82). All data collection instruments were digitalized and sent in one batch to the participants online by using Google Forms. The scales were applied online through mobile phones, laptops or computers during a course hour (40 minutes) approved by the department head and accepted by the course instructor. For this, a faculty member working in these three education faculties of three different universities was assigned as responsible by the department. The responsible faculty members were informed by the researchers about the study and then they briefly informed the participants and stated that participation was on a voluntary basis. The responsible faculty member was contacted and notified when deficiencies were identified. Thus, data losses were prevented so far as possible.
Data analysis
frequently used in social research in recent years, was applied. SEM is a powerful statistical technique that establishes measurement models and structural models. On the other hand, regression is considered a sophisticated and well-developed modeling approach to data analysis (Nusair & Hua, 2010). SEM is a statistical methodology combining the strength of factor analysis and path analysis. It is carried out by constructing a measurement model and a structural model. The measurement model identifies relations between observed and latent variables. By means of confirmatory factor analysis, the measurement model provides the link between scores on an instrument and the constructs that they are designed to measure. SEM identifies casual relations among the latent variables by specifying that particular latent variables directly or indirectly influence certain other latent variables in the model (Byrne, 2001). When research questions are raised to address relationships between latent variables in a study, SEM is probably a good choice according to regression (Nusair & Hua, 2010). Beyond the difference between the incorporation of manifest variables versus latent variables, Bollen and Pearl (2013) argue for much deeper differences between regression analysis and SEM (and also path analysis). As a result, they state that SEM has stronger aspects than regression. Similarly, Dursun and Kocagöz (2010) report that the low regression value of the variance explained in other analytical methods such as progressive or logistic regression may result from the difficulty of investigating indirect effects in such methods. The result of the difference is important in explained variances. In multivariate model analysis, the aim is to see the extent to which a change in one variable among the independent variables will lead to alterations in the dependent variable. However, to identify to what degree independent variables explain the change in the dependent variable, it would be more reasonable to use SEM. Therefore, SEM was used to examine relations between STEM awareness of teachers and various variables and a model was created by means of the AMOS 21.0 program to reveal the strength of computational thinking and media and technology usage and attitudes to predict their STEM awareness by identifying the effect of these variables on STEM awareness. To examine the compatibility level of relation patterns in the proposed model, χ2 (chi-square fit index test), RMSEA (the root mean square error of approximation), GFI (goodness of fit index), CFI (comparative factor index), NFI (normed fit index) fit index tests were used and analyzed.
The scores of the dependent and independent variables were subjected to the two-step cluster analysis because the participants in the study group could display a heterogeneous structure in terms of the scores obtained from the data collection instruments and therefore the participants could have come from separate universes. Two-step cluster analysis is a multivariate statistical analysis that divides a heterogeneous sample into a homogeneous sub-group and calculates the descriptive measures of the homogeneous groups in a different way. The normality distribution of the total scores obtained from the data collection instruments applied in the study was analyzed using the Kolmogorov-Smirnov test. In the cluster analysis, only the normality of distance values is considered sufficient despite the assumption of normality with respect to the data (Tatlıdil, 2002). The Kolmogorov-Smirnov test can be used for this. The data obtained from the participants were first subjected to the two-step cluster analysis and then examined with SEM. Before the model was designed, multivariate and univariate normality had been checked in all data sets prepared for analysis by removing missing data with the listwise method for major, age, gender, high school, father’s education background, and mother’s education background. It was observed that most of the variables did not meet the assumption of normality criteria. Based on this, robust maximum likelihood estimation method (RMLE) was employed in the analyzes and
asymptotic covariance matrices were formed. Firstly, the model was imagined for each possible value and tested to see whether model fit values, standardized factor loads, error values, path coefficients were significant. Then the model was tested for all groups and all possible values and the model fit was examined for each group. Finally, for each independent variable, the model considered each possible value and the mean of fit indices and path coefficients were examined together with their significance, and standardized factor loads and error values were examined separately for all possible values.
Both categorical and continuous variables were used in this study. Firstly, normality distribution of the continuous data was examined with skewness and kurtosis coefficients. Since these coefficients were close to zero (highest = 0.77, lowest = 0.11), it was confirmed that the data were normally distributed. In addition, histogram and p-plot graphs were examined for continuous data and it was observed that variable errors indicated normal distribution. The distribution of variable errors and the estimated values of the variable errors on the scatterplot were examined and it was observed that assumption of covariance was provided.
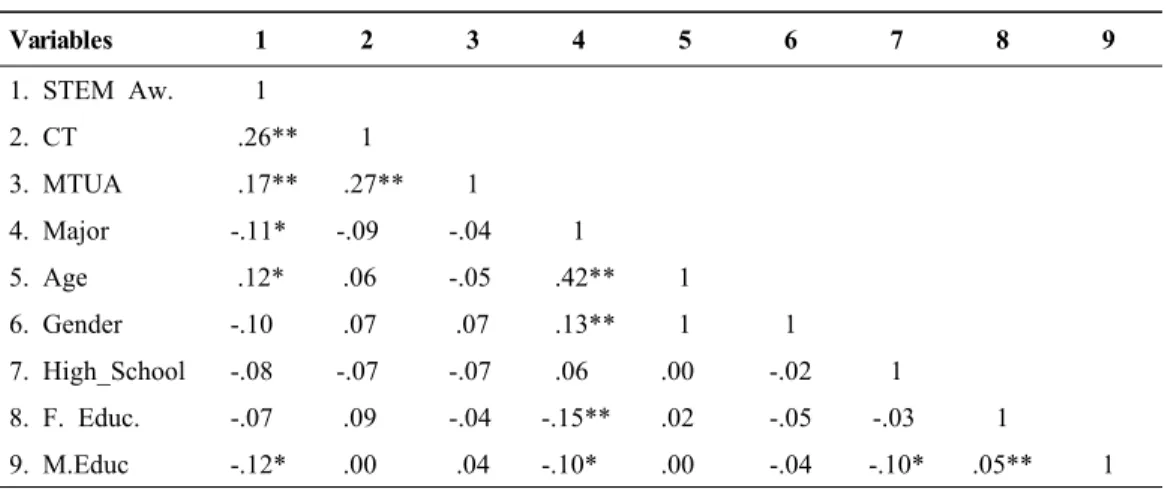
Table 2. Pearson product moments correlation coefficients for all variables (n =377)
Variables 1 2 3 4 5 6 7 8 9 1. STEM Aw. 1 2. CT .26** 1 3. MTUA .17** .27** 1 4. Major -.11* -.09 -.04 1 5. Age .12* .06 -.05 .42** 1 6. Gender -.10 .07 .07 .13** 1 1 7. High_School -.08 -.07 -.07 .06 .00 -.02 1 8. F. Educ. -.07 .09 -.04 -.15** .02 -.05 -.03 1 9. M.Educ -.12* .00 .04 -.10* .00 -.04 -.10* .05** 1 * p < .05, ** p < .01
STEM Aw.: STEM Awareness, CT: Computational Thinking, MTUA: Media and Technology Use and Attitude
Table 2 shows that STEM awareness and computational thinking scores were positively and moderately significant (r = .26, p < .01). Similarly, it is seen that STEM awareness and MTUA scores were positively and moderately significant (r = .17, p < .01). Furthermore, there were a positively and moderately significant correlation between CT and MTUA (r = .27, p < .01). STEM awareness and major scores were negatively and lowly significant (r = -.11, p < .05), STEM awareness and age scores were positively and lowly significant (r = .12, p < .05), and STEM awareness and mother education background scores were positively and lowly significant (r = -.12, p < .05). After examining the relationships between the predicted and predictor variables in the study, the predictive effects of computational thinking, MTUA, major, age and mother education background on STEM awareness were tested by path analysis.
Ethical approval
This study was approved by the Scientific Research and Ethical Council (IRB), Karamanoğlu Mehmetbey University, Turkey, (IRB no. 01/01/2018). Informed consent was obtained from the participants.
Findings
Just before testing the hypotheses, cluster analysis was employed to reveal a more detailed result in determining the scores (Table 2). The lowest score that can be obtained from the STEM awareness scale is 15 and the highest score is 225. The higher the scores the higher the STEM awareness level. The distribution of normality for the overall scale was tested with Kolmogorov-Smirnov. Accordingly, it was observed that the total score variable of the dimensions did not show normal distribution (p < .01). Due to this finding, descriptive statistics regarding the total score variable were determined as median and quarter deviation. The median value of the scale was 57.00. This score was accepted as the threshold value. When the score is subjected to clustering, as shown in Table 3, the first cluster included the group with “lack of awareness”, the second cluster included the group with “low awareness”, and the third cluster included the group with “high awareness”. Table 3. Two step cluster analysis for STEM awareness
Cluster n X %
1. Lack of Awareness 120 45 32
2. Low Awareness 102 57 27
3. High Awareness 155 63 41
STEM awareness was low and high for individuals with item total score above the threshold and those with item total score below threshold had no STEM awareness, as seen in Table 3. Almost half of the pre-service teachers participating in the study had high STEM awareness, followed by lack of awareness and low awareness.
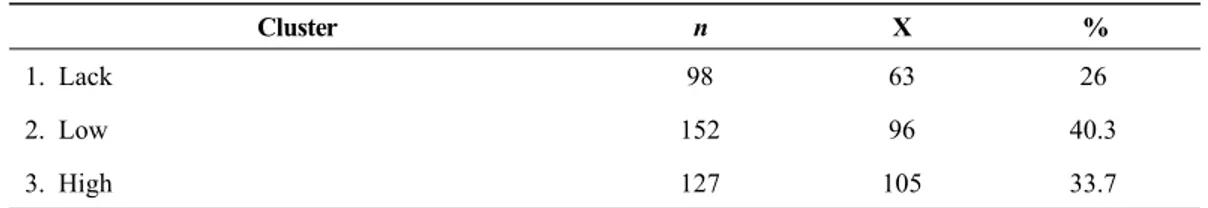
When computational thinking skills scores of the participants were subject to the clustering analysis (Table 4), the first cluster included the group with “lack of computational thinking skills”, the second cluster included the group with “low computational thinking skills”, and the third cluster included the group with “high computational thinking skills”. The lowest score that can be obtained from the Computational Thinking Skills scale is 29 and the highest score is 145. The higher the scores, the higher the level of computational-thinking skills. The distribution of normality for the overall scale was tested with Kolmogorov-Smirnov. Accordingly, it was observed that the total score variable of the scale did not show normal distribution (p < .05). Due to this finding, descriptive statistics regarding total score variable were determined as median and quarter deviation. The median value of the total score variable of the scale was 100.00. This score was accepted as a threshold.
Table 4. Two step cluster analysis for computational thinking skills
Cluster n X %
1. Lack 98 63 26
2. Low 152 96 40.3
3. High 127 105 33.7
As seen in Table 4, almost half of the pre-service teachers participating in the study had low computational thinking skills followed by high and lack.
The lowest score from the Media and Technology Usage and Attitude scale is 60 and the highest score is 600. The higher the scores, the higher the media and technology usage and attitude level. The distribution of normality related to the overall scale was tested with Kolmogorov-Smirnov. Accordingly, it was observed that the total score variable did not show normal distribution (p < .01). Due to this finding, descriptive statistics regarding total score variable were determined as median and quarter deviation. The median value of the total score variable was found as 356. This score was accepted as the threshold value. When the obtained score was subjected to clustering, as shown in Table 5, the first cluster included the group with “lack of media and technology use and attitude”, the second cluster included the group with “high of media and technology use and attitude”.
Table 5. Two step cluster analysis for media and technology usage and attitudes
Cluster n X %
1. Lack 142 288 37.7
2. High 235 347 62.3
It was considered that media and technology usage and attitude is high for individuals whose item total score is above the threshold values and insufficient for individuals whose item total score is below the threshold value. It can be said that the pre-service teachers participating in the study had high media and technology usage and attitude levels.
Based on the clustering analysis, the majority of pre-service teachers participating in the study had low or insufficient STEM awareness, partial computational thinking skills and sufficient media and technology usage and attitudes in general. Figure 2 displays coefficients of the structural equation model formed by the variables selected in line with the data. Relationships between “major, age, and mother’s education background,”, which are endogenous variables to predict “STEM awareness” latent variable, which was the predicted variable of the research and “computational thinking” and “media and technology usage and attitudes” were displayed by the path diagram. Prior to identifying the correlations with the structural equation model, it is necessary to test fit indices of the measurement model with latent variables. The fit indices criteria and the values obtained in the research are given in Table 6.
-.11 .12 -.16 .21 .35 .23
Figure 2. Path diagram to predict STEM awareness
The model fit indices of the established model in Figure 2 were initially examined without applying any modification process, but it was observed that the model did not meet the goodness of fit criteria (χ2 = 1252.38, sd = 296, χ2/sd = 4.23, RMSEA = .093, SRMR = 3.61 CFI =.68, GFI = .77, NFI = .62, TLI = .65). Then the suggested modifications for the model were examined considering the literature and errors related to variables were associated with two-way covariance. After this modification process, it was observed that the model met the goodness of fit criteria, which means the data obtained by the established model in the study were a sufficient fit and the model was approved (Table 6). It was seen that fit indices that were examined to identify efficiency level of the structural equation model have good fit with the calculated values (Bentler, 1980; Brown & Cudeck, 1992). Table 6. Fit indices of the model
Indices Perfect Fit Acceptable Fit Criteria Values Obtained Status
1χ2/sd 0 ≤ χ2/sd ≤ 2 2 ≤ χ2/sd ≤ 5 2.3 Acceptable Fit
2CFI .95 ≤ CFI ≤ 1.00 .90 ≤ CFI ≤ .95 .91 Acceptable Fit
2NFI .95 ≤ NFI ≤ 1.00 .90 ≤ NFI ≤ .95 .90 Acceptable Fit
2TLI .95 ≤ TLI ≤ 1.00 .90 ≤ TLI ≤ .95 .90 Acceptable Fit
2IFI .95 ≤ IFI ≤ 1.00 .90 ≤ IFI ≤ .95 .91 Acceptable Fit
2GFI .95 ≤ GFI ≤ 1.00 .50 ≤ GFI ≤ .95 .88 Acceptable Fit
2AGFI .95 ≤ AGFI ≤ 1.00 .50 ≤ AGFI ≤ .95 .84 Acceptable Fit
3RMSEA .00 ≤ RMSEA ≤ .05 .05 ≤ RMSEA ≤ .10 .06 Acceptable Fit
4SRMR .00 ≤ SRMR ≤ .05 .05 ≤ SRMR ≤ .10 .07 Acceptable Fit
5PCFI Goodness of fit close to 1 .84 Acceptable Fit
1 Kline (2011), Tabachnick & Fidell, (2007), Schermelleh Engel, Moosbrugger & Müller, (2003), 2 Hair et al. (2009) Tabachnick & Fidell, (2007),
3 Meyers, Gamst & Guarino, (2006),
4 Brown & Cudeck, (1992), Schermelleh-Engel, Moosbrugger & Müller, (2003), 5 Arbuckle (2003), Byrne (2001)
It is seen that “computational thinking”, which consists of 5 sub-dimensions, is the most significant variable with the highest correlation coefficient (ߓ = .35), when examining variables predicting STEM awareness of pre-service teachers. The “critical thinking”, one of the sub-dimensions, has the highest factor load. The correlation coefficient of “media and technology usage and attitudes”, which has 15 sub-dimensions, is also high (ߓ = .21). “Social network usage”, one of the sub-dimensions, has the highest factor load. Another variable that appears to be significant is “age” (ߓ = .12), followed by “mother’s education background” (ߓ = -.16) and “major” (ߓ = -.11). The STEM awareness scale consists of 3 sub-dimensions and the “effect to students” sub-dimension resulted with the highest factor load.
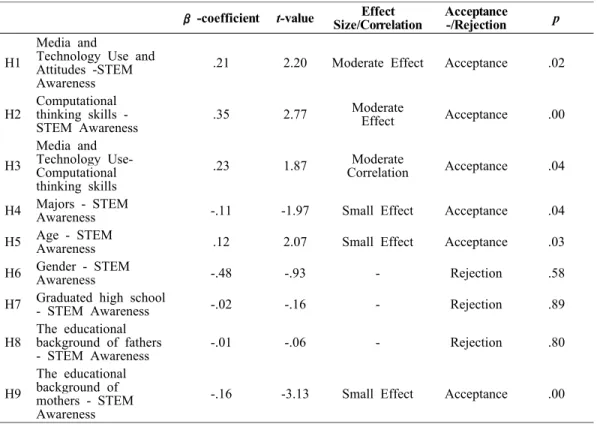
At this stage, the effect size of path coefficients was examined. According to Kline (2011), if the path coefficient is less than 0.10, it can be interpreted as a small effect, about 0.30 as a medium effect, and if it is 0.50 and or above, it can be interpreted as a large effect. Table 7. Hypothesis acceptance/rejection results
β-coefficient t-value Size/CorrelationEffect Acceptance -/Rejection p
H1
Media and
Technology Use and Attitudes -STEM Awareness
.21 2.20 Moderate Effect Acceptance .02
H2 Computational thinking skills -
STEM Awareness .35 2.77 Moderate Effect Acceptance .00 H3 Media and Technology Use- Computational thinking skills
.23 1.87 CorrelationModerate Acceptance .04
H4 Majors - STEM Awareness -.11 -1.97 Small Effect Acceptance .04
H5 Age - STEM Awareness .12 2.07 Small Effect Acceptance .03
H6 Gender - STEM Awareness -.48 -.93 - Rejection .58
H7 Graduated high school - STEM Awareness -.02 -.16 - Rejection .89
H8 The educational background of fathers
- STEM Awareness -.01 -.06 - Rejection .80
H9
The educational background of mothers - STEM Awareness
-.16 -3.13 Small Effect Acceptance .00
As seen in Table 7, the highest path coefficients of the accepted hypothesis were computational thinking skills (.35) and media and technology use and attitude (.21) that were endogenous variables, respectively. Among the exogenous variables, the highest path coefficient to predict STEM awareness was educational background of the mother (-.16), while the lowest path coefficients to predict STEM awareness were age (.12), followed by the major variable (-.11). Similarly, a moderate correlation between computational thinking and technology and media use and attitudes was identified (r = .23, p < .05) and thus the hypothesis was accepted (H3).
The hypothesis that a high level of media and technology usage and attitudes of the pre-service teachers predicted their STEM awareness (H1) was confirmed with the established model. This indicates that media and technology use and attitude are closely related to STEM awareness. Similarly, the hypothesis about the relationship between the high STEM awareness of pre-service teachers who had computational thinking skills was confirmed with the established model (H2). Computational thinking skills and STEM awareness are two factors that affect each other because STEM is an approach that incorporates technology/design meaning that someone who has computational thinking skills would also have STEM awareness. The hypotheses that major (H4) and age (H5) variables significantly predict STEM awareness were confirmed with the established model.
Discussion and conclusion
According to results of SEM analysis, STEM awareness was significantly predicted by the variables of “computational thinking, media and technology usage and attitude, major, age, mother’s educational background”. Findings are in line with the results of various studies in the literature. For instance, there are a lot of studies reporting the positive effect of media and technology usage and attitudes (DeCoito & Richardson, 2018; Hunter, 2017; Karahan, Canbazoglu-Bilici, & Ünal, 2015; Wu & Anderson, 2015).
The result indicated that computational thinking is a positively significant factor in predicting STEM awareness. Some studies are consistent with this result (Beheshti, et al., 2017; Lee et al., 2011; Weintrop et al., 2016). Similarly, Calderon (2018) states that STEM subjects have higher impact on the students’ performance in computational thinking components. There are also studies examining the impact of STEM activities on computational thinking skills carried out by collaborative learning and project-based learning strategies (Hsu, Chang, & Hung, 2018; Young 2018).
Another hypothesis accepted in the research is that majors of pre-service teachers are important in predicting their STEM awareness. This can be expected as some specialized schools offer advanced courses in STEM subjects. According to the established model, majors predict STEM awareness with a significant but negative effect. Although the majority of the pre-service teachers participating in the research were from STEM areas, this result may be influenced by the fact that a significant majority of them study in non-STEM areas. It is consistent with the result that STEM awareness is higher in STEM disciplines pre-service teachers (Asiroglu & Koc Akran, 2018). Similarly, Çevik (2018) states that STEM perceptions of engineer candidates are higher than pre-service teachers.
Another hypothesis confirmed in the study is that age of pre-service teachers significantly predicts their STEM awareness. This suggests that the number of years of teaching experience appears to influence the implementation of education in STEM. Some studies appear with the similar result in the literature. For instance, Çorlu, Capraro, & Capraro (2014) emphasize that age variable is one of the factors affecting the integration of STEM into schools in Turkey.
The gender variable did not have a significant effect on STEM awareness. This is in line with other studies that also report that gender did not have a significant effect on STEM awareness for both teachers and pre-service teachers (Bakırcı & Karışan, 2018; Bieri Buschor, Berweger, Keck Frei, & Kappler, 2014; Simon, Wagner, & Killion, 2017).
The mother’s educational background is one of the factors that predicts STEM awareness. This may be because in Turkey mothers are mostly responsible for educating their offspring and fathers are mostly engaged in working life. Various studies similarly argue that STEM achievement of students increases as the education level of the mother increases (Aydeniz, 2017; Herdem & Ünal, 2018; Marotto & Milner-Bolotin, 2018). There are both formal and informal ways to involve a student’s parents in STEM education; whether via email or a full-blown Family STEM Night plans, the key to successfully impacting student achievement and learning is using strategies that change the home dynamics long-term to promote parental engagement with at-home learning (Peterson, 2017). When children and parents work collaboratively on at-home learning, significant and meaningful improvements are observed in standardized test scores and grades (Altschul, 2011; Harris & Goodall, 2008). In terms of influencing a child’s career development, parents are active agents (Young & Friesen, 1992), and are a stronger influence on the child’s career choices than the peer network or the school (Schulenberg, Vondracek, & Crouter, 1984). To capitalize on that influence, parents need guidance.
In contrast, the predictive hypothesis of pre-service teachers’ gender and graduated high school type was rejected by the model. Similarly, the educational background of the father was rejected. This result is in line with previous studies (Günbatar & Bakırcı, 2019; Tekerek & Karakaya, 2018). However, some studies indicate different results. For instance, Marino, Black, Hayes and Beecher (2010) state that father’s and mother’s education did not have significant effect on students’ achievement in STEM-related courses. Similarly, Chachashvili-Bolotin, Milner-Bolotin and Lissitsa (2016) highlight that studying advanced science courses prior to higher education eliminates the effect of family background on students’ interest in pursuing STEM fields in the future.
Policy implications
From the findings, we conclude that STEM awareness among pre-service teachers is still not sufficiently high and their perceived computational skills are inadequate. Findings also show that computational thinking skills and media and technology use and attitudes have a moderate effect on STEM awareness. Therefore, it can be argued that computational thinking skills and media and technology usage and attitudes of pre-service teachers should be enhanced to nurture their awareness of the importance of the STEM field. The findings remind teacher educators to pay attention to the potential spectrum of computational thinking and media and technology use to increase STEM awareness. In Turkey, an integrated STEM approach does not currently appear in the curriculum. Considering the recent reports and plans by the MoNE related to STEM education, this approach is on the agenda of MoNE. Despite this, the pace of this agenda is somewhat slow (Altunel, 2018). According to an OECD report, Turkey appears in the last place among 34 countries that are likely to lead in the STEM professions in the future (OECD, 2017b). As findings suggest, it is essential to include courses and activities that would internalize the STEM education approach to pre-service teachers and increase the quality of education faculties. For this purpose, we recommend increasing both the cooperation among science and engineering faculties and the number of workshops. Furthermore, pre-service teachers can prepare lesson plans including more examples of computational thinking integration in STEM skills and implement their lesson plans in teaching practices.
At the same time, in the realization of STEM education, it is vital to synchronize infrastructure, equipment, labs and the workplaces of education faculties with the STEM approach and revise curricula accordingly to create enculturation of STEM in educational settings. It can be expected that pre-service teachers with high computational thinking skills and who use media and technology effectively are more likely to be aware of STEM teaching and become motivated to implement STEM education. Thus, computational thinking and effective media and technology use should be embedded in teacher education programs. This can be achieved through establishing a mutual link between math, science and computational thinking and updating classrooms with best practices.
Furthermore, based on our findings, educational awareness of the parents, mothers in particular, should be raised to increase the numbers of pre-service teachers with high STEM awareness. Therefore, it is recommended to inform parents via effective platforms to have a clear understanding on the outcomes of STEM. Since mothers are influential in students’ decision to choose the STEM stream, it is recommended that schools implement informative programs to create awareness of STEM careers for their children. Policy-makers and educational stakeholders should take measures for this. Based upon the major findings of this study, we propose a model, in which media and technology usage and attitudes and computational thinking skills are endogenous variables, major, age and mother’s education level are as exogenous variables. This model can be considered to predict STEM awareness of pre-service teachers in Turkey.
Limitation and future studies
Different variables that predict STEM awareness could be employed in the model. For instance, the model could be structured by 21st century skills or science or math academic achievements. Another limitation is that a predictive exogenous variable was not employed in the model. Future studies could consider this in conducting further research. In addition, another limitation is that the study’s participants could have been selected from other different universities and from different majors, and findings might be gender-biased due to large number of female participants in the study. On the other hand, it might be possible to obtain different results with a model in which computational thinking is centralized. In this regard, further studies are needed to investigate the contribution of computational thinking to STEM. In particular, realization of new models considering relations between approaches such as STEM, STEM+Arts, Technological Pedagogical Content Knowledge (TPACK) and computational thinking would contribute to our understanding.
Address for correspondence
Rıdvan Ata
Mugla Sitki Kocman University 48000, Kotekli, Mugla, Turkey Email: [email protected]
References
Ahonen, A. K., & Kinnunen, P. (2015). How do students value the importance of twenty-first century skills? Scandinavian Journal of Educational Research, 59(4), 395-412. doi:10.1080/00313831.2014.904423
Alacaci, C., & Erbaş, A. K. (2010). Unpacking the inequality among Turkish schools: Findings from PISA 2009. International Journal of Educational Development, 30(2), 182-192. doi:10.1016/j.ijedudev.2009.03.006
Altschul, I. (2011). Parental involvement and the academic achievement of Mexican American youths: What kinds of involvement in youths’ education matter most? Social Work Research, 35, 159-170. doi:10.1093/swr/35.3.159
Altunel, M., (2018). STEM education and Turkey: Opportunities and risks, Seta Perspective, 207, 1-7. [In Turkish]
Arbuckle, J. L. (2003). Amos 5.0 update to the AMOS user’s guide (s. 77-85). Chicago, IL: Small Waters Corp.
Asiroglu, S., & Koc Akran, S. (2018). The readiness level of teachers in science, technology, engineering and mathematics education. Universal Journal of Educational Research, 6, 2461-2470. doi:10.13189/ujer.2018.061109.
Aydeniz, M. (2017). Our educational system and our dream for 21st Century: A STEM-oriented roadmap for Turkey, moving forward to 2045 goals. University of Tennessee, Knoxville. [In Turkish]
Bakırcı, H., & Karışan, D. (2018). Investigating the preservice primary school, mathematics and science teachers’ stem awareness. Journal of Education and Training Studies, 6(1), 32–42. doi:10.11114/jets.v6i1.2807
Barak, M. (2017). Science teacher education in the twenty-first century: A pedagogical framework for technology-integrated social constructivism. Research in Science Education, 47(2), 283-303.
Beheshti, E., Weintrop, D., Swanson, H., Orton, K., Horn, M. S., Kona, J., & Wilensky, U. (2017, April). Computational thinking in practice: How STEM professionals use CT in their work. Paper presented at annual meeting of American Education Research Association, Vancouver, Canada.
Bentler, P. M. (1980). Multivariate analysis with latent variables: Causal modeling. Annual Review of Psychology, 31(1), 419-456.
Bieri Buschor, C., Berweger, S., Keck Frei, A., & Kappler, C. (2014). Majoring in STEM - What accounts for women’s career decision making? A mixed methods study. Journal of Educational Research, 107(3), 167–176. doi:10.1080/00220671.2013.788989 Bollen, K. A., & Pearl, J. (2013). Eight myths about causality and structural equations
models. In S. Morgan (Ed.), Handbook of causal analysis for social research (pp. 301-328). Dordrecht: Springer.
Brennan, K., & Resnick, M. (2012). New frameworks for studying and assessing the development of computational thinking. Proceedings of the 2012 annual meeting of the American Educational Research Association, Vancouver, Canada.
Brown, M. W., & Cudeck, R. (1992). Alternative ways of assessing model fit. Sociological Methods & Research, 21(2), 230-258. doi:10.1177/0049124192021002005
Byrne, B. M. (2001). Structural equation modeling with AMOS, basics concepts, applications, and programming. Hillsdale, NJ: Lawrence Erlbaum Associates.
Calderon A. (2018). Susceptibility to learn computational thinking against STEM attitudes and aptitudes. In Khine M. (Eds.), Computational thinking in the STEM disciplines.
Springer, Cham.
Capraro, M. M., & Nite, S. B. (2014). STEM integration in mathematics standards. Middle Grades Research Journal, 9(3), 1-10.
Chachashvili-Bolotin, S., Milner-Bolotin, M., & Lissitsa, S. (2016). Examination of factors predicting secondary students’ interest in tertiary STEM education. International Journal of Science Education, 38(3), 366-390.
Crisp, G., Nora, A., & Taggart, A. (2009). Student characteristics, pre-college, college, and environmental factors as predictors of majoring in and earning a STEM degree: An analysis of students attending a Hispanic serving institution. American Educational Research Journal, 46(4), 924–942. doi:10.3102/0002831209349460
Çevik, M. (2017). A Study of STEM awareness scale development for high school teachers. Journal of Human Sciences, 14(3), 2436-2452. doi:10.14687/jhs.v14i3.4673. [In Turkish]
Çevik, M. (2018). Investigating STEM semantics and perceptions of engineer candidates and pre-service teachers: A mixed method study. International Journal of Educational Technology, 5(2), 1-18.
Çorlu, M. S., Capraro, R. M., & Capraro, M. M. (2014). Introducing STEM education: Implications for educating our teachers in the age of innovation. Education and Science, 39(171), 74-85.
DeCoito, I., & Richardson, T. (2018). Teachers and technology: Present practice and future directions. Contemporary Issues in Technology and Teacher Education, 18(2), 362-378. Retrieved from https://www.learntechlib.org/primary/p/180395/
Dursun, Y., & Kocagöz, E. (2010). Structural equation modeling and regression: A comparative analysis. Erciyes University Journal of Faculty of Economics and Administrative Sciences, 35(2), 1-17.
Erdogan, I., & Ciftci, A. (2017). Investigating the views of pre-service science teachers on STEM education practices. International Journal of Environmental and Science Education, 12(5), 1055-1065.
Ergün, S. S. (2019). Examining the STEM awareness and entrepreneurship levels of pre-service science teachers. Journal of Education and Training Studies, 7(3), 142-149. García-Peñalvo, F. J., & Mendes, A. J. (2018). Exploring the computational thinking
effects in pre-university education. Computers in Human Behavior, 80, 407-411. Günbatar, M. S., & Bakırcı, H. (2019). STEM teaching intention and computational thinking
skills of pre-service teachers. Education and Information Technologies, 24(2), 1615-1629. Hair, J. F., Black, W. C., Babin, B. J., & Anderson, R. E. (2009). Multivariate data analysis
(7th ed.). Upper Saddle River, NJ: Prentice Hall.
Harris, A., & Goodall, J. (2008). Do parents know they matter? Engaging all parents in learning. Educational Research, 50(3), 277-289. doi:10.1080/00131880802309424.
Hendry, A., Hays, G., Lynch, D., & Challinor, K. (2016, December). Enhancing student learning through Project Based Learning (PBL) in a secondary school integrative STEM course. In 27th Annual Conference of the Australasian Association for Engineering Education: AAEE 2016 (p. 337). Southern Cross University.
Herdem, K., & Ünal, İ. (2018). Analysis of studies on STEM education: A meta-synthesis study. Marmara University Journal of Educational Science, 48(48). doi:10.15285/maruaebd.3 45486. [In Turkish]
Hill, C., Corbett, C., & St. Rose, A. (2010). Why so few? Women in science, technology, engineering, and mathematics. Washington, DC: American Association of University Women.
computational thinking: Suggestions based on a review of the literature. Computers & Education, 126, 296–310.
Hunter, K. D. (2017). Technology and student achievement in STEM subjects: Perspectives from teachers in grades 3rd-5th. University Honors Program Theses. 268. Retrieved from http://digitalcommons.georgiasouthern.edu/honors-theses/268
Hunter, J., & O’Brien, L. (2018). How do high school students create knowledge about improving and changing their school? A student voice co-inquiry using digital technologies. International Journal of Student Voice, 3(3).
International Society for Technology in Education. (2016). Computational Thinking Teacher Resources. Retrieved from https://id.iste.org/docs/ct-documents/ct-teacher-resourc ces_2ed-pdf.pdf?sfvrsn=2
Kalelioğlu, F. (2015). A new way of teaching programming skills to K-12 students: Code. org. Computers in Human Behavior, 52, 200-210.
Kan, A. Ü., & Murat, A. (2018). Investigation of prospective science teachers’ 21st century skill competence perceptions and attitudes toward STEM, International Online Journal of Educational Sciences, 10(4), 251-272.
Karahan, E., Canbazoglu-Bilici, S., & Ünal, A. (2015). Integration of media design processes in science, technology, engineering, and mathematics (STEM) education. Eurasian Journal of Educational Research, 60, 221-240. doi:10.14689/ejer.2015.60.15. Karasar, N. (2005). Scientific research method. Ankara: Nobel Publishing. [In Turkish] Kline, R. B. (2011). An easy guide to factor analysis. New York: The Guilford Press.
Knowles, J., Kelley, T., & Holland, J. (2018). Increasing teacher awareness of STEM careers. Journal of STEM Education, 19(3), 47-55.
Kokkelenberg, E. C., & Sinha, E. (2010). Who succeeds in STEM studies? An analysis of Binghamton University undergraduate students. Economics of Education Review, 29(6), 935-946.
Korkmaz, Ö., Çakir, R., & Özden, M. Y. (2017). A validity and reliability study of the Computational Thinking Scales (CTS). Computers in Human Behavior, 72, 558-569. Lee, I., Martin, F., Denner, J., Coulter, B., Allan, W., Erickson, J., Malyn-Smith, J., &
Werner, L. (2011). Computational thinking for youth in practice. Journal of Computational Science Education, 2(1), 1-10.
Liu, B., & He, J. (2014). Teaching mode reform and exploration on the university computer basic based on computational thinking training in network environment. Proceedings of the 9th International Conference on Computer Science & Education, Vancouver, Canada, 59-62.
Maltese, A. V., & Tai, R. H. (2011). Pipeline persistence: Examining the association of educational experiences with earned degrees in STEM among US students. Science Education, 95(5), 877-907.
Marino, M. T., Black, A. C., Hayes, M. T., & Beecher, C. C. (2010). An analysis of factors that affect struggling readers' achievement during a technology-enhanced STEM astronomy curriculum. Journal of Special Education Technology, 25(3), 35-47. Marotto, C. C. F., & Milner-Bolotin, M. (2018). Parental engagement in children’s STEM
education. Part II: Parental attitudes and motivation. International Journal on Math, Science and Technology Education, 6(1), 60-68.
Meyers, L.S. Gamst, G., & Guarino, A. (2006). Applied multivariate research: Design and interpretation. Thousand Oaks, CA: Sage.
Ministry of National Education. (2015). Teacher appointment and relocation regulation. Retrieved from https://www.resmigazete.gov.tr/eskiler/2015/04/20150417-4.htm. [In Turkish]
Moakler Jr, M. W., & Kim, M. M. (2014). College major choice in STEM: Revisiting confidence and demographic factors. The Career Development Quarterly, 62(2), 128-142. Retrieved from http://www.csun.edu/~sb4310/How%20People%20Learn.pdf. National Research Council. (2011). Successful K-12 STEM education: Identifying effective
approaches in science, technology, engineering, and mathematics. Washington: National Academies Press.
Nusair, K., & Hua, N. (2010). Comparative assessment of structural equation modeling and multiple regression research methodologies: E-commerce context. Tourism Management, 31, 314-324. doi:10.1016/j.tourman.2009.03.010.
OECD. (2015). PISA results in focus. Retrieved from https://www.oecd.org/pisa/pisa-2015 -results-in-focus.pdf
OECD. (2017a). Education at a Glance: OECD indicators. Retrieved from http://www.oecd.org/ education/skills-beyond-school/EAG2017CN-Turkey-Turkish.pdf
OECD. (2017b) Education at a Glance: Where will tomorrow’s science professionals come from? Retrieved from http://www.oecd.org/edu/education-at-a-glance-19991487.htm. OECD. (2019). Education at a Glance: OECD indicators. Retrieved from https://www.oecd.org/
education/education-at-a-glance/
Özgür, H. (2016). Adapting the media and technology usage and attitudes scale to Turkish. Educational Sciences: Theory & Practice, 16, 1711–1735. doi:10.12738/estp.2016.5.0085. Peterson, B. (2017). Engaging parent in STEM education. Children’s technology and
engineering, 17-21. Retrieved from file:///C:/Users/Asus/Downloads/CTE22-1eng agingparents.pdf
Román-González, M., Pérez-González, J.-C., & Jiménez-Fernández, C. (2017). Which cognitive abilities underlie computational thinking? Criterion validity of the Computational Thinking Test. Computers in Human Behavior, 72, 678–691. doi:10.101 6/j.chb.2016.08.047.
Rosen, L. D., Whaling, K., Carrier, L. M., Cheever, N. A., & Rokkum, J. (2013). The media and technology usage and attitudes scale: An empirical investigation. Computers in Human Behavior, 29(6), 2501–2511.
Scaradozzi, D., Screpanti, L., Cesaretti, L., Mazzieri, E., Storti, M., Brandoni, M., & Longhi, A. (2016, November). Rethink Loreto: We build our smart city!” A stem education experience for introducing smart city concept with the educational robotics. Paper presented at the 9th Annual International Conference of Education, Research and Innovation, Seville, Spain.
Schermelleh-Engel, K., Moosbrugger, H., & Müller, H. (2003). Evaluating the fit of structural equation models: tests of significance and descriptive goodness-of-fit measures. Methods of Psychological Research Online, 8(2), 23-74.
Schulenberg, J. E., Vondracek, F. W., & Crouter, A. C. (1984). The influence of the family on vocational development. Journal of Marriage and the Family, 46(1), 129–143.
Simon, R. M., Wagner, A., & Killion, B. (2017). Gender and choosing a STEM major in college: Femininity, masculinity, chilly climate, and occupational values. Journal of Research in Science Teaching, 54(3), 299-323. doi:10.1002/tea.21345
Shute, V. J., Sun, C., & Asbell-Clarke, J. (2017). Demystifying computational thinking. Educational Research Review, 22, 142-158. doi:10.1016/j.edurev.2017.09.003
Tabachnick, B. G., & Fidell, L. S. (2007). Using multivariate statistics (5th ed.). Boston, MA: Pearson Education.
Tatlıdil, H., (2002). Applied Multivariate Statistical Analysis. Ankara, Akademi Matbaası. [In Turkish] Tekerek, B., & Karakaya, F. (2018). STEM education awareness of pre-service science
Turkish Statistical Institution. (2018). Information and Communication Technology (ICT) Usage in Households and by Individuals. Retrieved from http://www.turkstat.gov.tr. Van Laar, E., Van Deursen, A. J., Van Dijk, J. A., & De Haan, J. (2017). The relation
between 21st-century skills and digital skills: A systematic literature review. Computers in human behavior, 72, 577-588. doi:10.1016/j.chb.2017.03.010
Wang, M. T., & Degol, J. (2013). Motivational pathways to STEM career choices: Using expectancy–value perspective to understand individual and gender differences in STEM fields. Developmental Review, 33, 304–340. doi:10.1016/j.dr.2013.08.001
We Are Social. (2018). Digital in 2018. Retrieved from https://wearesocial.com/
Weintrop, D., Beheshti, E., Horn, M., Orton, K., Jona, K., Trouille, L., & Wilensky, U. (2016). Defining computational thinking for mathematics and science classrooms. Journal of Science Education and Technology, 25(1), 127–147. doi:10.1007/s10956- 015-9581-5.
Wing, J. (2006). Computational thinking. Communications of the ACM, 49(3), 33-35.
Wing, J. (2011). Research notebook: Computational thinking—What and why? The Link Magazine, Spring. Carnegie Mellon University, Pittsburgh. Retrieved from https://www.cs.cmu.edu/link/research-notebook-computational-thinking-what-and-why Wing, J. (2014, January). Computational thinking benefits society. 40th Anniversary Blog of
Social Issues in Computing, New York, NY.
Wladis, C., Hachey, A. C., & Conway, K. (2014). An investigation of course-level factors as predictors of online STEM course outcomes. Computers & Education, 77, 145-150. doi:10.1016/j.compedu.2014.04.015
Wu Y. T., & Anderson, O. (2015). Technology-enhanced STEM (Science, Technology, Engineering, and Mathematics) education. Journal of Computer Education, 2(3), 245-249. doi:10.1007/s40692-015-0041-2
Xu, Y. J. (2008). Gender disparity in STEM disciplines: A study of faculty attrition and turnover intentions. Research in Higher Education, 49(7), 607-624. doi:10.1007/s11162-0 08-9097-4
Young, S. P. (2018). How to equip students to be problem solvers through STEAM? Journal of Social Science Education Research Report, 32(8), 3–6.
Young, R. A., & Friesen, J. D. (1992). The intentions of parents in influencing the career development of their children. Career Development Quarterly, 40, 198–207. doi:10.1002/j.21 61-0045.1992.tb00326.x
Yusoff, A. S. M. (2019). A Study on awareness among students, teachers, school administrators and parents on the importance of STEM. Proceedings of the 2nd International Conference on Science, Technology, Engineering and Mathematics Education, October 2018, Malaysia.