Clinical research
Corresponding author: Dr. Mücahid Yılmaz Department of Cardiology Elazığ Education and Research Hospital Elazığ, Turkey
Phone: +90 5337719783 E-mail: mucahid.yilmaz@ hotmail.com
1 Department of Cardiology, Elazığ Education and Research Hospital, Elazığ, Turkey 2 Department of Cardiology, Elazığ Medical Park Hospital (Affiliated with Istinye
University), Elazığ, Turkey
3 Department of Internal Medicine, Fırat University School of Medicine, Elazığ, Turkey 4 Department of Cardiology, Malatya Education and Research Hospital, Malatya, Turkey 5 Department of Microbiology, Elazığ Education and Research Hospital, Elazığ, Turkey 6 Department of Cardiology, Dr. Ersin Arslan Education and Research Hospital,
Gaziantep, Turkey
Submitted: 7 September 2019 Accepted: 10 April 2020
Arch Med Sci Atheroscler Dis 2020; 5: e127–e139 DOI: https://doi.org/10.5114/aoms.2020.96147 Copyright © 2020 Termedia & Banach
Is there a relationship between epicardial fat tissue
thickness and Tp-Te/QT ratio in healthy individuals?
Mücahid Yılmaz1, Hidayet Kayançiçek2, Nevzat Gözel3, Ertuğrul Kurtoğlu4, Özlem Seçen1,
Pınar Öner5, Yusuf Çekici6, Mehmet Nail Bilen1, Suat Demirkıran2, Ökkeş Uku1
A b s t r a c t
Introduction: Epicardial fat is a tissue that releases many proinflammato-ry and atherogenic mediators, with endocrine and paracrine effects on the heart. In this study, the implication of the EFT thickness (EFTt) on transmural dispersion of repolarisation (TDR) was analysed utilizing the T-wave peak to end interval (Tp-Te), the Tp-Te dispersion (Tp-Te (d)), and the Tp-Te/QT ratio. Material and methods: One thousand seven hundred and thirteen subjects were enrolled in the research. The subjects were chosen to be healthy in-dividuals, without any cardiovascular/systemic disorders or risk factors for atherosclerosis. Transthoracic echocardiography (TTE) was applied to all subjects, and EFTt was measured in both diastole and systole. The ECG mea-surements were taken from standard 12-lead surface ECG.
Results: Correlation analysis revealed that the EFTt is highly associated with the Tp-Te interval, Tp-Te/QT ratio, Tp-Te (d), increasing age, body mass index (BMI), body surface area (BSA), left ventricular (LV) mass, LV mass index, plasma glucose during fasting, triglycerides, and low-density lipoprotein cholesterol.
Conclusions: The study results showed that increased EFTt was associated with increased TDR values of Tp-Te, Tp-Te (d), and Tp-Te/QT ratio, even in the absence of other factors that could increase TDR and EFTt. Therefore, it can be stated that increased EFTt may cause an increase the risk for ven-tricular arrhythmia.
Key words: fat tissue of epicardium, repolarisation inhomogeneity of ventricle, predisposition to ventricular arrhythmia.
Introduction
Epicardial fat tissue (EFT) resides between the visceral pericardium and myocardium, which is a unique fat compartment that shares a similar em-bryological origin with the visceral fat depot. The EFT is known to have many important cardiac effects and roles. Namely, the complex physiopa-thology of coronary atherosclerosis corporates with the local cardiac ef-fects of the EFT [1]. EFT is an organ that excretes many proinflammatory
and atherogenic mediator factors with endocrine and paracrine effects on the heart. These media-tors may cause cardiovascular disease, leading to a change in the metabolism of arterial endothelial/ smooth muscle cells and heart cells [2].
In recent studies, it was stated that the Tp-Te interval was an indicator of the transmural disper-sion of repolarisation (TDR) (apicobasal, transmu-ral, and global). The interval value of the Tp-Te can be identified as the distance between the highest value (T peak) and the endpoint (T end) of the T wave, which is derived from ECG [3, 4]. However, there is need to identify whether it is effected by body weight and heart variation issues [5]. Re-cently it has been claimed that the Tp-Te/QT ratio is not altered by fluctuations of the heart rate and that it is more reliable in demonstrating predispo-sition to ventricular arrhythmia than other known calculations [5, 6].
EFT mainly covers all coronary vessels. Also it surrounds the outer wall of the right ventricle and the left ventricular apex; hence, the EFT is known to have an influential effect on human cardiac conduction [7, 8]. The possible relation between EFT thickness (EFTt) and ventricular TDR was an-alysed. The interval of Tp-Te, dispersion of Tp-Te Tp-Te (d), and the Tp-Te/QT ratio were used as simple, noninvasive indicators of ventricular repo-larisation inhomogeneity.
There is only one study with low patient partic-ipation [9]. It was carried out in the absence of the tests (such as myocardial perfusion scintigraphy and exercise stress test) excluding the existence of myocardial ischaemia. As is known that in myo-cardial ischaemia the risks associated with athero-sclerosis, i.e. diabetes mellitus (DM), hypertension (HT), and smoking, in addition to structural heart diseases, give rise to an increase in ventricular repo-larisation parameters (TDR) and the heterogeneity of ventricular repolarisation. When viewed from the aforementioned aspect, there currently has been no study that analysed the link between EFTt and ven-tricular repolarisation parameters directly. We aimed to investigate whether there is a direct connection between EFTt and potential ventricular arrhythmia predisposition with broad patient participation.
Material and methods Population of the study
A total of 1713 consecutive subjects (893 fe-male and 820 fe-male), who applied to Elazig Educa-tion and Research Hospital cardiology outpatient clinics and met the inclusion criteria between De-cember 2016 and June 2018, were included in the study (Figure 1). The ages of the subjects varied between 17 and 75 years, and they had neither any cardiovascular/systemic disorders nor risk
fac-tors for atherosclerosis (except hyperlipidaemia), detected by transthoracic echocardiography (TTE), myocardial perfusion scintigraphy, or exercise stress test. The study was carried out in conformity with the principles of the Helsinki declaration, and ethical approval was taken from the Presidency of T.C. Firat University Ethics Committee.
Exclusion criteria were electrolyte imbalance, usage of drugs that might influence the QT interval (including diltiazem, propafenone, β-blockers, ver-apamil, amiodarone, probucol, terfenadine, eryth-romycin, claritheryth-romycin, anti-depressant agent, anti-psychotic agent), pregnancy, and being a pro-fessional athlete. In addition, participants who had right or left bundle-branch block determined in 12-lead surface ECG and participants who had miss-ing data were not included in the analysis. Lastly, participants who met the criteria for the inclusion were selected consecutively to avoid selection bias.
The physical examinations and laboratory anal-ysis were conducted to record fasting blood glu-cose and lipid levels, blood pressure, body mass index (BMI), and body surface area (BSA) param-eters. Patients who were taking antihypertensive drugs were not included in the analysis. Also, blood pressure measurements were taken to iden-tify hypertensive patients (i.e., according to blood pressure records, subjects with diastolic blood pressure ≥ 90 mm Hg and systolic blood pressure higher than ≥ 140 mm Hg were not accepted to be subjects of the study).
To prove that a subject was diabetic, usage of antidiabetic medications or a measurement of fasting blood glucose level ≥ 126 mg/dl was re-quired, and these subjects were not included in analysis.
BMI and BSA were evaluated according the fol-lowing formulas:
BMI: (weight (kg))/height2 (m2)
and BSA (Mosteller formula): √((height) (cm) × weight (kg)/3600)
Electrocardiographic measurements
By tuning the voltage value to 10 mm/mV and the paper speed to 50 mm/s, broadly used ECG equipment (CardiofaxV model 9320, Nihon Kohden, Tokyo, Japan) was utilised to record the 12-lead ECG. After scanning the whole of the ECG recording, the intervals of the Tp-Te, QT, and RR were evaluated. The evaluations were done with the help of a computer program coded in
MATLAB® (MathWorks, Natick, Massachusetts,
U.S.A.) that written by an engineer. These codes were based on image manipulation principles.
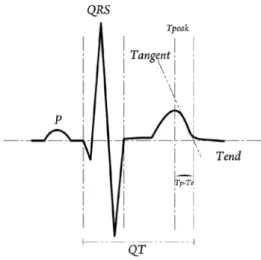
The QT interval was determined by intersecting the start value of the QRS with the final value of the T wave. This interval was identified by taking
into account the T wave and the isoelectric line. The interception of the tangent (designed from the downward part of the T wave) and isoelectric line yielded the QT interval [10]. Such measurements were taken from V1-V6 derivations. The QTmax
val-ues were recorded by determining the maximum values, and the QTc was calculated by Bazett’s for-mula (Figure 2) [11]. The interval starting from the highest point of the T wave and ending at the end point of the T wave was defined as Tp-Te (Figure 3). Figure 1. Subject inclusion flowchart diagram
125,217 patients, 52.8% of whom were females, were evaluated prospectively
No systemic disease was detected in 7388 males based on the anamnesis, physical examination, electrocardiographic and echocardiographic findings
No systemic disease was detected in 9914 females based on the anamnesis, physical examination, electrocardiographic and ecocardiographic findings
198 professional male athletes were excluded from the study
28 professional female athletes and 242 pregnant women were excluded from the study
Exercise stress test was applied to 1412 males and 68 of them couldn’t to complete the test
Exercise stress test was applied to 1852 females and 191 of them couldn’t complete the test
Exercise stress test results of 26 males were considered positive and these males were excluded from the study
The exercise stress test results of 33 females were considered positive and these females were excluded
from the study
The myocardial perfusion test results of 3 males were considered positive and these males were excluded from
the study
The myocardial perfusion scintigraphy test results of 5 females were considered positive and these females
were excluded from the study
531 males didn’t agree to take blood tests or we couldn’t reach the laboratory results of these males
822 females did not agree to take blood tests or we could not reach the laboratory results of these females
820 males without any health problems were included in the study
893 females without any health problems were included in the study
In order to rule out ischemic heart disease, it was decided to apply exercise stress test at the first stage.
Exercise stress test was planned for 1824 males according to their complaints and 412 males were excluded from the study for refusing the exercise stress
test or for not coming to their appointments
In order to rule out ischemic heart disease, it was decided to apply exercise stress test at the first stage. Exercise stress test was planned for 2374 females according to their complaints and 522 women were excluded from the study for refusing the exercise stress test or for not
coming to their appointments
Myocardial perfusion scintigraphy test was recommended for patients who were unable to complete exercise stress test for subjective reasons such as shortness of breath,
chestpain, but whose electrocardiography was still normal. Therefore, myocardial perfusion scintigraphy was
recommended to 68 males and 32 males were excluded from the study for refusing the myocardial perfusion scintigraphy test or for not coming to their appointments
Myocardial perfusion scintigraphy test was recommended for patients who were unable to complete exercise stress test for subjective reasons such as shortness of breath, chest pain, but whose electrocardiography was still normal. Therefore, myocardial perfusion scintigraphy was recommended
to 191 females and 99 females were excluded from the study for refusing the myocardial perfusion scintigraphy or for not coming to their appointments
The final point of the T wave was identified as the point of interception of the tangent line and the isoelectric line (when an U wave was not subse-quent to the T wave or if the T wave was not dis-tinct from the sequent U wave). When the T wave was followed by an U wave, the lowest point be-tween the T and U waves was determined as the final point of the T wave (Figure 1) [10]. The T peak was identified as the nadir of the T wave when negative or biphasic T waves were present (Fig- ure 4) [12]. If a notched T wave was present, the final point of the QT distance was identified by utilising the tangent line drawn from the down-ward part of the second notch (Figure 5) [10].
During the calculations, only the T wave ampli-tudes greater than 1.5 mm were included in the measurements. Otherwise they were neglected. All of the precordial derivations were utilised for the Tp-Te interval measurements. The largest val-ues were accepted as the Te interval. The Tp-Te (d) values were determined by subtracting the values corresponding to the maxima and minima
of the Tp-Te intervals, which resided from V1 to V6 derivations. The value of the Tp-Te/QT ratio was estimated utilising Tp-Te and QTmax values.
Echocardiography
In order to perform the transthoracic echocar-diography, a Vivid 5 instrument with a 2.5 MHz transducer (GE Medical Systems, Milwaukee, WI, USA) was applied. American Society of Echocar-diography recommendations were followed [13]. Interventricular septum thickness, (IVS), posterior wall thickness (PW), and systolic and diastolic di-ameters of the left ventricle (LV) were measured with M-mode echocardiography. The ejection frac-Figure 2. Bazett formula and Tp-Te/QT ratio
Figure 3. Schematic presentation of the measure-ment of the Tp-Te and QT interval
Figure 4. Schematic presentation of the measure-ment of the Tp-Te interval in the presence of
tion of the left ventricle was measured with the help of the Teichholz method [13]. The measure-ments of EFTt were carried out by a procedure suggested by Iacobellis et al. [14]. In accordance with the aforementioned procedure, the mea-surements were taken on the outer wall of the right ventricle. The EFT was discriminated by de-termining the echo-free space between the peri-cardium visceral lamina and external wall of the myocardium (Figure 6). Evaluations on M-mode strips were gathered from longitudinal cursor beam orientation in three cardiac cycles at the end-systole and end-diastole. At any side of the figures, the maximum values were measured and the derived values were averaged. The method that was utilised to determine the LV mass is Deveureux’s formula [15]. The formula is shown below: LV mass [g] = 0.8 × (1.04 × (((LVEDD + IVSd + PWd)3 – LVEDD3))) + 0.6, where LVEDD is
LV end-diastolic diameter.
LV mass index (g/m2) was computed with help
of the following formula [15]: LV mass index [g/m2]
= left ventricular mass/BSA.
Respectively, LV end-diastolic volume (LVEDV) and LV end-systolic volume (LVESV) values were computed as follows [16]: LVEDV [ml] = (7/2.4 + LVEDD) × LVEDD3, LVESV [ml] = (7/2.4 + LVESD) ×
LVESD3.
LVEDV index (LVEDVI) was computed with help the of the following formula [15]: LVEDVI [ml/m2]
= LVEDV/BSA.
EF (LV ejection fraction) and FS (fractional shortening) were evaluated with the help of the following formulas, respectively [16]: EF (%) = ((LVEDV – LVESV)/LVEDV) × 100, FS (%) = ((LVEDD – LVESD)/LVEDD) × 100.
Exercise stress test
In order to conduct the stress test, a Cardiosis TEPA Exercise Stress Test device (TEPA Medical
and Electronic Products Industry and Trade Com-pany, Ankara, Turkey) was utilised. Specifically, the tests were done according to the Bruce or modi-fied Bruce treadmill protocols. Such protocols are known to be non-invasive for functional capacity and exercise tolerance for patients who are doubt-ed to have cardiovascular disorders [17].
Myocardial perfusion scintigraphy
Myocardial perfusion scintigraphy test was conducted utilising the treadmill according to Bruce or modified Bruce protocols. Sestamibi (MIBI) tagged by 10 mCi 99 mTc (Cardio-Spect, Medi-Radiopharma, Budapest, Hungary) were applied intravenously (IV) into the subjects when the maximum HR (85–100%) was reached. After 30 min, the gated SPECT (single-photon emission computed tomography) imaging was taken. Imag-ing was carried out usImag-ing a GE Infinia GP3 gamma monitor system (General Electric Healthcare, Tirat Carmel, Israel) with a low-energy, high-resolution (LEHR) collimator. Images were evaluated using Emory Cardiac Toolbox (ECTb) myocardial quan-tification software (General Electric Healthcare Company).
Statistical analysis
The statistical evaluations of the results of this study was done with the help of the SPSS 16.0 (SPSS Inc., Chicago, IL, USA) analysis program for Windows. With the exception of the Tp-Te/QTc ra-tio and BSA (m2), all of the continuous values did
not fit to the normal distribution, and the Kolm-ogorov-Smirnov test was used to evaluate these variables. Descriptive statistics test was used to evaluate the Tp-Te/QTc ratio and BSA (m2). These
values are shown as means with standard devi-ations. All other data were presented as medi-ans with 25th–75th percentiles. Student’s t-test
and Mann-Whitney U test were used to compare groups for continuous variables. Bonferroni correc-tion was used for one-way ANOVA test to com-pare subgroups (BMI < 25 kg/m2, 25 kg/m2 < BMI
< 30 kg/m2, 30 kg/m2 < BMI). Degrees of
associa-tion between continuous variables were analysed by Pearson’s correlation analysis. Multivariate lin-ear regression analysis was performed to deter-mine which clinical variables were independently related to the Tp-Te interval and Tp-Te/QT ratio. The Tp-Te interval and Tp-Te/QT ratio were used in the model as dependent variables. EFTts, EFTtd, BMI (kg/m2), BSA (m2, LV mass (g), LV mass index
(g/m2), LVEDV (ml), LVEDV index (ml/m2), age,
fasting plasma glucose (mg/dl), LDL-C (mg/dl), triglycerides (mg/dl), and HDL-C (mg/dl) were treated as independent variables. Results were presented as β coefficients and 95% confidence Figure 6. Measurement of epicardial fat tissue
thickness (EFTt) by two-dimensional transthoracic echocardiography
Ao – aorta, LA – left atrium, RV – right ventricle, LV – left ventricle.
intervals (CI). P < 0.05 was required for statistical significance.
Results
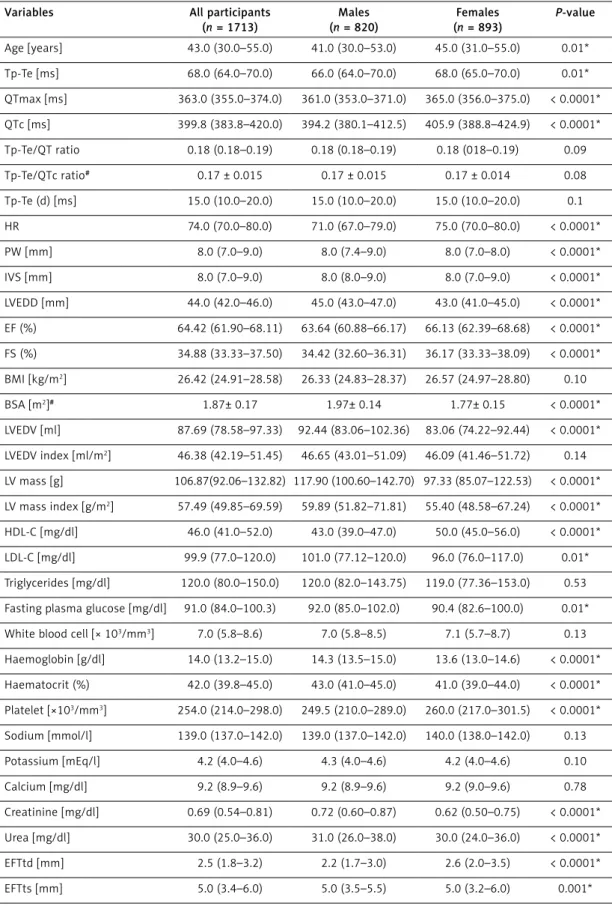
In this study, there were 1713 (820 males) healthy subjects, 1048 of whom were over-weight (25 kg/m2 < BMI < 30 kg/m2) and 215
were obese (30 < BMI kg/m2). The median ages
of all the study participants, males and females, were 43.0 (30.0–55.0), 41.0 (30.0–53.0), and 45.0 (31.0–55.0) years, respectively. The median Tp-Te interval, Tp-Te/QT ratio, and Tp-Te(d) were 68.0 (64.0–70.0) ms, 0.18 (0.18–0.19), and 15.0 (10.0– 20.0) ms, and the mean TP-Te/QTc ratio was 0.17 ±0.015, respectively. When analysing the same electrocardiographic parameters with respect to BMI (BMI < 25 kg/m2, 25 kg/m2 < BMI < 30 kg/m2,
30 kg/m2 < BMI) the median Tp-Te interval was
63.0 (60.0–66.0) ms, 68.0 (66.0–70.0), and 72.0 (68.0–75.0) ms, respectively; the Tp-Te/QT ratio was 0.18 (0.17–0.18), 0.18 (0.18–0.19), and 0.19 (0.18–0.20), respectively; the Tp-Te(d) was 10.0 (10.0–15.0) ms, 16.0 (10.0–20.0), and 20.0 (12.0– 25.0), respectively; and the mean TP-Te/QTc ratio was 0.16 ±0.014, 0.17 ±0.014, and 0.17 ±0.015, respectively. Echocardiographic measurements, baseline clinical characteristics of the study partic-ipants, and findings for ventricular repolarisation parameters are summarised below (Tables I, II).
The median EFTtd (measured in diastole) was 2.5 (1.8–3.2) mm and median EFTts (measured in systole) was 5.0 (3.4–6.0) mm (Table I). Pearson’s correlation analyses showed that EFTtd and EFTts were meaningfully related to: age of the subjects, plasma glucose of fasting, high density tein-cholesterol (HDL-C), low-density lipopro-tein-cholesterol (LDL-C), triglycerides, Tp-Te, TP-Te/QT ratio, TP-TP-Te/QTc ratio, Tp-Te(d), BMI, BSA, LVEDV, LVEDV index, LV mass, and LV mass index (Table III, Figure 7).
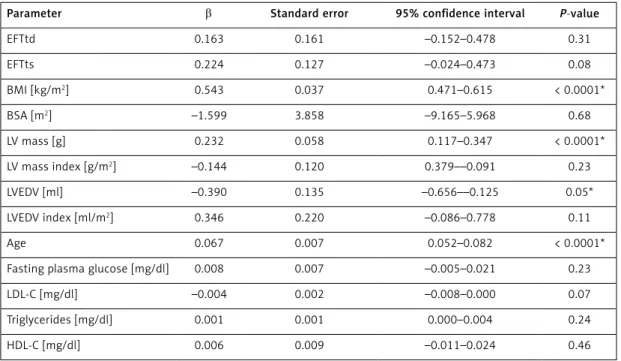
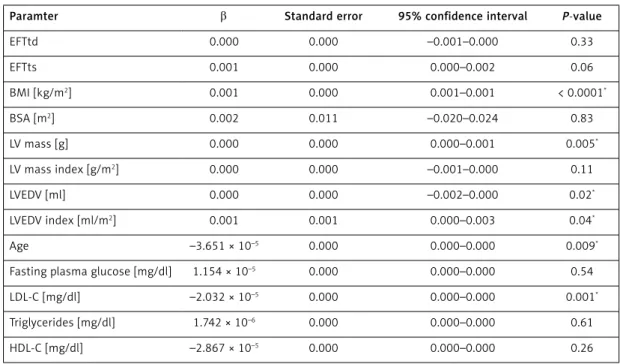
Multivariate linear regression analysis results showed that Tp-Te interval and Tp-Te/QT ratio was independently related to age, BMI (kg/m2),
LV mass (g), LVEDV (ml), LVEDV index (ml/m2), and
LDL-C. An independent relationship between EFTd and EFTs and Tp-Te and Tp-Te / QT ratio could not be detected (Tables IV, V).
Discussion
We analysed the relational association be-tween TDR indexes (Te interval, Te(d), Tp-Te/QT ratio) and EFTt with the study conducted. The outcomes of the research revealed that there was a significant relationship between the afore-mentioned parameters. In addition, it was also ob-served that EFTt had a significant association with age, BMI, and hyperlipidaemia (Table III). On the
other hand, an independent relationship between TDR and EFTt was not determined in the multivar-iate linear regression analysis (Tables IV, V).
Epicardial fat is a kind of visceral fat that de-posits in the heart. EFT is situated between the visceral segment of pericardium and the myocar-dium. It is known to be highly active, with a fatty acid metabolism, and it bears highly expressed thermogenic genes [8].The functional complexi-ty of human epicardial fat is not fully elucidated. However, the role of epicardial fat in the heart can generally be identified as mechanical, metabolic, thermogenic, and endocrine/paracrine [18].
The EFT is very close to the myocardium, which means it plays a vital role. Anatomically, there is no border between the myocardium and the EFT, and because of this anatomical phenomenon the myocardium is effected by some metabolites that are released from the EFT. Specifically, some of the metabolites can be named as the adipokines and cytokines [19, 20]. Recent studies suggest that the cytokines that are released from the EFT has a sig-nificant effect on some cardiovascular disease de-velopment [21–24].
EFT is located in the interventricular and atrio-ventricular grooves that cover the atria, the main branches of coronary arteries, the outer wall of the right ventricle, and the apex of the left ventri-cle [8]. The increase in the size of the epicardial fat causes the coronary arteries and myocardium to be surrounded by fat. It is also a known fact that the fat can get into the connective tissue out-set-ting the subepicardial connective tissue, which stands in the muscle bundles and muscle fibres [19]. Furthermore, when extreme obesity exists, the heart may become completely covered with fat that can be as thick as 20 mm [25].
Today, EFT has attracted the interest of many researchers owing to its anatomical and functional characteristics, which mainly stem from its close-ness to the myocardium. Many research studies have been conducted to illuminate its role as an endocrine organ. In addition, several studies have been carried out to reveal the role of EFT in the oc-currence of pathogenic conditions. Specifically, in some studies, the lipid-storing depot characteris-tics of the EFT have been investigated, which main-ly aimed to explain the secretion of cytokines and chemokines under pathogenic conditions as an inflammatory tissue [19]. Strong evidence shows that epicardial fat actively excretes many pro-in-flammatory cytokines, such as tumour necrosis factor-α (TNF-α), transforming growth factor-β (TGF-β), interleukin-6 (IL-6), interleukin β (IL-1β), monocyte chemoattractant protein-1 (MCP-1) (a chemokine), and IL-6 sR (interleukin 6 soluble receptor) [26]. It is stated in many studies that elevated epicardial fat tissue mass is observed in
Table I. Clinical characteristics of the study population
Variables All participants
(n = 1713) Males (n = 820) Females (n = 893) P-value Age [years] 43.0 (30.0–55.0) 41.0 (30.0–53.0) 45.0 (31.0–55.0) 0.01* Tp-Te [ms] 68.0 (64.0–70.0) 66.0 (64.0–70.0) 68.0 (65.0–70.0) 0.01* QTmax [ms] 363.0 (355.0–374.0) 361.0 (353.0–371.0) 365.0 (356.0–375.0) < 0.0001* QTc [ms] 399.8 (383.8–420.0) 394.2 (380.1–412.5) 405.9 (388.8–424.9) < 0.0001* Tp-Te/QT ratio 0.18 (0.18–0.19) 0.18 (0.18–0.19) 0.18 (018–0.19) 0.09 Tp-Te/QTc ratio# 0.17 ± 0.015 0.17 ± 0.015 0.17 ± 0.014 0.08 Tp-Te (d) [ms] 15.0 (10.0–20.0) 15.0 (10.0–20.0) 15.0 (10.0–20.0) 0.1 HR 74.0 (70.0–80.0) 71.0 (67.0–79.0) 75.0 (70.0–80.0) < 0.0001* PW [mm] 8.0 (7.0–9.0) 8.0 (7.4–9.0) 8.0 (7.0–8.0) < 0.0001* IVS [mm] 8.0 (7.0–9.0) 8.0 (8.0–9.0) 8.0 (7.0–9.0) < 0.0001* LVEDD [mm] 44.0 (42.0–46.0) 45.0 (43.0–47.0) 43.0 (41.0–45.0) < 0.0001* EF (%) 64.42 (61.90–68.11) 63.64 (60.88–66.17) 66.13 (62.39–68.68) < 0.0001* FS (%) 34.88 (33.33–37.50) 34.42 (32.60–36.31) 36.17 (33.33–38.09) < 0.0001* BMI [kg/m2] 26.42 (24.91–28.58) 26.33 (24.83–28.37) 26.57 (24.97–28.80) 0.10 BSA [m2]# 1.87± 0.17 1.97± 0.14 1.77± 0.15 < 0.0001* LVEDV [ml] 87.69 (78.58–97.33) 92.44 (83.06–102.36) 83.06 (74.22–92.44) < 0.0001* LVEDV index [ml/m2] 46.38 (42.19–51.45) 46.65 (43.01–51.09) 46.09 (41.46–51.72) 0.14 LV mass [g] 106.87(92.06–132.82) 117.90 (100.60–142.70) 97.33 (85.07–122.53) < 0.0001* LV mass index [g/m2] 57.49 (49.85–69.59) 59.89 (51.82–71.81) 55.40 (48.58–67.24) < 0.0001* HDL-C [mg/dl] 46.0 (41.0–52.0) 43.0 (39.0–47.0) 50.0 (45.0–56.0) < 0.0001* LDL-C [mg/dl] 99.9 (77.0–120.0) 101.0 (77.12–120.0) 96.0 (76.0–117.0) 0.01* Triglycerides [mg/dl] 120.0 (80.0–150.0) 120.0 (82.0–143.75) 119.0 (77.36–153.0) 0.53
Fasting plasma glucose [mg/dl] 91.0 (84.0–100.3) 92.0 (85.0–102.0) 90.4 (82.6–100.0) 0.01*
White blood cell [× 103/mm3] 7.0 (5.8–8.6) 7.0 (5.8–8.5) 7.1 (5.7–8.7) 0.13
Haemoglobin [g/dl] 14.0 (13.2–15.0) 14.3 (13.5–15.0) 13.6 (13.0–14.6) < 0.0001* Haematocrit (%) 42.0 (39.8–45.0) 43.0 (41.0–45.0) 41.0 (39.0–44.0) < 0.0001* Platelet [×103/mm3] 254.0 (214.0–298.0) 249.5 (210.0–289.0) 260.0 (217.0–301.5) < 0.0001* Sodium [mmol/l] 139.0 (137.0–142.0) 139.0 (137.0–142.0) 140.0 (138.0–142.0) 0.13 Potassium [mEq/l] 4.2 (4.0–4.6) 4.3 (4.0–4.6) 4.2 (4.0–4.6) 0.10 Calcium [mg/dl] 9.2 (8.9–9.6) 9.2 (8.9–9.6) 9.2 (9.0–9.6) 0.78 Creatinine [mg/dl] 0.69 (0.54–0.81) 0.72 (0.60–0.87) 0.62 (0.50–0.75) < 0.0001* Urea [mg/dl] 30.0 (25.0–36.0) 31.0 (26.0–38.0) 30.0 (24.0–36.0) < 0.0001* EFTtd [mm] 2.5 (1.8–3.2) 2.2 (1.7–3.0) 2.6 (2.0–3.5) < 0.0001* EFTts [mm] 5.0 (3.4–6.0) 5.0 (3.5–5.5) 5.0 (3.2–6.0) 0.001*
BMI – body mass index, BSA – body surface area, EF – ejection fraction, HR – heart rate, LV – left ventricle, LVEDD – left ventricular end-diastolic diameter, LVESD – left ventricular end-systolic diameter, PW – posterior wall, IVS – interventricular septum, LVEDV – left ventricular end-diastolic volume, HDL-C – high-density lipoprotein-cholesterol, LDL-C – low-density lipoprotein-cholesterol, EFTtd – epicardial fat tissue thickness in diastole, EFTts – epicardial fat tissue thickness in systole, ms – milliseconds, mm – millimetres. #All other
continuous values except Tp-Te/QTc ratio and BSA (m2) did not have normal distribution, and the Kolmogorov-Smirnov test was used to
Table II. Some clinical characteristics of the study population in terms of BMI Parameter BMI < 25 kg/m2 (n = 450) 25 kg/m2 < BMI < 30 kg/m2 (n = 1048) 30 kg/m2 < BMI (n = 215) P-value Age [years] 30.0 (21.0–45.0) 46.0 (33.0–56.0) 48.0 (35.0–58.0) < 0.0001, 0.55x Tp-Te [msn] 63.0 (60.0–66.0) 68.0 (66.0–70.0) 72.0 (68.0–75.0) < 0.0001 QTmax [ms] 356.0 (345.0–365.0) 365.0 (358.0–375.0) 375.0 (366.0–382.0) < 0.0001 QTc [ms] 394.5 (378.8–415.3) 399.8 (384.5–419.2) 413.6 (394.3–435.6) < 0.0001 Tp-Te/QT ratio 0.18 (0.17–0.18) 0.18 (0.18–0.19) 0.19 (0.18–0.20) < 0.0001 Tp-Te/QTc ratio# 0.16 ±0.014 0.17 ±0.014 0.17 ±0.015 < 0.0001, 0.001x Tp-Te(d) [ms] 10.0 (10.0–15.0) 16.0 (10.0–20.0) 20.0 (12.0–25.0) < 0.0001 EFTtd [mm] 1.5 (1.0–2.2) 2.6 (2.0–3.2) 3.5 (3.0–4.5) < 0.0001 EFTts [mm] 3.4 (3.0–5.0) 5.0 (4.0–6.0) 6.1 (5.2–7.0) < 0.0001 BMI [kg/m2] 23.18 (21.77–24.33) 26.87 (26.02–28.13) 32.40 (31.02–34.89) < 0.0001 BSA [m2]# 1.74 ±0.15 1.88 ±0.14 2.06 ±0.18 < 0.0001 LVEDV [ml] 78.58 (70.0–87.69) 92.44 (78.58–97.33) 92.44 (83.06–107.52) < 0.0001 LVEDV index [ml/m2] 44.72 (41.42–49.08) 47.30 (43.18–52.35) 45.72 (40.90–51.30) < 0.0001, 0.11*, 0.32x LV mass [g] 93.04 (81.68–105.07) 113.88 (96.78–137.72) 123.29 (101.29–158.82) < 0.0001 LV mass index [g/m2] 52.24 (47.62–59.38) 60.42 (51.45–71.91) 60.36 (50.47–73.88) < 0.0001, 1.0x
#All other continuous values except Tp-Te/QTc ratio and BSA (m2) did not have normal distribution, and the Kolmogorov-Smirnov test was
used to evaluate these variables. P < 0.05 were accepted as statistically significant. *P-value between BMI < 25 kg/m2 group and 30 kg/m2
< BMI group. XP-value between 25 kg/m2 < BMI < 30 kg/m2 group and 30 kg/m2 < BMI group.
Table III. Pearson’s correlation analysis between EFTt and baseline characteristics, echocardiography, and some laboratory measurements
Parameter EFTtd EFTts
r P-value r P-value
Age 0.580 < 0.0001 0.581 < 0.0001
Fasting plasma glucose [mg/dl] 0.127 < 0.0001 0.134 < 0.0001
LDL-C [mg/dl] 0.135 < 0.0001 0.135 < 0.0001 Triglycerides [mg/dl] 0.330 < 0.0001 0.309 < 0.0001 HDL-C [mg/dl] –0.142 < 0.0001 –0.170 < 0.0001 Tp-Te [msn] 0.564 < 0.0001 0.566 < 0.0001 Tp-Te/QT ratio 0.377 < 0.0001 0.390 < 0.0001 Tp-Te (d) [msn] 0.496 < 0.0001 0.492 < 0.0001 BMI [kg/m2] 0.500 < 0.0001 0.518 < 0.0001 BSA [m2] 0.213 < 0.0001 0.243 < 0.0001 LV mass [g] 0.473 < 0.0001 0.469 < 0.0001 LV mass index [g/m2] 0.452 < 0.0001 0.439 < 0.0001 LVEDV [ml] 0.434 < 0.0001 0.423 < 0.0001 LVEDV index [ml/m2] 0.381 < 0.0001 0.354 < 0.0001
LDL-C – low-density lipoprotein-cholesterol, HDL-C – high-density lipoprotein-cholesterol, BMI – body mass index, BSA – body surface area, LV mass – left ventricle mass.
patients with paroxysmal atrial fibrillation in com-parison to the controls, and even higher epicardial fat mass is detected in patients with permanent
AF when compared to patients with paroxysmal atrial fibrillation [27, 28]. Another study proved that the inflammatory markers are more
eminent-Tp-T e Tp-T e(d) Tp-T e/QT ratio 90 80 70 60 50 50 40 30 20 10 0 0.225 0.200 0.175 0.150 0.125 p < 0.0001, r = 0.564 p < 0.0001, r = 0.496 p < 0.0001, r = 0.377 0 2 4 6 8 10 EFTtd [mm] 0 2 4 6 8 10 EFTtd [mm] 0 2 4 6 8 10 EFTtd [mm]
Figure 7. The correlations between Tp-Te interval, Tp-Te/QT ratio, Tp-Te interval dispersion Tp-Te(d), and EFTt in diastole (EFTtd)
Table IV. Multivariate linear regression analysis results for Tp-Te
Parameter β Standard error 95% confidence interval P-value
EFTtd 0.163 0.161 –0.152–0.478 0.31 EFTts 0.224 0.127 –0.024–0.473 0.08 BMI [kg/m2] 0.543 0.037 0.471–0.615 < 0.0001* BSA [m2] –1.599 3.858 –9.165–5.968 0.68 LV mass [g] 0.232 0.058 0.117–0.347 < 0.0001* LV mass index [g/m2] –0.144 0.120 0.379––0.091 0.23 LVEDV [ml] –0.390 0.135 –0.656––0.125 0.05* LVEDV index [ml/m2] 0.346 0.220 –0.086–0.778 0.11 Age 0.067 0.007 0.052–0.082 < 0.0001*
Fasting plasma glucose [mg/dl] 0.008 0.007 –0.005–0.021 0.23
LDL-C [mg/dl] –0.004 0.002 –0.008–0.000 0.07
Triglycerides [mg/dl] 0.001 0.001 0.000–0.004 0.24
HDL-C [mg/dl] 0.006 0.009 –0.011–0.024 0.46
Table V. Multivariate linear regression analysis results for Tp-Te/QT ratio
Paramter β Standard error 95% confidence interval P-value
EFTtd 0.000 0.000 –0.001–0.000 0.33 EFTts 0.001 0.000 0.000–0.002 0.06 BMI [kg/m2] 0.001 0.000 0.001–0.001 < 0.0001* BSA [m2] 0.002 0.011 –0.020–0.024 0.83 LV mass [g] 0.000 0.000 0.000–0.001 0.005* LV mass index [g/m2] 0.000 0.000 –0.001–0.000 0.11 LVEDV [ml] 0.000 0.000 –0.002–0.000 0.02* LVEDV index [ml/m2] 0.001 0.001 0.000–0.003 0.04* Age –3.651 × 10⁻⁵ 0.000 0.000–0.000 0.009*
Fasting plasma glucose [mg/dl] 1.154 × 10⁻⁵ 0.000 0.000–0.000 0.54
LDL-C [mg/dl] –2.032 × 10⁻⁵ 0.000 0.000–0.000 0.001*
Triglycerides [mg/dl] 1.742 × 10⁻⁶ 0.000 0.000–0.000 0.61
HDL-C [mg/dl] –2.867 × 10⁻⁵ 0.000 0.000–0.000 0.26
R2 = 0.382, p < 0.0001. *Statistically significant.
ly related to the periatrial epicardial fat volume than the thickness of the EFT. In this respect, the local influence of EFT exhibits a vital role in AF pathogenesis [29].
Detection and quantification of EFT require a variety of useful imaging techniques, including two-dimensional (2D) echocardiography, non-con-trast computed tomography (CT), and magnetic resonance imaging (MRI) [30, 31]. The EFTt can be evaluated and visualised by a two-dimensional echocardiographic method, which is noninvasive, objective, reliable, easily obtainable, and less ex-pensive than the gold standard MRI and CT. The identification of the EFTt is straightforward, in the sense that it can be easily discriminated by de-termining the echo-free space between the peri-cardial visceral segment and the myoperi-cardial out-er wall. Also, the EFTt is evaluated between the epicardial surface and the parietal pericardium in at least two locations on the right ventricular free wall [18]. Determination of the best cardiac cycle stage for taking measurements of echocardiog-raphy is a controversial issue. Some recommend that measurement should be taken during systole to prohibit potential deformation from epicardial fat compression during diastole, while others sug-gest measurement in diastole is best in order to match up with other imaging methods (CT and MRI) [30, 32, 33].
Abnormality observed in repolarisation of the ventricle has been considered as a significant in-dicator of ventricular arrhythmogenesis [34]. One way to detect such abnormalities is by marking the highest point and final point of the T wave on
ECG, which is a marker of total TDR (transmural, apicobasal, and global). When an increase is ob-served in the interval of Tp-Te, it can be concluded that the risk of ventricular tachyarrhythmia and cardiovascular mortality will increase [35–38]. Tp-Te indicates the maximum dispersion of repo-larisation. On the other hand, the variety of TDR within various zones of the ventricular myocar-dium can be detected by Tp-Te (d) [11]. Finally, focusing only on the intervals of Tp-Te or QT is generally not adequate to draw accurate conclu-sions. Instead, Tp-Te/QT ratio can be utilised to gain a more sensitive index of arrhythmogenesis, so that this ratio remains stable even if the body weight or heart rate values varies [5]. Recently, these three electrocardiographic parameters have come to be considered the most useful markers as indirect indexes of ventricular repolarisation for arrhythmic vulnerability [11, 39].
It is stated that there is a strong relation be-tween the increased fibrinogen, C-reactive protein, cholesterol levels, and physical inactivity and high BMI values [40]. In another study, it was proven that there is an association between the ventricu-lar tachyarrhythmias and prolonged QT durations. In addition, when obesity exists, an increase in QT and QTd parameters is observed [41]. In some people who are overweight or obese, even without heart disease, cardiomyocytes can demonstrate some abnormities in their electrophysiological fea-tures. These are characterised by a lengthening of the action potential [39]. Mora et al. stated that a considerable association exists between cardiac sympathetic nervous activity and repolarisation
abnormities in people who are overweight or obese [40]. On the other hand, Acar et al. stated that ven-tricular repolarisation markers derived from ECG are associated with systemic inflammation [42]. However, inflammatory biomarkers of plasma might not sufficiently represent regional tissue in-flammation. EFT is a resource of many inflamma-tory biological agents. In addition, Mazurek et al. reported that serum HDL levels and the epicardial expression of IL-6sR are inversely correlated [26].
It has been reported that, with aging, fibrosis ef-fects start to occur in myocardium, which yields an increase in ventricular repolarisation heterogeneity [43]. Another explanation for the increase in TDR with age is distortion of the balance between sym-pathetic and parasymsym-pathetic tone in favour of the sympathetic tone. In old age, this balance changes in favour of the sympathetic activity considerably [44]. High sympathetic activity can generate sev-eral changes in myocardial membrane characteris-tics, which cause to early after depolarisations and an increase in TDR [45–47]. Our study shows a rela-tionship between age, BMI, BSA, and EFTt (Table III). In other words, increased BMI, BSA, and advancing age lead to increased EFTt. Although the details of the aforementioned relation are still an unexplored issue, aging, BMI, and BSA may lead to an increase in sympathetic activity in these subjects, and this situation may contribute to the increased ventricu-lar repoventricu-larisation heterogeneity as well.
Multivariate linear regression analysis results
revealed that age, BMI (kg/ m2), LV mass (g),
LVEDV (ml), and LVEDV index (ml/m2) are
inde-pendently related to Tp-Te interval and Tp-Te/QT ratio. However, such a relationship could not be detected between EFTd and EFTs and Tp-Te and Tp-Te/QT ratio (Tables IV, V). These data reveal that age, BMI (kg/m2), LV mass (g), LVEDV (ml), and
LVEDV index (ml/m2) are independent predictors
for increased ventricular repolarisation heteroge-neity, but EFTtd and EFTts are not predictors for TDR. All these results show that EFTtd and EFTts values increase with age, BMI (kg/m2), LV mass (g),
LVEDV (ml), and LVEDV index (ml/m2) in healthy
individuals. This increase correlates positively with TDR parameters and indicates that all of the data mentioned are responsible for increased ventricu-lar repoventricu-larization heterogeneity.
In light of former research outcomes, in this study we considered that there may be a direct relationship between EFTt and dysrhythmia [26– 29, 39–42]. We hypothesised that EFT may lead to structural and electrical remodelling of the myocardium and thus may contribute to the for-mation of ventricular arrhythmias, because of its closeness to the myocardium and its feeding by the same coronary arteries.
The present study included 1713 healthy partic-ipants, 1048 of whom were overweight (25 kg/m2
< BMI < 30 kg/m2) and 215 were obese (30 kg/m2
< BMI) (Table II). All factors and diseases that could form the basis for ventricular arrhythmia were excluded, and only factors that would show the impact of EFTt on ventricular arrhythmia pre-disposition were investigated. We observed that the TDR parameters increased in direct proportion to the EFT thickness and that, at the same time, aging, BSA, BMI, LV volume, LV volume index, LV mass, LV mass index, fasting plasma glucose, tri-glycerides, and LDL had a positive correlation with the EFTt. Conversely, the HDL levels had a negative correlation with the EFTt (Table III). Inflammation can be a reasonable explanation for the positive correlation between the EFTt and TDR parameters (Tp-Te interval Tp-Te(d), Tp-Te/QT ratio, Tp-Te/QTc ratio) that were observed in this research study. In addition, the risk of ventricular repolarisation inho-mogeneity elevates in parallel with the enhanced sympathetic nervous system activity. In this study, repolarisation abnormalities were observed in old-er, overweight, and obese participants, and it can also show an incidental coexistence with the rela-tive increase in the EFTt, which occurs due to differ-ent causes in the same participants. There does not seem to be a clear-cut answer to this issue. How-ever, in light of the available findings, we can say that there is a moderate correlation between the increase in the EFTt measured echocardiographical-ly and the increase in the ventricular repolarisation heterogeneity measured electrocardiographically.
In conclusion, as of today, the details of the relationship between the ventricular arrhythmias and increased EFTt are not clearly explained. The results of the study demonstrated that the EFT may has a direct effect on the ventricular repolarisation inhomogeneity, and these results imply that an increase in EFTt may lead to an augmentation in the inhomogeneity of ventricu-lar repoventricu-larisation via myocardial electrical recon-struction.
Today, QT distance and QT dispersion are known to increase in parallel with obesity. The study included 215 obese participants, and this may have partially affected the correlation analy-ses performed between TDR parameters and EFTt.
Conflict of interest
The authors declare no conflict of interest.
R e f e r e n c e s
1. Nagy E, Jermendy AL, Merkely B, et al. Clinical impor-tance of epicardial adipose tissue. Arch Med Sci 2017; 13: 864-74.
2. Patel VB, Shah S, Verma S, et al. Epicardial adipose tis-sue as a metabolic transducer: role in heart failure and coronary artery disease. Heart Fail Rev 2017; 22: 889-902.
3. Kors JA, van Eck HJR, van Herpen G. The meaning of the Tp-Te interval and its diagnostic value. J Electrocardiol 2008; 41: 575-80.
4. Antzelevitch C, Sicouri S, Di Diego JM, et al. Does Tpeak– Tend provide an index of transmural dispersion of repo-larization? Heart Rhythm 2007; 4: 1114-6.
5. Gupta P, Patel C, Patel H, et al. Tp-e/QT ratio as an index of arrhythmogenesis. J Electrocardiol 2008; 41: 567-74. 6. Zhao X, Xie Z, Chu Y, et al. Association between Tp-e/
QT ratio and prognosis in patients undergoing prima-ry percutaneous coronaprima-ry intervention for ST-segment elevation myocardial infarction. Clin Cardiol 2012; 35: 559-64.
7. Balcıoğlu AS, Erdoğan T, Şatıroğlu Ö. The relationship between epicardial adipose tissue and P wave and QT dispersions. Turk Kardiyol Dern Ars 2015; 43: 621-9. 8. Iacobellis G, Corradi D, Sharma AM. Epicardial adipose
tissue: anatomic, biomolecular and clinical relation-ships with the heart. Nat Rev Pract Cardiovasc Med 2005; 2: 536-43.
9. Kaplan O, Kurtoglu E, Nar G, et al. Evaluation of electro-cardiographic T-peak to T-end interval in subjects with increased epicardial fat tissue thickness. Arq Brasil Car-diol 2015; 105: 566-72.
10. Burns E. ECG Basıcs: Waves, Intervals, Segments and Clinical Interpretation. [Accessed May 20, 2018]. Availa-ble from: https://lifeinthefastlane.com› ECG Library. 11. Hevia JC, Antzelevitch C, Bárzaga FT, et al. Tpeak-Tend
and Tpeak-Tend dispersion as risk factors for ventricu-lar tachycardia/ventricuventricu-lar fibrillation in patients with the Brugada syndrome. J Am Coll Cardiol 2006; 47: 1828-34.
12. Icli A, Kayrak M, Akilli H, et al. Prognostic value of Tpeak-Tend interval in patients with acute pulmonary embo-lism. BMC Cardiovasc Disord 2015; 15: 99.
13. Lang RM, Bierig M, Devereux RB, et al. Recommenda-tions for chamber quantification. Eur J Echocardiogr 2006; 7: 79-108.
14. Iacobellis G, Ribaudo MC, Assael F, et al. Echocardio-graphic epicardial adipose tissue is related to anthropo-metric and clinical parameters of metabolic syndrome: a new indicator of cardiovascular risk. J Clin Endocrinol Metab 2003; 88: 5163-8.
15. Lang RM, Bierig M, Devereux RB, et al. Recommenda-tions for chamber quantification: a report from the American Society of Echocardiography’s Guidelines and Standards Committee and the Chamber Quantification Writing Group, developed in conjunction with the Euro-pean Association of Echocardiography, a branch of the European Society of Cardiology. J Am Soc Echocardiogr 2005; 18: 1440-63.
16. Hudsmith LE, Petersen SE, Francis JM, et al. Normal hu-man left and right ventricular and left atrial dimensions using steady state free precession magnetic resonance imaging. J Cardiovasc Magn Reson 2005; 7: 775-82. 17. Bruce R, Blackmon J, Jones J, et al. Exercising testing in
adult normal subjects and cardiac patients. Ann Nonin-vasive Electrocardiol 2004; 9: 291-303.
18. Wu Y, Zhang A, Hamilton DJ, et al. Epicardial fat in the maintenance of cardiovascular health. Methodist De-Bakey Cardiovasc J 2017; 13: 20-24.
19. Cherian S, Lopaschuk GD, Carvalho E. Cellular cross-talk between epicardial adipose tissue and myocardium in relation to the pathogenesis of cardiovascular disease. Am J Physiol Endocrinol Metab 2012; 303: E937-49. 20. Patel VB, Mori J, McLean BA, et al. ACE2 deficiency
wors-ens epicardial adipose tissue inflammation and cardiac
dysfunction in response to diet-induced obesity. Diabe-tes 2016; 65: 85-95.
21. Toczyłowski K, Gruca M, Baranowski M. Epicardial adi-pose tissue and its role in cardiac physiology and dis-ease. Postepy Hig Med Dosw 2013; 67: 584-93. 22. Çetin M, Erdogan T, Kocaman SA, et al. Increased
epi-cardial adipose tissue in patients with isolated coronary artery ectasia. Int Med 2012; 51: 833-8.
23. Eroglu S., Sade L.E., Yildirir A., et al. Epicardial adipose tissue thickness by echocardiography is a marker for the presence and severity of coronary artery disease. Nutrition Metabolism Cardiovasc Dis 2009; 19: 211-7. 24. Erdogan T, Canga A, Kocaman SA, et al. Increased
epicar-dial adipose tissue in patients with slow coronary flow phenomenon. Kadiol Pol 2012; 70: 903-9.
25. Sacks HS, Fain JN. Human epicardial adipose tissue: a review. Am Heart J 2007; 153: 907-17.
26. Mazurek T, Zhang L, Zalewski A, et al. Human epicardial adipose tissue is a source of inflammatory mediators. Circulation 2003; 108: 2460-6.
27. Acet H, Ertaş F, Akıl MA, et al. New inflammatory predic-tors for non-valvular atrial fibrillation: echocardiograph-ic epechocardiograph-icardial fat thechocardiograph-ickness and neutrophil to lymphocyte ratio. Int J Cardiovasc Imaging 2014; 30: 81-9.
28. Iacobellis G, Zaki M, Garcia D, et al. Epicardial fat in atrial fibrillation and heart failure. Horm Metab Res 2014; 46: 587-90.
29. Girerd N, Scridon A, Bessière F, et al. Periatrial epicardial fat is associated with markers of endothelial dysfunc-tion in patients with atrial fibrilladysfunc-tion. PLoS One 2013; 8: e77167.
30. Nelson AJ, Worthley MI, Psaltis PJ, et al. Validation of cardiovascular magnetic resonance assessment of peri-cardial adipose tissue volume. J Cardiovasc Magn Reson 2009; 11: 15.
31. Iacobellis G, Willens HJ. Echocardiographic epicardial fat: a review of research and clinical applications. J Am Soc Echocardiogr 2009; 22: 1311-9.
32. Iacobellis G. Local and systemic effects of the multifac-eted epicardial adipose tissue depot. Nat Rev Endocrinol 2015; 11: 363-71.
33. Mookadam F, Goel R, Alharthi MS, et al. Epicardial fat and its association with cardiovascular risk: a cross-sec-tional observaa cross-sec-tional study. Heart Views 2010; 11: 103-8. 34. Salles G, Xavier S, Sousa A, et al. Prognostic value of QT
interval parameters for mortality risk stratification in Chagas’ disease: results of a long-term follow-up study. Circulation 2003; 108: 305-12.
35. Tenekecioglu E, Karaagac K, Yontar OC, et al. Evaluation of Tp-Te Interval and Tp-Te/QT ratio in patients with coronary slow flow Tp-Te/QT ratio and coronary slow flow. Eurasian J Med 2015; 47: 104-8.
36. Smetana P, Schmidt A, Zabel M, et al. Assessment of re-polarization heterogeneity for prediction of mortality in cardiovascular disease: peak to the end of the T wave interval and nondipolar repolarization components. J Electrocardiol 2011; 44: 301-8.
37. Erikssen G, Liestøl K, Gullestad L, et al. The terminal part of the QT interval (T peak to T end): a predictor of mortality after acute myocardial infarction. Ann Nonin-vasive Electrocardiol 2012; 17: 85-94.
38. Karaagac K, Tenekecioglu E, Yontar OC, et al. Effect of non-dipper and dipper blood pressure patterns on Tp-Te interval and Tp-Te/QT ratio in patients with metabolic syndrome. Int J Clin Exp Med 2014; 7: 1397-403. 39. Braschi A, Abrignani MG, Francavilla VC, et al. Novel
repolariza-tion in uncomplicated overweight and obesity. Obesity 2011; 19: 875-81.
40. Mora S, Lee IM, Buring JE, et al. Association of physical activity and body mass index with novel and traditional cardiovascular biomarkers in women. JAMA 2006; 295: 1412-9.
41. Esposito K, Nicoletti G, Marzano S, et al. Autonomic dysfunction associates with prolongation of QT inter-vals and blunted night BP in obese women with visceral obesity. J Endocrinol Invest 2002; 25: RC32-5.
42. Acar G, Yorgun H, İnci MF, et al. Evaluation of Tp-e inter-val and Tp-e/QT ratio in patients with ankylosing spon-dylitis. Modern Rheumatol 2014; 24: 327-30.
43. Reardon M, Malik M. QT interval change with age in an overtly healthy older population. Clin Cardiol 1996; 19: 949-52.
44. Pfeifer MA, Weinberg CR, Cook D, et al. Differential changes of autonomic nervous system function with age in man. Am J Med 1983; 75: 249-58.
45. Zipes DP. The long QT interval syndrome. A Rosetta stone for sympathetic related ventricular tachyarrhyth-mias. Circulation 1991; 84: 1414-9.
46. Ben-David J, Zipes DP. Differential response to right and left ansae subclaviae stimulation of early afterdepolar-izations and ventricular tachycardia induced by cesium in dogs. Circulation 1988; 78: 1241-50.
47. Vincent GM, Timothy KW, Leppert M, et al. The spec-trum of symptoms and QT intervals in carriers of the gene for the long-QT syndrome. N Engl J Med 1992; 327: 846-52.
![Table II. Some clinical characteristics of the study population in terms of BMI Parameter BMI < 25 kg/m 2 (n = 450) 25 kg/m 2 < BMI < 30 kg/m2 (n = 1048) 30 kg/m 2 < BMI (n = 215) P-value Age [years] 30.0 (21.0–45.0) 46.0 (33.0–56.0) 48.0 (3](https://thumb-eu.123doks.com/thumbv2/9libnet/4475366.78169/8.892.127.747.146.592/table-clinical-characteristics-study-population-terms-parameter-years.webp)