THE INVESTIGATION OF THERMAL DECOMPOSITION KINETICS OF POTASSIUM TETRABORATE TETRAHYDRATE BY THERMAL ANALYSIS A. Abdullah CEYHAN* Halil DEMİR** Ömer ŞAHİN** *Department of Chemical Engineering, Selcuk University, 42031, Campus, KONYA ** Department of Chemical Engineering, Siirt University, SİİRT ABSTRACT: The thermal decomposition of potassium tetraborate tetrahydrate to potassium tetraborate
were studied by using the traditional criterion of the mathematical fitting of g(α) function and model free linear isoconversional methods. The nonisothermal kinetic triplet (f(α), A and E) obtained by model fitting method for potassium tetraborate tetrahydrate can be represented by different kinetic model, but the apparent activation energy is far from each other. The complex nature of the multi‐step process of the studied compounds was more easily revealed using a wider temperature range in nonisothermal isoconversional method.
Keywords: Kinetic triplet, model fitting, model free isoconversional method, potassium tetraborate
tetrahydrate. Termal Analiz Yöntemiyle Potasyum Tetraborat Tetra Hidratın Termal Bozunma Kinetiğinin İncelenmesi
ÖZET: Potasyum tetraborat tetrahidratın potasyum tetrahidrata termal bozunması, g(α) fonksiyonuna
en uygun matematiksel modelin uygulanması ve reaksiyon modeline bağlı olmayan lineer eş dönüşümlü model kullanılarak incelenmiştir. Potasyum tetraborat tetrahidrat için model uydurma metoduyla elde edilen izotermal olmayan kinetik üçlüsü (f(α), A ve E) farklı kinetik modeller ile gösterilebilir. Bununla birlikte görünür aktivasyon enerjisi birbirinden farklı olmaktadır. Çalışılan bileşenlerin çok basamaklı proseslerinin karmaşık yapısı, geniş bir çalışma aralığında izotermal olmayan eş dönüşüm metodunun kullanılması ile ortaya konulabilir.
Anahtar Kelimeler: Kinetik üçlü, Model uydurma, modelden bağımsız izokonveksiyonel metod,
potasyum tetraborat tetrahidrat.
INTRODUCTION
More than 200 compounds of boron are available in nature under different names, like, tincal, colemanit, ulexit, kernit depending on the ratio of sodium, calcium, magnesium etc. Boron and its compounds have a wide field of application in industry[ Kirk‐Othmer et.al.]. One of the most known commercial important potassium borates is potassium tetraborate tetrahydrate (PTT) which is produced resulting from the controlled reaction of potassium hydroxide and boric acid in aqueous media according to the following stoichiometric expression,
2KOH + 4H3BO3 Æ K2B4O7.4H2O (1)
As it is known, potassium tetraborate is used in lubricating oil composition [ Kazuhiro et al. 2004], glass article [Toyoyuki et. al. 2003], disinfectant [Zhenze and Joseph 2004], treatment of contact lenses [Xial et al. 1999] and dishwashing detergent [Andrea and Guy 1994]. In addition to these, it can replace with borax where an alkali borate is needed but sodium salt can not be used. However the water content of PTT is not appropriate in some application such as the manufacture of high quality glass, frit production, ceramic and refinement of precious metals. Dehydration of hydrated boron minerals
such as boric acid [Gürbüz‐Beker et al.], borax [Sahin et al. 2005], ulexit [ Eymir and Okur 2005], colemanite [Çelik and Suner 2005] and sodium perborate tetrahydrate[ Dugua and Cuer 1987 ; Şahin and Bulutcu 1999], potassium tetraborate tetrahydrate [ Şahin et al. 2006] are very important for industrial purposes. Thus, the determination of kinetic parameters and thermal behavior of PTT are very important in industrial application. Also, we have not found any study related to determine kinetic triplet and thermal behavior of mentioned borate by non‐isothermal analysis. Thus, the main aim of this study is to determine the thermal decomposition kinetics based on model‐fitting and model free method of potassium tetraborate tetrahydrate.
Kinetic Computations
Different kinds of methods have been proposed in the literature for the calculation of the activation energy and kinetic parameters of decomposition reactions from an analysis of the termogravimetric (TG) curve.
In this study, the thermal decomposition of PTT was considered as the thermal decomposition of a solid substance. This type of solid state reaction can be formulated as,
Asolid Æ Bsolid + Cgas (2)
The rate of decomposition of this type of reaction is expressed as
)
(
).
(
α
α
f
T
k
dt
d
=
(3) It is usually assumed that the rate constant of Eq.3 can be expressed as a function of the fractional conversion under non‐isothermal condition in the following form [Piloyan and Ryabchikov 1966]. ) ( ). exp(α
α
f RT E A dt d = − (4) where A (the pre‐exponential factor) and E (the activation energy) are the Arrhenius parameters and R is the gas constant. Arrhenius parameters, together with the reaction model are called the kinetic triplet. Sincedt
d
α
in Eq.4 can be difficult to evaulate accurately, temperature dependence in Eq. 4 can be rewritten in the form of: ) ( ). exp(α
β
α
f RT E A dT d = − (5) wheret
T
T
−
o=
β
is the heating rate. By separation of variable and integration, the following equation obtained:∫
=
∫
−
=
αβ
α
α
α
0)
exp(
)
(
)
(
)
(
T TodT
RT
E
A
f
d
g
(6)For non‐isothermal conditions, there are several relationship used to compute Arrhenius parameters each of which is based on an approximate form of the temperature integral [Brown et al.1980].
One such approximation is given by Coats‐ Redfern [Coats and Redfern 1964] as following: RT E E T R E AR T g = − − ) 2 1 )( ln( ) ) ( ln( 2
β
α
(7) whereT
is the mean experimental temperature. This method is reported [Carr and Galwey 1984] to be one of the most frequently used to evaluate non‐isothermal data. Arrhenius parameters determined from the plot) T ) ( g ln( α2 vs.
T
1
. This kind of calculation of kinetic triplet is called as model‐fitting method.
Model fitting approach, Arrhenius parameters are found by form of g(α) assumed. Since in a non‐isothermal experiment both T and α vary simultaneously, the model‐fitting approach generally fail to achieve a clean separation between the temperature dependence k (T) and the reaction model, g(α). For this reason, the model fitting methods tent to procedure highly uncertain value of Arrhenius parameters. The second reason of deviation from model‐fitting method between the assumed form of g(α) and the true reaction model are reveled in decomposition of solid compound having several steps. This means that the effective activation energy determined from thermal analysis experiments will also be a function of temperature and extend of conversion. Thus, the application of model‐fitting methods is aimed at extracting a single value of activation energy for an overall process.
The experimental data can be analyzed by other approximation such as temperature integral method, isoconversion method and model free‐method, since the integral of Eq.6 in the right‐ hand side has not exact analytical
solution. In all mentioned approximation, the value of integral between 0 and To is negligible,
since the starting temperature is near room temperature and the activation energy is not too low. In this case Eq.6 becomes
∫
− = T dT RT E A g 0 ) exp( ) ( β α (8) Eq.8 can be rewritten by taking x= E/RT∫
∫
∞=
−
=
=
xx
p
R
E
A
dx
x
x
R
E
A
f
d
g
)
(
.
.
)
exp(
.
)
(
)
(
2 0β
β
α
α
α
α (9)The p(x) function on the right hand side is generally termed as temperature integral [Heal 1999] which can be approximated in different ways.
The most common of p(x) function lead to expression of the type
)
(
.
)
exp(
)
(
2Q
x
x
x
x
p
=
−
(10)where Q(x) is a function with several particular forms. Q(x) can be considered the series expansion as given following ... ) ( ! 4 ) ( ! 3 ! 2 ! 1 ) ( 2 3 E RT E RT E RT x Q = − + − (11)
Q(x) function can also be expressed in the ratio of two forth order polynomials [Senum and Yang 1977] as given bellow:
120
240
120
20
96
86
18
)
(
4 3 2 2 3 4+
+
+
+
+
+
+
=
x
x
x
x
x
x
x
x
x
Q
(12)All, p(x)‐linear isoconversion methods involve the plotting of 1/T versus a logarithmic function which depends on the heating rate and temperature. The Q(x) function shows an approximation for the temperature integral used which is different for the different p(x)‐linear isoconversion methods. Therefore the approximation of the temperature integral is the key to understanding the different methods. The linear isoconversion method equation used in this study can be obtained by combining Eqs.10‐ 11 at constant fraction transformation as given following
)
x
exp(
).
x
(
Q
E
ART
)
(
g
2−
β
=
α
(13) For constant g(α), Eq.13 becomesexp(
)
)
(
.
)
(
2RT
E
x
g
E
AR
x
Q
T
=
−
β
(14) Taking the logarithm of both side of Eq.13 gives RT E g E AR x Q T ( )) = ln( . ( )) − ln( 2α
β
(15) In this study, the first three terms in Eq.11 was considered as Q(x) functionIterative procedure is used to approach the exact value of E in Eq.14 as following: • Plotting
)
)
(
ln(
2x
Q
T
β
vs.T
1
under the assumption of Q(x)=1 to determine the initial value of E1.• Using E1 to calculate the value of Q(x)
function, then plotting
)
)
(
ln(
2x
Q
T
β
vs.T
1
to calculate a new value of E2 in slope• Comparing step E1 with E2, when En‐En‐1<
0.01 Kcal/mole, the last value of En is the
exact value of activation energy.
These kinds of approximation have been applied by [Guan and et al. 2004]. The present paper is aimed at preparation, characterization and thermal decomposing kinetics based on model‐fitting and model free method of three different ligands and their co‐complexes.
EXPERIMENTAL
Potassium tetraborate tetrahydrate were purchased from Merck. Shimatzu model TG and DSC instruments were used for thermal analysis of both sodium perborate tetrahydrate and potassium tetraborate tetrahydrate. Thermogravimetric tests were performed in nitrogen gas flow of 0.850 ml/s and four different heating rates were applied.
RESULT AND DISCUSSION
Thermal calcination of potassium tetraborate tetrahydrate
TG and DTG analysis of the potassium tetraborate tetrahydrate were performed under nitrogen atmosphere at 5 oC/min heating rate as
given in Fig. 1.
Figure 1. TG/DTG curves for potassium tetraborate tetrahydrate. 0.0 0.1 0.2 0.3 0.4 0.5 0.6 0.7 0.8 0.9 1.0 100 200 300 400 500 600 700 800 co n v ert io n Temperature ( oC) 5 C/min 7 C/min 10 C/min 15 C/min Figure 2. The changes of conversion of potassium tetraborate tetrahydrate to potassium tetraborate with temperature for different heating rate.
From Fig.1, total weight‐loss was calculated as 23.59% which corresponds to the removal of 4 mol of water in the temperature range of 100‐900
oC. Simultaneous TG‐DTG curves show that the
highest water‐loss in sample was observed between 100 oC‐200 oC. The remaining 2 mol of
structural water was loss gradually up to about 900 oC. [Marezio et. al. 1963] claimed that the
structural formula of potassium tetraborate tetrahydrate can be best represented as K2[B4O5(OH)4].2H2O which means 2 mol of water
are in molecular structure and the remaining consist of hydroxyl groups. In the light of the TG and DTG result in Fig.1 and Figure 2, the thermal decomposition of potassium tetraborate tetrahydrate can be written as follows;
K2[B4O5(OH)4].2H2O Æ K2[B4O5(OH)4] + 2H2O
(100 – 200 oC), dehydration step (17)
K2[B4O5(OH)4] Æ K2B4O7+2H2O (200 – 900 oC),
decomposition step (18) As seen in the above reaction steps, the thermal calcination of potassium tetraborate
tetrahydrate can be subdivided into two stages; dehydration and decomposition, respectively.
Figure 2 shows the conversion of PTT to potassium perborate with temperature for different heating rate. As seen in Fig. 2, all curve having different heating rate prove the calsination of PTT are realized by two decisive steps named dehydration and decomposition as represented by Eqs. 17‐18.
Nonisothermal kinetics for thermal decomposition of potassium tetraborate tetrahydrate
For both dehydration and decomposition steps of potassium tetraborate tetrahydrate data obtained from TG curves, inserting various g(α) model into Eq.7 results in a set of Arrhenius parameters calculated from the plot
ln(
(
2)
)
T
g
α
vs.T
1
. The set of Arrhenius parameters obtained the best five and four reaction models for the thermal dehydration and decomposition of potassium tetraborate tetrahydrate are shown in Tables 1 and 2.
As can be seen in Table 1 the thermal dehydration of potassium tetraborate tetrahydrate were performed at non‐isothermal condition at constant heating rate of 5, 7, 10 and 15 oC/min., since the most of given equation is
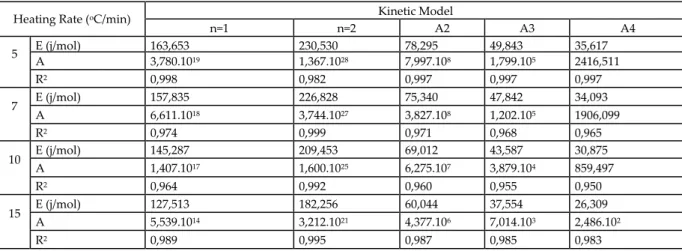
approximate at same regration coefficient. On the other hand, the thermal decomposition of potassium tetraborate tetrahydrate step (Table 2) was not given satisfactory fit to any used g(α) models. The cause of this deviation is attributed to multi stage kinetics controlled by different g(α) models. Table 1. The kinetic parameters for dehydration of potassium tetraborate tetrahytdrate to potassium tetraborate dehydrate. Kinetic Model Heating Rate (oC/min)
n=1 n=2 A2 A3 A4
E (j/mol) 163,653 230,530 78,295 49,843 35,617 A 3,780.1019 1,367.1028 7,997.108 1,799.105 2416,511 5 R2 0,998 0,982 0,997 0,997 0,997 E (j/mol) 157,835 226,828 75,340 47,842 34,093 A 6,611.1018 3,744.1027 3,827.108 1,202.105 1906,099 7 R2 0,974 0,999 0,971 0,968 0,965 E (j/mol) 145,287 209,453 69,012 43,587 30,875 A 1,407.1017 1,600.1025 6,275.107 3,879.104 859,497 10 R2 0,964 0,992 0,960 0,955 0,950 E (j/mol) 127,513 182,256 60,044 37,554 26,309 A 5,539.1014 3,212.1021 4,377.106 7,014.103 2,486.102 15 R2 0,989 0,995 0,987 0,985 0,983 Table 2. The kinetic parameters for decomposition of potassium tetraborate dihydrate to potassium tetraborate. Kinetic model β oC/min n =1 n = 2 n = 2/3 A2 D3 R2 E (j/mol) 266,154 41,814 22,576 8,937 53,907 20,742 A 177,421 1556,957 5,094 0,124 1051,5404 1,429 5 R2 0,896 0,968 0,847 0,783 0,891 0,817 E (j/mol) 20,227 33,086 16,805 5,387 43,063 15,258 A 2,798 123,946 0,955 0,037 44,853 0,289 7 R2 0,868 0,971 0,799 0,618 0,875 0,758 E (j/mol) 17,187 29,248 13,990 3,619 37,928 12,548 A 1,456 52,051 0,523 0,022 13,331 0,162 10 R2 0,795 0,950 0,703 0,370 0,825 0,649 E (j/mol) 13,103 24,167 10,187 1,102 31,274 8,875 A 0,543 15,117 0,204 0,005 2,567 0,064 15 R2 0,630 0,878 0,501 0,038 0,723 0,432
The general results for data illustrated in Tables 1 and 2 obtained by CR method can be summarized as following
• CR or non‐isothermal method approach to kinetic analysis is generally unsuitable for determination of kinetic triplex, since thermal calcination of potassium tetraborate tetrahydrate are realized in multi‐stage reaction steps. • The interrelationship between the g(α)
model and activation energy found by CR method is effectively unable to separate the individual contributions to the composite function.
Model Free Linear Isoconversional Method for thermal dehydration and decomposition of potassium tetraborate tetrahydrate
As illustrated in Tables 1 and 2, model fitting methods can not represent to extract by a single step of global Arrhenius parameters for the whole dehydration and decomposition process of potassium tetrabrorate tetrahydrate and are therefore unable to reveal this type of complexity in solid state reaction. On the other hand, the model free isoconversional method allows for without error detecting multi‐stage kinetics as dependence of the activation energy on the extend of dehydration and decomposition conversion.
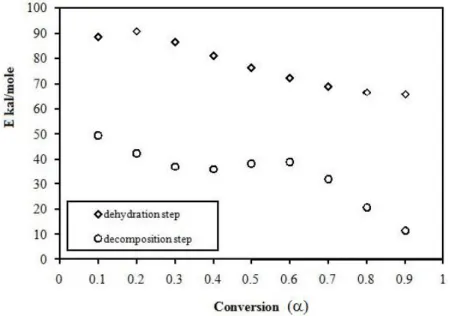
In order to calculate activation energy of dehydration and decomposition of potassium tetraborate tetrahydrate for any particular value of α in Eq.15, a set of experiments carried out at different heating rates. The change of best value of activation energy with conversiton is given in Fig.3 for both dehydration and decomposition of potassium tetraborate tetrahydrate separately. As can be seen in Fig.3 the changes of activation energy values are decreased with degree of conversion for both step of potassium tetraborate tetrahydrate. Non‐isothermal dehydration and decomposition of potassium tetraborate tetrahydrate gives E‐α dependence that the activation energy decreases monotonically from 90‐65 and 50‐10 kcal/mol at the beginning and near the end of conversion, respectively. Variation in the value of activation energy may be a hint of change in reaction mechanism with reaction progressing in some cases. If activation energy values are not constant with conversion for any decomposition, then one is probably dealing with either a change in mechanism as the reaction proceeds or a more complex situation such as a mutually independent multiple, competitive or consecutive reaction system, reversible reaction [Vyazovkin and Lesnikovich 1990; Vyazovkin et al. 1992; Vyazovkin and Linert 1995; Vyazovkin 2006].
Figure 3. Dependence of the activation energy of decomposition and dehydration of potassium tetraborate
CONCLUSIONS
The application of the model fitting method to a multi‐step decomposition of potassium tetraborate tetrahydrate results to be unsuitable for non‐isothermal data. A variable alternative to the model‐fitting method is the model‐free isoconversion method. The activation energy changes with conversion obtained by Isothermal and model free isoconversional method give approximately same behavior for the thermal dehydration of sodium perborate tetrahydrate to
sodium perborate monohydrate. But, the changes of activation energy values with conversion are different for dehydration and decomposition steps of potassium tetraborate tetrahydrate. As a result, by isoconversional method non‐isothermal data of sodium perborate tetrahydrate and potassium tetraborate tertrahydrate were analyzed and the complexities in the both material kinetics were revealed by using the activation energy, E vs. conversion, α plots. REFERENCES Andrea, M., Guy, B., 1994. Patent no: WO9404655 1994‐03‐03. Brown, M.E., Dollimore, D., Galwey, A.K., 1980. Reaction in the Solid State (Comprehensive Chemical Kinetics), vol.22, Elsevier, Amsterdam, 340. Carr, N.J., Galwey, A.K., 1984. Thermochima Acta, 79, 323. Coats, J A.W., Redfern, P., 1964. Nature 201, 68. Çelik, M.S., Suner, F., 1995. Thermochimica Acta, 245, 167. Dugua, J., Cuer, J.P., 1987. Eur. Patent Appl., EP19850420035 Eymir, Ç., Okur, H., 2005. Thermochimica Acta, 428, 125. Guan, C., Li, L., Chen, D., Gao, Z., Sun, W., 2004. Thermochimica Acta, 413, 31. Gürbüz‐Beker, Ü., Recepoğlu, O., Bulutcu, A.N., 1994. Thermochimica Acta, 235, 211. Heal, G.H., 1999. Thermochima Acta, 340/341, 69. Kazuhiro, Y., Jinichi, I., Takeo, K., 2004. Patent no: EP1439217 2004‐07‐21. Kirk Othmer et al., 1992. Kirk‐Othmer Encylopedia of Chemical Technology, vol.4, 4th ed., John Wiley & Sons, 22950. Marezio, M., Plettinger, H.A., Zachariasen, W.H., 1963. Acta Crysatlogr., 16, 975. Piloyan, G.O., Ryabchikov, I.D., Novikova, O.S., 1966. Nature, 212, 1229. Şahin, Ö., Bulutcu, A.N., 1999. Chem. Eng. Sci., 54, 115. Şahin, Ö., Cennetkusu, E.S., Dolas, H., Özdemir, M., 2006. Thermochimica Acta, 440, 7. Sahin, O., Genli, N., Ozdemir, M., 2005. Chemical Engineering and Processing 44, 1. Salla, J.M., Moroncho, J.M., Ramis, Y., Cadenato, A., 2005. J. Therm. Anal., Calor. 80, 163. Senum, G.I., Yang, R.T., 1977. J. Thermal Anal., 11, 445 Toyoyuki , T., Hisashi, O., Hiroaki, K., Jun, H., Kazuhıro, D., Hıroakı, Y., 2003. European Patent, Patent No: US6503630 2003‐01‐07. Xial, E., Simpson, L. C., Denick, J. JR, 1999. Patent no:WO9943363 1999‐09‐02. Vyazovkin, S., Goryachko, V.I., Lesnikovich, A.I., 1992. Thermochima Acta, 197, 41. Vyazovkin S., Lesnikovich, A.I., 1994. Thermochima Acta, 165, 273. Vyazovkin, S., Linert, W., 1995. J. Chem. Kinet., 27, 73. Vyazovkin, S., 2000. Thermochima Acta, 355, 155. Vyazovkin, 2001. J. Therm. Anal. Cal., 64, 829. Vyazovkin, S., 2006. J. Therm. Anal., Cal. 83, 45. Zhenze, H., Joseph, S., 2004. Patent no: US2004185028 2004‐09‐23.