T.C.
SELÇUK ÜNİVERSİTESİ
SOSYAL BİLİMLER ENSTİTÜSÜ
İŞLETME ANABİLİM DALI
MUHASEBE FINANSMAN BİLİM DALI
FINANCIAL STATEMENT ANALYSIS IN THE AIRLINE
INDUSTRY: A COMPARATIVE STUDY OF TURKISH
AIRLINES AND ROYAL DUTCH AIRLINES (KLM)
Mukhtar Hassan MOHAMED
YÜKSEK LİSANS TEZİ
Danışman
Prof. Dr. Fehmi KARASİOĞLU
ii
Table of Contents
Acknowledgment... vi
Abbreviations ... ix
List of Tables ... xi
List of Figures ... xii
CHAPTER ONE ... 1
1. BACKGROUND OF THE STUDY ... 1
1.1. GENERAL INTRODUCTION ... 1
1.1.1. RESEARCH TOPIC ... 4
1.1.2. OBJECTIVES AND THESIS QUESTIONS ... 5
1.1.3. IMPORTANCE OF THE STUDY ... 6
1.1.4. LIMITATIONS ... 6
1.1.5. METHODOLOGY ... 7
1.1.6. THESIS OUTLINES ... 8
1.2. THE AIRLINE INDUSTRY ... 9
1.2.1. OVERVIEW OF THE INDUSTRY AND ITS MAJOR DEVELOPMENTS ... 9
1.2.2. ECONOMIC CHARACTERISTICS OF AIRLINE INDUSTRY ... 10
1.2.3. THE ECONOMIC PERFORMANCE OF AIRLINE INDUSTRIES ... 13
1.2.4. WORLD’S TOP AIRLINES – 2014 ... 16
1.3. INFORMATION BACKGROUND OF THE TWO FIRMS TURKISH AIRLINES (THY) AND ROYAL DUTCH AIRLINES (KLM) ... 17
1.3.1. TURKISH AIRLINES (THY) ... 17
1.3.2. ROYAL DUTCH AIRLINES (KLM) ... 21
CHAPTER TWO: FINANCIAL ANALYSIS AS A VEHICLE OF FIRM’S VALUATION ... 24
2.1. THE ROLE OF FINANCIAL ANALYSIS IN INFORMATIONAL SUPPORT ... 24
2.1.1. MAIN TYPES OF FINANCIAL ANALYSIS ... 25
2.2. FINANCIAL RATIOS: THEORITICAL DISCUSSION ... 31
2.2.1. LIQUIDITY MEASUREMENTS ... 35
2.2.2. BALANCE SHEET AND LIQUIDITY ... 37
2.2.3. PROFITABILITY RATIOS ... 38
2.2.4. EVALUATION OF EFFICIENCY ... 40
2.2.5. LEVERAGE RATIOS... 43
2.2.6. LIMITATIONS ON USING FINANCIAL RATIOS ... 46
2.3. SOURCE OF INFORMATION ... 47
iii
2.3.2. INTERNATIONAL APPROACHES TO FINANCIAL STATEMENTS ... 51
2.3.3. RELATIONSHIP BETWEEN FINANCIAL ANALYSIS AND AUDITING ... 53
2.4. IFRS ADOPTION IN THE EUROPEAN UNION ... 53
2.4.1. THE IMPLEMENTATION OF IFRS IN TURKEY ... 56
2.4.2. APPLICATION OF IFRS IN NETHERLANDS ... 58
CHAPTER THREE: ANALYSIS, DISCUSSION AND CONCLUSION ... 59
3.1. DATA COLLECTION ... 59
3.2. DATA ANALYSIS ... 59
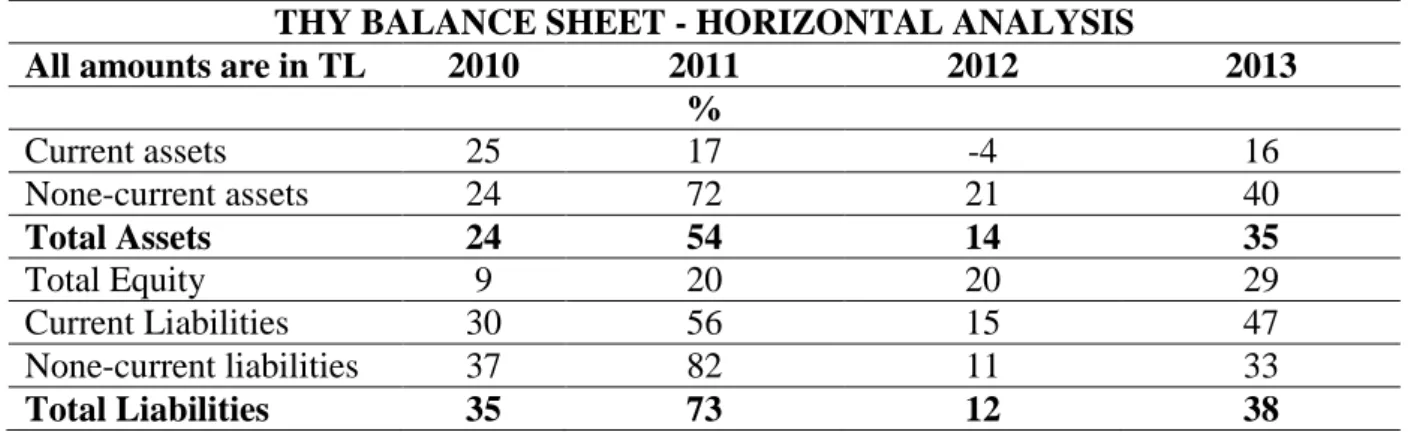
3.3. HORIZONTAL ANALYSIS ... 61
3.3.1. THY’S AND KLM’S BALANCE SHEET ... 61
3.3.2. THY’S AND KLM’S INCOME STATEMENTS ... 64
3.4. VERTICAL ANALYSIS ... 68
3.4.1. THY’S AND KLM’S BALANCE SHEET ... 68
3.4.2. THY’S AND KLM’S INCOME STATEMENT ... 72
3.5. RATIO ANALYSIS ... 74
3.5.1. LIQUIDITY RATIOS ... 75
3.5.2. ACTIVITY RATIOS ... 78
3.5.3. LEVERAGE RATIOS... 82
3.5.4. PROFITABILITY RATIOS ... 85
3.6. SPECIFIC RATIOS FOR AIRLINES... 91
3.6.1. REVENUE PASSENGER KILOMETER... 91
3.6.2. AVAILABLE SEAT KILOMETER ... 91
3.6.3. LOAD FACTOR ... 92
COMPARISON OF THE TWO FIRMS ... 93
BIBLIOGRAPHY ... 96
vi
Acknowledgment
First of all I would like to thank the almighty Allah for helping me in the successful accomplishment of this thesis.
I would like also to express my deep appreciation and sincere gratitude to my supervisor Prof. Dr. Fehmi KARASIOĞLU who has given me his unreserved help and persistent guidance, creative suggestions and critical comments from the beginning to the end of my research.
I take this opportunity to express my heartiest thanks to the brothers: Mustafa İYİBİLDİREN, Kemal NALÇIN and Habib Y. AZ for their help and support.
Finally, I would like to thank my family, who has always been supporting and understanding during this work.
ix
Abbreviations
AFB : Accounting Based Financial Performance ATAG : Air Transport Action Group
BRSA : Banking Regulation and Supervision Agency CMB : Capital Market Board
DFI : Development Financial Institutions EBIT : Earnings before Interest and Tax
EBITDAR : Earnings before Interest, Tax, Depreciation, Amortization and Restructuring or Rent costs
EEA : European Economic Area
EFRAG : European Financial Reporting Advisory Group
EPS : Earnings per Share
EU : European Union
GAAP : General Accepted Accounting Standards
GDP : Gross Domestic Product
IAS : International Accounting Standards IASB : International Accounting Standard Board IASC : International Accounting Standards Committee IATA : International Air Transport Association ICAO : International Civil Aviation Organization IFAC : International Federation of Accounting IFRS : International Financial Reporting Standards
IOSCO : International Organization of Securities Commission KLM : Royal Dutch Airlines
MDA : Multiple Discriminate Analyses
ROA : Return on Asset
x
ROCE : Return on Capital Employed
ROE : Return on Equity
TASB : Turkish Accounting Standard Board TFRS : Turkish Financial Reporting Standards THY : Turkish Airlines
TL : Turkish Lira
xi
List of Tables
Table 1 : World’s Top Airlines - 2014……….16
Table 2 : THY route Networks as of December 2014………..19
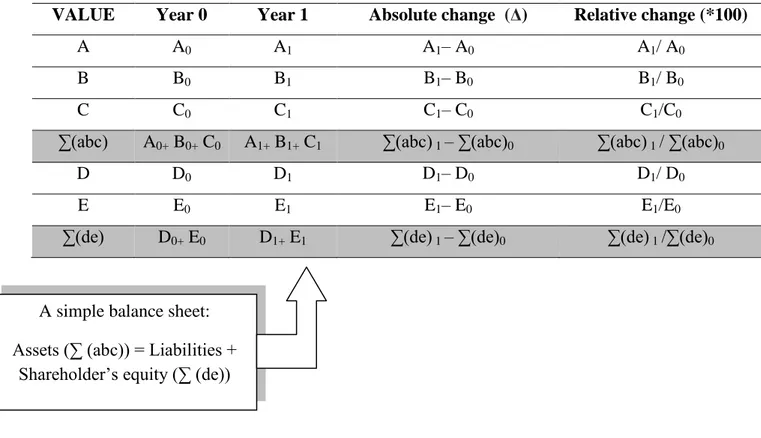
Table 3 : Horizontal Analysis method of financial Analysis………29
Table 4 : Vertical Analysis method of financial Analysis……….30
Table 5 : Horizontal trends of THY’s balance sheet during the analyzed period…….62
Table 6 : Horizontal trends of KLM’s balance sheet during the analyzed period……..64
Table 7 : Vertical analysis of THY’s income statement……….72
Table 8 : Vertical analysis of KLM’s income statement………73
xii
List of Figures
Figure 1 : Thesis Outline………8
Figure 2 : Airline Industry Net Profits (in billions of dollars)………15
Figure 3 : THY passenger growth from 2009 up to 2013. Amounts are in million……20
Figure 4 : KLM passenger growth from 2009 up to 2013. Amounts are in million……23
Figure 5 : Classification of financial analysis………..26
Figure 6 : Generalized overview of a financial reporting system………50
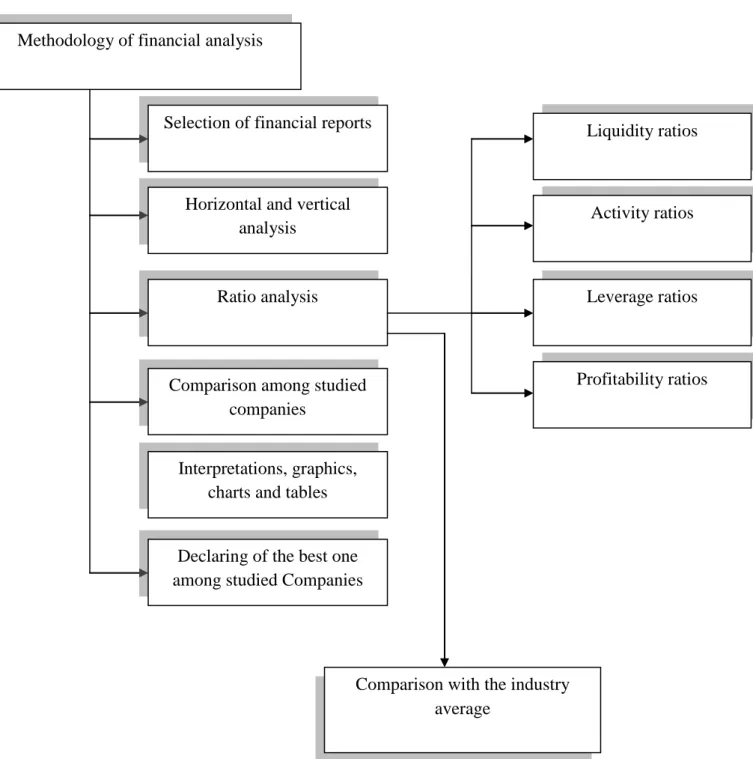
Figure 7 : Methodology of Financial Analysis………60
Figure 8 : Horizontal trends of THY revenue form 2009 – 2013………65
Figure 9 : Net profit for the year for Turkish Airlines from 2009 up to 2013………….66
Figure 10 : Horizontal trends KLM revenue from 2009 – 2013………67
Figure 11 : Net profit for the year for KLM from 2009 up to 2013………..68
Figure 12 : Average proportion of current and non-current assets to the total assets of the studied companies from 2009 up to 2013……….69
Figure 13 : THY’s current assets compared to its current liabilities……….70
Figure 14 : KLM’s current assets compared to its current liabilities……….71
Figure 15 : Current Ratio for Studied companies and industry average (2009 – 2013)....76
Figure 16 : Quick Ratio for Studied companies and industry average (2009 – 2013)…..77
Figure 17 : Cash Ratio for Studied companies and industry average (2009 – 2013)……78
Figure 18 : Receivable Turnover Ratio for Studied companies and industry average (2009 – 2013)………..79
Figure 19 : Total Asset Turnover Ratio for Studied companies and industry average (2009 – 2013)………80
Figure 20 : Current Asset Turnover Ratio for Studied companies and industry average (2009 – 2013)………81
Figure 21 : Fixed Asset Turnover Ratio for Studied companies and industry average (2009 – 2013)………82
Figure 22 : Debt Ratio for Studied companies and industry average (2009 – 2013)…….83
Figure 23 : Debt to equity Ratio for Studied companies and industry average (2009 – 2013)……….84
Figure 24 : Interest coverage Ratio for Studied companies and industry average (2009 – 2013)………85
xiii
Figure 25 : Return on Asset for Studied companies and industry average (2009 –
2013)……….86 Figure 26 : Return on Equity for Studied companies and industry average (2009 –
2013)……….87 Figure 27 : Return on Capital Employed for Studied companies and industry average (2009 – 2013)………88 Figure 28 : Operating profit margin for studied companies and industry average (2009 – 2013)……….89 Figure 29 : Net profit margin for studied companies and industry average (2009 –
1
CHAPTER ONE
1. BACKGROUND OF THE STUDY 1.1. GENERAL INTRODUCTION
Accounting is the language of business. It is the vehicle for communicating financial information about a company in the forms of financial statements to many different groups of people. The financial statements of the business firm serve as the primary financial reporting mechanism of the firm, both internally and externally. It is the method by which management communicates financial information to decision makers such owners, creditors, investors, customers, suppliers, government agencies, economists, and others. Each of these groups may have different uses for the information. Owners are concerned that the company produce a profit and increase their wealth. Creditors want to know that the company is liquid enough to make debt payments and solvent enough to repay the loan principle if the business fails. Managers want to be compensated for their work and have confidence their employer will provide job security. Customers and suppliers want to benefit from their ongoing business relationships. The government wants to ensure the public good, by collecting taxes and improving financial reporting. All these stakeholders can benefit and achieve their objectives if they have good accounting information.
Accounting is an ever-changing communicative system. All parties with a stake in the economic environment, upon which accounting reports, continually press for improvements in the information that accounting systems provide. They are records that provide an indication of the organization’s financial status. It quantitatively describes the financial health of the company. It helps in the evaluation of company’s prospects and risks for the purpose of making business decisions. The objective of financial statements is to provide information about the financial position, performance and changes in financial position of an enterprise that is useful to a wide range of users in making economic decisions. Financial statements should be understandable, relevant, reliable and comparable. They give an accurate picture of a company’s condition and operating results in a condensed form. Reported assets, liabilities and equity are directly related to an organization's financial position whereas reported income and expenses are directly related to an organization's financial performance.
2
Because of the competition conditions, increase in liberalization and internationalization of financial markets, diversification of the activities in these markets and increase in the mobility of capital, the importance of the efficient usage of resources in the companies has become vital and activities aimed at appreciating the company values has also gained importance. In today’s competitive world economy, evaluating the financial performance of a company has a great importance not only for managers, creditors and current or potential investors but also for the companies taking place in the same sector. Performance evaluation of companies is generally carried out within the context of financial analyses (Yalcin, Bayrakdaroğlu and Kahraman, 2012: 350-364).
Business activities of a company always attract certain attention from various market participants such as associates, investors, competitors or authorities, who are expressly or by implication interested in its financial results. The third parties are able to estimate financial performance by analyzing accounting statements available for public use. Financial analysis serves as a primary tool for this purpose. The main idea of financial analysis is to obtain enough of key values (the most informative ones), that represent objective and exact financial situation within a company: its profits and losses, structural changes in assets and liabilities, level of competitiveness, relations with debtors and creditors. This analysis can be used both for estimation of current financial condition and for its prediction in the nearest or more remote future. As the concept of financial performance is considered under different meanings such as return, productivity, output and economic growth, using the financial ratios in the performance evaluation process can be suitable for both companies and related sectors. Financial ratios derived from the data in income statement and balance sheets are considered as crucial measurement tools in determining performance and financial assets of companies.
The basic accounting information derived from financial reports does not indicate whether gained profit is sufficient or not; or are assets being used proficiently? Is the overall productivity efficient? Do the financial problems exist within the business? To answer such questions, ratio analysis can be performed in which required data are extracted from income statements and balance sheets (Stallwood, 1996: 1). Analysis and interpretation of financial statements helps in determining the liquidity position, long term solvency, financial viability, profitability and soundness of a firm. Therefore, The four basic types of financial statements: balance sheet, income statements, cash flow statements, and statements of retained earnings should be analyzed and interpreted.
3
In the performance evaluation, the most common used financial ratios are traditional financial indicators that are usually related to profitability. Traditional financial measures known to be as accounting-based financial performance (AFP) measures have basically been used to evaluate the company’s financial situation and performance. These measures provide useful quantitative financial information to both investors and analysts so that they can evaluate the operation of a company and analyze its position within a sector over time (Gallizo & Salvador, 2003: 267 – 283). However, these measures are gathered into one group within itself because they provide similar information. In other words, AFP measures can be classified as liquidity ratios, financial leverage ratios, profitability ratios, activity ratios, and growth ratios with respect to the information they provide.
For many years, a great number of studies in the literature have shown the benefits and uses of the financial ratios (Chen and Shimerda, 1981: 50-60). Financial ratios allow the user to summarize and analyze related data to provide meaningful information for making decisions (Singh and Schmidgall, 2002: 201-213). And, the significance of the financial ratios also demonstrates the strong and weak sides of companies in terms of liquidity, growth, and profitability. Therefore, it implies whether the firm is operating properly or corrective action is required. Moreover, ratios make it possible to audit, estimate the bankruptcy, rank the company, approve a loan, determine the company value, issue the stocks, rate the bond, proceed with acquisitions and mergers, and stop firm operations in a territory (Manger et al., 1995: 97-106; Gallizo et al., 2002). Martikainen et al., (1995) and Emrouznejad et al., (2012) declared that ratio analysis is done through a comparison of the behavior of a ratio with some criteria expressing the general success of the economy or industry, and it can also be conducted with other businesses operating in the same sector.
According to Whittington (1980: 219–223) there are mainly two usages of financial ratios: normative and positive. When company ratios are compared with some standard values such as mean, the utilization is normative (Barnes, 1987: 449–461). The positive application of financial ratios is for forecasting purpose.
Financial ratio analysis is a useful measure to provide a snapshot of a firm’s financial position (Muresan and Wolitzer, 2004: 2) at any particular moment of time or to provide a comprehensive idea about the financial performance of the company over a particular period of time. Use of financial ratios in finance is multi-dimensional. It is not only useful for judging the financial health or performance of a particular firm over time, it is also a useful
4
tool for comparing a firm’s financial position and performance with respect to others in the same or different industry to pinpoint problem areas or to identify areas of further improvements (Bandyopadhyay and Chakraborty, 2010: 142-164).
Financial ratios are computed from financial statements of a company namely Balance Sheet, Profit and Loss Account or Income Statement, and Cash Flow Analysis. Interpretation of the financial ratios is complicated and multi-dimensional. While developing and computing the different financial ratios, consideration is given to capture the various aspects of financial position and financial performance of a company. In order to use a financial ratio, one needs to have a relatively decent knowledge of basic mathematical and accounting concepts. Over the years, there has been a proliferation in the number of financial ratios developed and applied by analysts and researchers (Ali Hamdi and Charbaji, 1994:1 – 25).
However, it is impractical and sometimes improbable to compute all the ratios to reach to a conclusion desired for. With the presence of inter-relationships within and among the sets of financial ratios, a smaller number of representative ratios may be sufficient to capture most of the desired information (Ali Hamdi and Charbaji, 1994: 1 – 25). This inter-relationship is called as ‘multicollinearity’ in statistical language. The traditional ad hoc grouping of ratio such as earnings and profitability, liquidity, leverage and solvency, asset efficiency, operating efficiency, etc. is based on the analysis conducted in the studied companies.
1.1.1. RESEARCH TOPIC
All companies are living in an era of ever changing world which is uncertain, complex and unpredictable. Globalization of markets, increase in competition and constant changes in technological advancement has put huge pressure on organizations to continuously develop and be adaptable to face the challenges of rapidly changing environment. Most organizations are struggling to survive and are concentrating on developing efficiency at all levels of the organization. In such case performance evaluation of the company is very much important. Performance evaluation of a company is usually related to how well a company can use its assets, shareholder equity and liability, revenue and expenses.
The airline industry exists in an intensely competitive market. In recent years, there has been an industry-wide shakedown, which will have far-reaching effects on the industry's trend towards expanding domestic and international services. An important key area to keep a close eye on is costs. The airline industry is extremely sensitive to costs such as fuel, labor and
5
borrowing costs. Because many costs are fixed, the profitability of individual companies is determined by efficient operations and on favorable fuel and labor costs.
Despite the headline number, the airline business remains vulnerable—to oil-price shocks, accidents and terrorism. Since September 11, 2001 and during the ensuing economic slowdown, a number of airline companies have experienced significant financial difficulties, including bankruptcies and near bankruptcies. In an economic setting where many airlines are struggling to achieve or maintain profitability, it is important for accountants, auditors, and financial analysts to be able to analyze the relative performance of such companies.
In order to determine the financial position of the airline companies and to make a judgment of how well the companies are efficiency in their operations and how well the companies have been able to utilize their assets and earn profit, This thesis will present comparison of the financial statement analysis for Royal Dutch Airlines (KLM) and Turkish Airlines (THY) for the years ended 2009 – 2013. The analysis will include horizontal and vertical of the financial statements of both companies and key ratio analysis.
1.1.2. OBJECTIVES AND THESIS QUESTIONS
The financial analysis of companies is usually undertaken so that investors, creditors, and other stakeholders can make decisions about those companies. The focus of this thesis is on the financial statement analysis of Turkish Airlines (THY) and Royal Dutch Airlines (KLM) that are publicly traded and therefore make public the data and information needed by stakeholders, who can then use the analytical procedures.
The primary objectives of this thesis include:
To identify the historical trends and growth levels which have driven the studied companies up until now.
To measure and evaluate the liquidity, profitability, solvency and overall financial performance of selected airline companies.
The analysis conducted in the thesis is intended to give an investor the insight into the profitability of Turkish airlines and Royal Dutch Airlines in the future as well as other financial insights as they are key indicators to any valuations.
To evaluate how the companies have been performing in creating value for its shareholders, generate growth and control its risks, both operational as well as financial, will help reveal some of the financial aspects for the company.
6
THESIS QUESTIONS/ HYPOTHESIS:
What is the performance of the companies related to liquidity ratios?
What is the performance of the companies related to Asset management ratios? What is the performance of the companies related to Profitability ratios? What is the performance of the companies related to Market value ratios? What is the performance of the companies related to debt management ratios. What is the best performance between two companies?
1.1.3. IMPORTANCE OF THE STUDY
Financial analysis determines a company's health and stability. The data gives you an intuitive understanding of how the company conducts business. Stockholders can find out how management employs resources and whether they use them properly. Governments and regulatory authorities use financial statements to determine the legality of a company's fiscal decisions and whether the firm is following correct accounting procedures. Finally, government agencies, such as the Internal Revenue Service, use financial statement analysis to decide the correct taxation for the company. So, the study made in this thesis is useful for all stakeholders of Turkish airlines and Royal Dutch airlines.
1.1.4. LIMITATIONS
The valuation is made from the point of view of an external investor and will as such only be based on publicly available information. As the valuation is made from an external investor’s perspective the thesis is solely based on secondary information.
Furthermore the data used will mainly be that of the last five years annual reports made by Turkish Airlines and Royal Dutch Airlines and only to a very limited extend the subsequent interim reports, the reason being that the annual report is more detailed than the interim reports.
In terms of models used for the strategic analysis, this thesis will be using horizontal analysis, vertical analysis and ratio analysis and the findings and conclusions are based the results reached by using these models.
7
1.1.5. METHODOLOGY
Financial statement analysis should focus primarily on isolating information useful for making a particular decision. The information required can take many forms but usually involves comparisons, such as comparing changes in the same item for the same company over a number of years, comparing key relationships within the same year, or comparing the operations of several different companies in the same industry. This thesis presents a quantitative analysis of information reported in financial statements of selected airlines using three categories of analysis methods: horizontal (trend analysis), vertical and ratios analysis to not only understand their behavior specific to the airline industry and trends in the course of time, but also assess the airlines’ financial performance for the last five years (2009-2013) which will reveal the main challenges that airlines are currently facing. Initially, horizontal and vertical analysis for balance sheets and income statements were conducted. Thereafter, to assess the relationships between various data on balance sheets and income statements, financial ratios were measured and evaluated for the studied period. Ratio analysis measures inter-relationship between different sections of the financial statements and they are taken as guides that are useful in evaluating companies’ financial position and operation and making comparison with results in previous years or with others in the same industry.
As a source of information, annual reports for the studied companies are used to calculate set of financial ratios. All the ratios are calculated from the following financial statements and relevant notes to accounts.
Consolidated Balance Sheet
Consolidated statements of income
Consolidated Statement of changes in Equity
Consolidated statement of Cash
Notice that the financial statements cover five years and all the titles listed above include the word “consolidated” because the statements include the accounts of Turkish Airlines (THY) and Royal Dutch Airlines (KLM) and all subsidiaries in which the companies’ ownership interest enables it to exert control.
8
1.1.6. THESIS OUTLINES
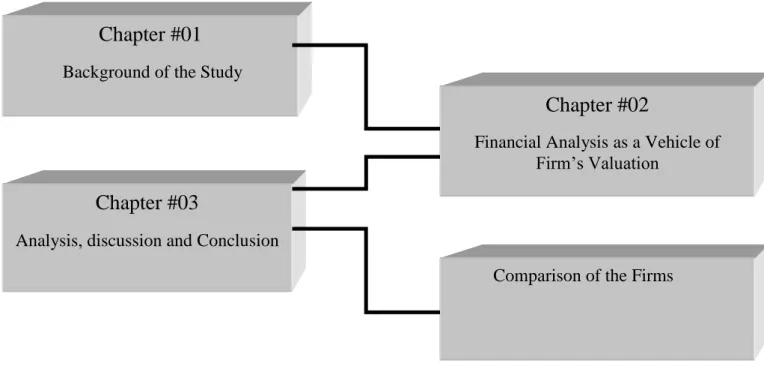
The thesis comprise of three chapters including: background of the study, financial analysis as a vehicle of firm’s valuation and analysis, discussion and conclusion. All chapters are shown in figure 1.
Figure 1: Thesis Outline
Chapter #01
Background of the Study
Chapter #02
Financial Analysis as a Vehicle of Firm’s Valuation
Comparison of the Firms
Chapter #03
9
1.2. THE AIRLINE INDUSTRY
This section provides a brief overview on the global airline industry, Definition of the industry and general characteristics. It also presents some major development of the airline industry, as a branch of transportation systems that has occurred in the last decades. Finally, it describes the significance and the catalytic nature of air transport/aviation sector for the nation and global economic development through Supporting Gross Domestic Product (GDP), job creation, tourism and facilitation of global trade.
1.2.1. OVERVIEW OF THE INDUSTRY AND ITS MAJOR DEVELOPMENTS
The Airline Industry is companies that provide air transport services for travelling passengers and freight. The industry lease or own its aircraft with which to supply these services and may form partnerships or alliances with other airlines for mutual benefit. Generally, airline companies are recognized with an air operating certificate or license issued by a governmental aviation body. Airlines vary from those with a single aircraft carrying mail or cargo, through full-service international airlines operating hundreds of aircraft. Airline services can be categorized as being intercontinental, intra-continental, domestic, regional, or international, and may be operated as scheduled services or charters.
The airline industry provides service to almost every corner of the globe, and has been an integral part of the creation of a global economy. It provides the only transportation network across worldwide and it is crucial for global business development and tourism enrichment. It is also essential for the fast movement of people and cargo shipments around the world. Air transportation is one of the most important services to offer both significant social and economic benefits by serving tourism and trade, it contributes to economic growth and it also provides jobs and increases tax revenues. The airline industry itself is a major economic force, both in terms of its own operations and its impacts on related industries such as aircraft manufacturing and tourism. Few other industries generate the amount and intensity of attention given to airlines, not only among its participants but from government policy makers, the media, and almost anyone who has an anecdote about a particular air travel experience. On the other hand air transportation improves the quality of people’s lives by broadening their leisure and cultural experiences. It gives a broad choice of holiday destinations around the world and is an affordable means to visit distant friends and relatives.
10
During much of its development, the global airline industry dealt with major technological innovations such as the introduction of jet airplanes for commercial use in the 1950s, followed by the development of wide-body “jumbo jets” in the 1970s. At the same time, airlines were heavily regulated throughout the world, creating an environment in which technological advances and government policy took precedence over profitability and competition. It has only been in the period since the economic deregulation of airlines in the United States in 1978 that questions of cost efficiency, operating profitability and competitive behavior have become the dominant issues facing airline management. With the US leading the way, airline deregulation or at least “liberalization” has now spread too much of the industrialized world, affecting both domestic air travel within each country and, perhaps more importantly, the continuing evolution of a highly competitive international airline industry.
The airline industry supports tourism and international business by providing the world’s only rapid worldwide transportation network. In the year 2013, the global airline industry consists of nearly 1,400 commercial airlines operating more than 25,000 aircraft in commercial service, providing service to almost 4,000 airports. The air transport industry transported approximately 3.1 billion passengers making 36.4 million commercial flights across the globe (ATAG, 2014: 5 aviation benefits). In 2012, the world’s airlines flew almost 31 million scheduled flight departures and carried over 2.97 billion passengers (ATAG, 2014: 5). The annual passenger total is up approximately 5 per cent compared to 2012. The growth of world air travel has averaged approximately 5% per year over the past 30 years (ICAO, 2014: 7), with substantial yearly variations due both to changing economic conditions and differences in economic growth in different regions of the world.
1.2.2. ECONOMIC CHARACTERISTICS OF AIRLINE INDUSTRY
The airline industry is an important sub-sector of transport industry and is limited and constrained by many complex regulations. It is an industry characterized by rapid change, economic fluctuations, innovation and new technology (Peksatici, 2010: 5). Airlines are operated in an extremely dynamic and often highly volatile commercial environment.
During the last two decades, international civil aviation has been subjected to the most profound changes in the history and will continue to be so in the following years. The liberalization of air services, advanced communications technology, the globalization of markets, international alliances and privatization of airlines, airports and air traffic control
11
services are the major factors challenging the airline business (Fourie and Lubbe, 2006: 98 – 102).
The airline industry is a very particular system. Airlines provide a service, which is to transport a passenger across the world at an agreed price. There is neither physical product given to the consumer, nor inventory created and stored. Airlines also exhibit very particular economics that, over time, have motivated specific management concepts, tools and practices. In the following section, it will be demonstrated some economic characteristics exist in the airline industry.
The airline industry is highly sensitive to economic fluctuations. Airlines experience a high rate of traffic growth during period of prosperity but when the economy moves into recessionary period, the carriers normally experience substantial excess capacity.
In many countries these industry have been traditionally state owned. Such companies often have public service obligations (implying requirements to provide some services even where it is not economically viable for them to do so). The result is that the reform of these sectors is often highly politicized.
Profitability of the industry is generally weak, although, with high levels of depreciation and amortization, cash flow levels tend to be stronger and help stabilize the balance sheet.
The industry in general tends to have high levels of adjusted debt because of the use of operating leases. This adds an element of costs that are largely fixed and, over the longer term, are sensitive to interest rate movement at the time of renewal.
The airline industry is high labor intensive, from pilots and flight attendants to personnel responsible for baggage handling, ticketing and loading with highly developed skills that are expensive. These labor costs are mostly fixed and restrict flexibility in adjusting the expense structure when needed. Moreover, most of the labor force is unionized, which further limits operational flexibility.
Aircraft use high levels of fuels and are energy intensive, with operating profits materially influenced by fuel cost volatility. The airline industry is extremely sensitive to fuel, labor and borrowing costs. Due to the sharp rise in oil and jet fuel prices since 2003 an urgent need for cost cutting is in question. The average crude oil price has increased from $31 per barrel in 2003 to $130 per barrel in 2012 (IATA, 2013 annual
12
review: 14) and oil has always been the biggest challenge and uncertainty for the industry.
Interest rate levels have significant influence on borrowing costs and leasing costs, which indirectly affect profitability.
Load factors are keys, so the state of the economy is important to the airline industry. With a high proportion of fixed costs, a slowdown in the volume of passengers quickly translates into lower profitability and makes earnings volatile.
Many of their costs are sunk and unrecoverable once they are committed.
Operations are highly seasonal, with stronger results in the third quarter of the year, while the first and fourth quarters are usually weaker. Therefore, earnings through the year are highly volatile. As a result of seasonal operations profit margins are also seasonal and thin. Generally the net profit of an airline is between 1 and 3%. It increases in the summer, when most people take vacations, and decreases during winter (expect for holidays). Demand for air transport clearly presents peaks and valleys. Airlines deal with this by shifting customers across the year using discounts and promotions (e.g. double air miles during winter).
Airlines’ revenues come primarily from passengers although companies in the industry may also engage in the transportation of cargo, but this is usually on a much smaller scale
Barriers to entry into the industry are low because of the ability of the industry to lease aircraft at relatively low rates, particularly older or surplus aircraft. In addition to this the industry is capital intensive requiring large sums of money to operate effectively. The setup costs for an airline are huge (airplanes, hangars, flight simulators) and most capital is financed through loans.
Airlines are extremely sensitive to volume of traffic (load factor) and profitability quickly falls off as load factor declines.
The advent of travel websites and other travel distribution channels has led to a substantial increase in discounted and promotional fares.
13
1.2.3. THE ECONOMIC PERFORMANCE OF AIRLINE INDUSTRIES
Air transport is one of the world’s most important industries. Its development and technical service achievements make it one of the major contributors to the advancement of modern societal development. Since the first jet airliner flew in 1949, use of commercial aviation has grown more than seventy-fold (A. Abdelghany and KH. Abdelghany, 2009: 1). The growth in the aviation sector cannot be matched by any other major form of transport due to its technicality and new innovations that is going on in the sector. The above has helped so much in economic and tourist development of the nation and the globe. Demand for air transport services has increased the influence of air transport in the nation and global economy, thereby enhancing rapid movement of passengers, goods and services to the domestic and world market. This in effect helps to generate higher revenue to the economy by way of fast in and out flow of goods and services. The aviation industry plays an important role in the aspect of work and leisure to people around the globe. The sector helps to promote and improve quality of life, living standards of people within the nation. All this helps to generate economic growth and poverty alleviation by way of providing employment opportunities, increasing revenues from taxes. The employment opportunities would be generated through supply chain transformation from the airports. Air transportation is a major industry in its own right and it also provides important inputs into wider economic, political, and social processes. The demand for its services, as with most transport, is a derived one that is driven by the needs and desires to attain some other final objective. Air transport can facilitate, for example, in the economic development of a region or of a particular industry such as tourism, but there has to be a latent demand for the goods and services offered by a region or by an industry. Economies, and the interactions that exist within the globe, domestic and the air transport system, are in a continuous state, although economists’ notions of equilibrium have some very useful intellectual content, and validity in the very short-run. In reality the world is dynamic. This dynamism, of which the particular thrust of globalization, is the concern here to has implications for industries such as air transport that service it. But there are also feedback loops, because developments in air transport can shape the form and the speed at which nations’ development, globalization and related processes take place. The aviation industry is a vital part of the increasingly globalized world economy, facilitating the growth of international trade, tourism and international investment, and connecting people across continents. Air transport is a major contributor to global economic prosperity. It provides the only rapid worldwide transportation network, which makes it essential for global business and tourism and it plays a vital role in facilitating economic growth, particularly in
14
developing countries. Air transport system is fully driven by the global economy; it is an important catalyst to the global economy. International Air Transport Association (IATA) noted that air transport industry worldwide directly generated an estimated 58 million jobs in 2013 (IATA, 2013: 17). The efficiency and quality improvements in air passenger services contribute to the growth in government sectors such as hotel, tourism, etc. The free flow of people and information, together with improved air cargo operations, promote trade and improve the efficiency of the overall economy. That is to say that aviation sector imposes significant positive externalities to other industries, contributing to economic and employment growth to the nation.
Oxford Economics analyzed the economic and social benefits of aviation at a global, regional, and national level in over 50 countries to build a comprehensive picture of many benefits of air transports. ATAG has built on that analysis to tell the story of an air transport system that ensures jobs, trade, connectivity, tourism, and vital lifelines to remote communities.
Air transport facilitates world trade, helping countries participate in the global economy by increasing access to international markets and allowing globalization of production. The total value of goods transported by air represents 35% of all international trade (ATAG, 2014: 4). Aviation is indispensable for tourism, which is a major engine of economic growth, particularly in developing economies. Globally, 52% of international tourists travel by air (ATAG, 2014: 4 aviation benefits beyond borders).
The aviation industry itself is a major direct generator of employment and economic activity in airline and airport operations, aircraft maintenance, air traffic management, head offices and activities directly serving air passengers, such as check-in, baggage handling, on-site retail, cargo and catering facilities. Direct impacts also include the activities of civil aerospace manufacturers selling aircraft and components to airlines and related businesses.
In 2013, aviation’s total global economic impact (direct, indirect, induced and tourism catalytic) is estimated at $2.4 trillion, equivalent to 3.4% of world gross domestic product (GDP) (IATA, 2013: 17). These figures do not include other economic benefits of aviation, such as the jobs or economic activity that occur when companies or industries exist because air travel makes them possible, or the intrinsic value that the speed and connectivity of air travel provides. Nor do they include domestic tourism and trade. Including these would increase the employment and global economic impact numbers several-fold. In fact, if air
15
transport were a country, its GDP would rank it 21st in the world, roughly equal to that of Switzerland and more than twice as large as Chile or Singapore.
ACHIEVING IMPROVED PROFITABILITY
Like other business entities, the airline industry must aim to make a profit. With few exceptions (e.g. cargo airlines), the largest share of their turnover is realized by the transport of passengers.
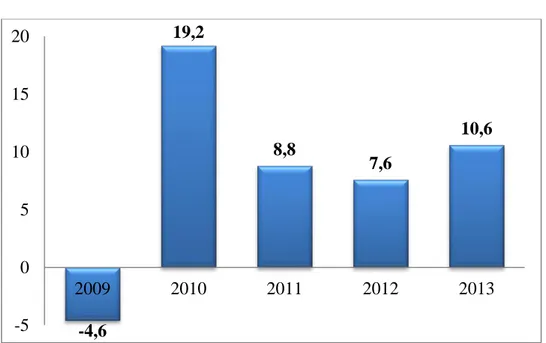
In 2013, airlines saw improved profitability as they continued to claw back ground lost in the global economic recession that began in 2008–2009. Net post tax profit for 2013 was $10.6 billion, a 1.5% margin on revenues. This was the fourth successive year of profitability, and it builds on the $6.1 billion profit (0.9% margin) in 2012. Profitability in 2013 was achieved largely on increased demand, the positive impact on cash flow of industry restructuring, and slightly lower than expected fuel costs. Jet fuel averaged just under $125 a barrel, about $5 less than in 2012. Figure No.2 shows the industry net profits for the last 5 years.
Figure 2: Airline Industry Net Profits (in billions of dollars)
Source: IATA, 2013: 13 and IATA, 2012: 11. -4,6 19,2 8,8 7,6 10,6 -5 0 5 10 15 20 2009 2010 2011 2012 2013
16
1.2.4. WORLD’S TOP AIRLINES – 2014
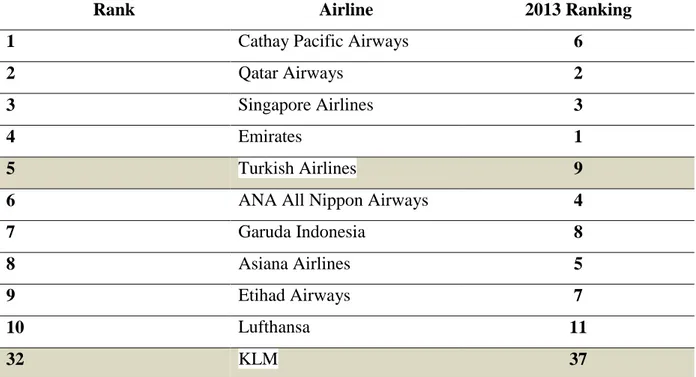
In a gala ceremony at Farnborough International Air show, Skytrax announced the world's Top 100 Airlines in 2014, voted for by airline customers around the world during a 9-month passenger survey. The World’s Best Airline award was decided by the votes of close to 19 million travelers from around the world. The World Airline Awards are coveted Quality accolades for the world airline industry and regarded as a global benchmark of Airline Passenger Satisfaction levels. The Awards are not subscriber based or a profit-driven award programmed, and is referred to as the Passengers Choice Awards for the airline industry. Table 1: World’s Top Airlines – 2014
Rank Airline 2013 Ranking
1 Cathay Pacific Airways 6
2 Qatar Airways 2
3 Singapore Airlines 3
4 Emirates 1
5 Turkish Airlines 9
6 ANA All Nippon Airways 4
7 Garuda Indonesia 8 8 Asiana Airlines 5 9 Etihad Airways 7 10 Lufthansa 11 32 KLM 37 Source: Skytrax, 2014
17
1.3. INFORMATION BACKGROUND OF THE TWO FIRMS TURKISH AIRLINES (THY) AND ROYAL DUTCH AIRLINES (KLM)
Before starting any financial analysis, the two airline companies will be analyzed in the thesis for providing better understanding. In the following paragraphs they will be briefly introduced for the readers.
Turkish Airlines being one of the fastest growing airlines in the world especially in Europe, and KLM being the oldest business airline in the world still operating under its name, they will be selected as studied companies for this thesis.
1.3.1. TURKISH AIRLINES (THY)
Turkish Airlines is the flag carrier and national airline of Turkey that was established in Ankara on May 1933 with only five airplanes under the name “STATE AIRLINES ADMINISTRATION”, as a department of the Ministry of Defense. In 1955, it was reorganized and operated under special legislation which led it to be renamed Türk Hava Yolları A.O. (Turkish Airlines Co.). Over the years, it has continuously expanded its fleet; in 2003, when the airline operated 65 planes (annual repot 2003: 12), a decision was taken to acquire more additional new planes in order to cover the increasing capacity of the company. Since then, Turkish Airlines added new flight destinations and aircrafts to enhance its value. According to the annual report published at the end of 2014, the number of aircraft in the
18
Turkish Airlines fleet was 261 including 9 cargo aircraft, with an average fleet age of 7.2 years. Turkish Airlines’ current expansion process is being governed by its ‘2008-2023 Fleet Projection Program’. In 2013, the Company ordered 117 aircraft from Airbus and 95 aircraft from Boeing which will all be delivered until 2021. With these additions, Turkish Airlines fleet will reach a total of 439 aircraft.
As for the shareholding structure of the Company; 50.88% are held publicly and 49.12% by the Prime Ministry, Privatization Directorate. The registered share capital of the Incorporation is TL 2 billion. The Company has 12 subsidiaries; 3 are directly owned and 9 are joint ventures.
Turkish Airlines, one of the fastest growing airline companies of Europe has put signature to the record by new routes and joined Star Alliance on April 1st, 2008. Turkish Airlines, with fleet consisted of 179 aircraft (passenger and cargo); organize flights to total 191 points including 151 in international and 40 domestic lines. Thus, Turkish Airlines is a member of the Star Alliance network which was established in 1997. As December 2014, the Star Alliance network offers 18,521 daily flights to 1,321 destinations in 193 countries. By becoming a member of Star Alliance, the world’s biggest and most important airline alliance, Turkish Airlines took a major step forward in its strategy of making Turkey the most important junction between Europe and Asia. Passengers from all over the world make their connections conveniently by flying on Turkish Airlines.
In order to keep alive its brand equity, which provides a serious advantage in terms of competition, Turkish Airlines focuses on the investments that support its brand equity such as offering quality, entertainment systems within the aircrafts, comfortable seats, aesthetics and quality of presentation, investments in personnel having high profiles. THY follows the technological innovations and, with its developing and growing fleet, carries out works that also support the training of its employees.
CORPORATE GROWTH
The growth curve of airline companies, operating in advanced markets that are struggling with stagnation and crisis, is fairly static. The growth trouble of European and American airlines are closely related to structural problems rather than difficulties faced in the last couple of years. Aging fleets, high labor costs, increased tax rates are the primary issues in cost management for European and American airlines. All actors in the European Union (EU)
19
market went through hard times beyond comparison. Consolidation or state aids proved to be a life saver for the industry, where many actors stepped out of the market.
In contrast, Turkish aviation market continues to expand with high growth rates since 2003. In the last decade, passenger penetration in the market (total passengers/population ratio) has almost tripled. Still, Turkey remains underpenetrated compared to the more mature markets indicating its growth potential. In 2013, the market has grown by 13.5% more than doubling the global passenger growth of 5.1% (Turkish Airlines). This was a direct result of the increasing infrastructure and fleet investments which led to more affordable ticket prices and increased connectivity. According to the General Directorate of State Airports Authority, Turkish aviation market will grow by 12% reaching 128 million total passengers in 2014.
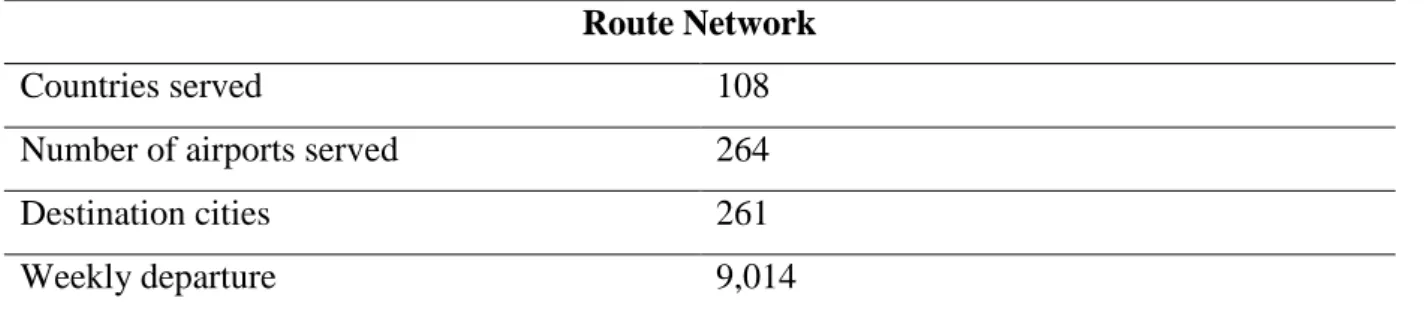
The Company has grown steadily with double-digit growth rates and has transformed into one of the largest global network carriers in the world. Moreover, the carrier managed this growth while maintaining strong profitability, having one of the highest EBITDAR margins in the industry. With the world's 4th largest flight network, Turkish Airlines flies to 218 international destinations in 108 countries (fact sheet 2014). This country coverage is greater than any other airline in the world. The Turkish Airlines flight network extends to a profoundly diversified geography. This fact enables a broad income portfolio for the Company. In addition to Europe, Turkish Airlines has also strategic network expansion into the Russia, Central Asia, Far East Asia, Middle East, Africa and North and South America. Table 2: Route network as of December 2014
Route Network
Countries served 108
Number of airports served 264
Destination cities 261
Weekly departure 9,014
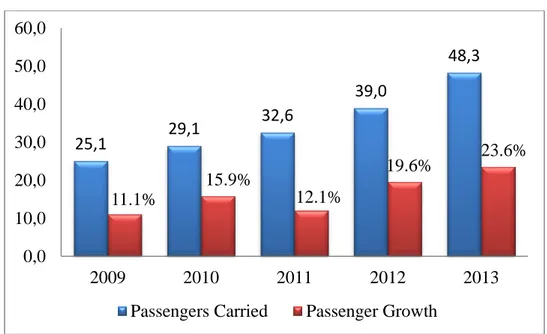
Turkish Airlines, with its young fleet, top quality catering, friendly personnel and high security and safety standards, continued its rapid ascent in 2009 as the top preference by passengers. In 2009, Turkish Airlines was the fastest growing airline company in Europe, growing 11.1% and carrying 25.1 million passengers, while the Association of European Airlines saw average passenger numbers fall by 5.8% and global commerce shrank dramatically. Operating a fleet of 132 aircraft, Turkish Airlines has displayed its business
20
success through its network, charter and Hadj-Umrah operations. Over the previous year the Company has increased 39 million passenger numbers by 23.6% and carried 48.3 million passengers in 2013. The number of passengers increases by 26.1% on the domestic routes and by 21.9% of international routes. According to AEA (Association of European Airlines) data Turkish Airline increased its market share to 12.8% successfully and has taken second place among European carriers as regards to air passenger traffic.
Figure 3: THY passenger growth from 2009 up to 2013. Amounts are in million.
Reference: The above figures were taken from Turkish Airlines’ website AWARDS
Skytrax, the acknowledged name associated with air travel excellence in 21st century by providing unique products to the global aviation industry through professional Audit and Service Benchmarking programs for airlines, airline alliances, airports and related air transport product and service suppliers across the globe, has released its latest ratings. With no outside sponsorship, advertising or influence, it is the most respected global airline passenger survey firm in the industry.
In 2007, Turkish Airlines was ranked as a four star airline by Skytrax. While keeping its 4-star airline title again in 2008, Turkish Airlines was also named “The Best Airline in Southern Europe”. In 2010, Turkish Airlines continued to be the: “Best Airline in Southern Europe”; and “Best Catering in Economy Class” with the in-flight service provided by Turkish Do &Co 25,1 29,1 32,6 39,0 48,3 11.1% 15.9% 12.1% 19.6% 23.6% 0,0 10,0 20,0 30,0 40,0 50,0 60,0 2009 2010 2011 2012 2013
21
In 2011, 2012, 2013 and 2014 four years in a row, Turkish Airlines was chosen as the winner of the two categories by Skytrax Best Airline in Europe and Best Airline in Southern Europe
The 2014 year’s awards were based on the results of over 18 million passenger surveys, with more than 105 nationalities participating and covering 245 airlines. Turkish Airlines has scored a resounding success in the 2014 Skytrax World Airline Awards, with air travelers once again recognizing the airline as the “Best Airline in Europe”, for the fourth year running. 1.3.2. ROYAL DUTCH AIRLINES (KLM)
Koninklijke Luchtvaart Maatschappij N.V. (Royal Dutch Airlines), known by its initials KLM, is the flag carrier airline of the Netherlands which was founded on 7 October, 1919 to serve Netherlands and its colonies. As of 2013, KLM operated scheduled passenger and cargo services to more than 138 destinations worldwide with 114 fleets. It is the oldest airline in the world still operating under its original name.
In the Netherlands, KLM comprises the core of the KLM Group which further includes the wholly-owned subsidiaries KLM Cityhopper, transavia.com and Martinair. KLM is a leader in the airline industry and offers reliable operations and customer-oriented products resulting from its policy of enthusiasm and sustainable innovation.
22
The merger of KLM with Air France in May 2004 formed the Air France-KLM Group, which is incorporated under French law with headquarters at Paris and Amsterdam. Both Air France and KLM continue to fly under their distinct brand names as subsidiaries of the group. Air France and KLM are part of the Sky Team alliance, the second largest in the world behind only Star Alliance. Since May 2004, Air France and KLM Royal Dutch Airlines have become the largest European airline group: one group, two airlines, and three businesses. Each airline has retained its individual identity, trade name and brand. The three core businesses are Passenger Business, Cargo and Engineering & Maintenance. Both airlines run their own operations from their respective hubs Paris-Charles de Gaulle and Amsterdam-Schiphol.
KLM participates in the industry’s leading trans-Atlantic joint venture with Air France, Delta Air Lines and Alitalia. With approximately 250 daily trans-Atlantic flights and a fleet of around 150 aircraft, the joint venture between AIR FRANCE-KLM, Alitalia and Delta Air Lines provides customers with the benefits of a vast route network offering more frequent flights, competitive fares and harmonized services on all trans-Atlantic flights.
CORPORATE GROWTH
When KLM merged with Air France in 2004, its share in the international market also grew, which was certainly due in part to the high quality of the airport at Schiphol. Despite the crisis years of 2008 and 2009, which subdued growth in the international airline industry and also affect the growth of KLM, demand for air transportation is now increasing worldwide. KLM wants to continue to play its part in this development and, with Air France and its SkyTeam partners, to continue to be a global player. The growth in demand is demonstrated by the recent increase in air transportation to China, Taiwan and Hong Kong. AIR FRANCE KLM is Europe’s largest provider of air transportation in this sector. It is vital for this growth to be accommodated at KLM’s home base Schiphol, because, as in any other sector, stagnation would mean the irretrievable loss of market share. The competition is ferocious.
Guided by the economic importance and tourist potential of a region, KLM is permanently seeking destinations that contribute to its results. As the company reported its 2014 annual report, KLM welcomes more than 70,000 passengers, carries 3,000 tons of cargo and completes more than 700 flights every day. KLM serves 135 destinations from Schiphol, and the Cooperation with KLM’s partners adds a further 40 destinations. Of these 175 destinations in total, 96 are located in Europe and 79 on other continents. AIR FRANCE
23
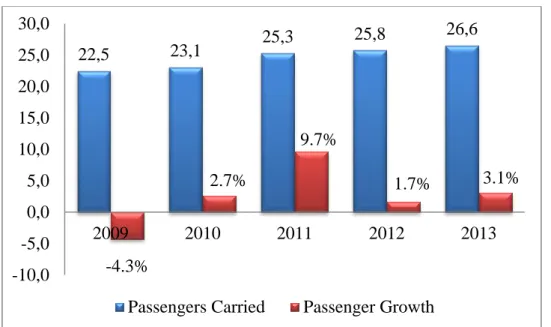
KLM and joint venture partner Delta Air Lines together offer more destinations worldwide than any other airline groups. A five years ago, in the fiscal year 2009, KLM and its partners Operated 151 destinations.
Figure 4: KLM passenger growth from 2009 up to 2013. Amounts are in million.
Reference: Figures were taken from annual and public reports of KLM
22,5 23,1 25,3 25,8 26,6 -4.3% 2.7% 9.7% 1.7% 3.1% -10,0 -5,0 0,0 5,0 10,0 15,0 20,0 25,0 30,0 2009 2010 2011 2012 2013
24
CHAPTER TWO: FINANCIAL ANALYSIS AS A VEHICLE OF FIRM’S VALUATION
2.1. THE ROLE OF FINANCIAL ANALYSIS IN INFORMATIONAL SUPPORT Financial analysis is the process of identifying the financial strength and weaknesses of the firm by properly establishing relationship between the items of the balance sheet and the income statement (Pandey, 2009: 518). The information pertaining to the financial statements is of great importance through which interpretation and analysis is made. It is through the process of financial analysis that the key performance indicators, such as, liquidity, solvency,
and profitability as well as the efficiency of operations of a business entity may be
ascertained, while short term and long term prospects of a business may be evaluated. Thus, identifying the weakness, the intent is to arrive at recommendations as well as forecasts for the future of a business entity. Financial analysis focuses on the financial statements, as they are a disclosure of a financial performance of a business entity. A Financial Statement is an organized collection of data according to logical and consistent accounting procedures. Its purpose is to convey an understanding of some financial aspects of a business firm. It may show assets position at a moment of time as in the case of balance sheet, or may reveal a series of activities over a given period of times, as in the case of an income statement.
Since there is recurring need to evaluate the past performance, present financial position, the position of liquidity and to assist in forecasting the future prospects of the organization, various financial statements are to be examined in order that the forecast on the earnings may be made and the progress of the company are ascertained. It must be noted that financial analysis is a continuous process being applicable to every business to evaluate its past performance and current financial position. It is useful in various situations to provide managers the information that is needed for critical decisions. The process of financial analysis provides the information about the ability of a business entity to earn income while sustaining both short term and long term growth.
Analysis of financial statements is of interest to lenders, security analysts, managers and others (Chandra, 1995: 172). Trade creditors are interested in the firm’s ability to meet their claims. Their analysis will therefore, confine to the evaluation of the firm’s liquidity position. The suppliers are concerned with the firm’s solvency and survival. They analyze the firm’s profitability over time. Long term creditors place more emphasis on the firm’s solvency and profitability. The investors are more concerned about the firm’s earnings. So they concentrate on the analysis of the firm’s present and future profitability as well all earning ability and risk
25
(Sina and Matubber, 1998: 179 – 189). Financial analysis helps these various parties which interest in a company’s activities to obtain financial information required to them. The main purpose of financial analysis is to estimate current financial conditions and define actions necessary to conduct work on improvement or preserving of these conditions. Financial analysis also summarizes a firm’s business activities in the past, at present and in the near future. Its main function is to identify financial performance of a company, reveal weaknesses, potential sources of problem occurrence in its further plans and to find out strengths on which the firm can rely. Financial performance of a company, being one of the major business characteristics, defines competitiveness, potential of the business, economic interests of the company's management and reliability of present or future contractors. Therefore, the secondary goal of analysis is to reveal financial condition of the company to external users.
2.1.1. MAIN TYPES OF FINANCIAL ANALYSIS
Financial statements give complete information about assets, liabilities, equity, reserves, expenses and profit and loss of an enterprise. They are not readily understandable to interested parties like creditors, shareholders, investors etc. Thus, various techniques are employed for analyzing and interpreting the financial statements. They are briefly mentioned herein.
A. On the basis of material used. 1. External Analysis
Analysis of financial statements may be carried out on the basis of published information. i.e., information made available in the annual report of the enterprise. Such analyses are usually carried out by those who do not have access to the detailed accounting records of the company i.e., Banks, Creditors, etc. An external analyst does not have access to internal financial data and, hence, has to carry out so-called external financial analysis, when initiative does not belong to a company’s management, but to a third party. The defining a credit worthiness and investment possibilities by an investor, may serve purposes of an external financial analysis. In similar way, financial liquidity or solvency can be of interest for a bank. To make a better decision, potential business partners wish to know maximum available information about a firm and amount of risk involved in respect of investments profitability and possible gains and losses. External financial analysis is based on published accounting statements and aimed on prediction of a possible bankruptcy, assessment of business performance and financial sustainability of a company.
26
2. Internal Analysis
Analysis may also be based on detailed information available within the company which is not available to the outsiders; such analysis is called internal analysis. This type of analysis is of a detailed one and is carried out on behalf of the management for the purpose of providing necessary information for decision making, such analysis emphasizes on the performance appraisal and assessing the profitability of different activities. Internal financial analysis (also known as managerial financial analysis) is necessary for meeting the own requirements of a company. It is aimed on determination of liquidity or results estimation of a last fiscal period. Usually the output of internal analysis is a set of administrative decisions combination of various measures intended for optimization of certain issue within the business. The internal analysis is typically performed inside a company by its financial department and constantly revised because of changes in macro and microeconomic environment. Due to the nature of data sources using for the internal analysis (internal accounting books and reports), its results are always precise. This thesis will focus on conducting external analysis and further mentioning of “financial analysis” in the text will mean only “external financial analysis”
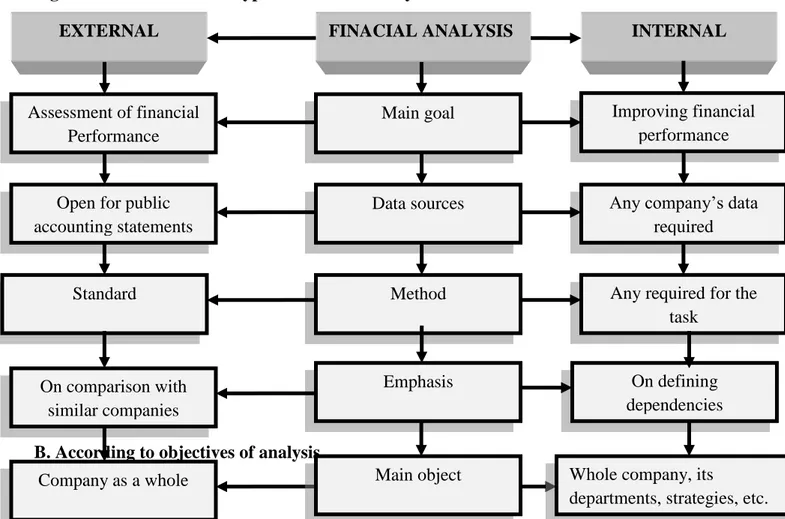
Figure 5: Classification of types of financial analysis
B. According to objectives of analysis 1. Short Term Analysis
EXTERNAL FINACIAL ANALYSIS INTERNAL
Assessment of financial Performance
Main goal Improving financial
performance
Open for public accounting statements
Data sources Any company’s data
required
Standard Method
On comparison with similar companies
Any required for the task
Emphasis On defining
dependencies
Company as a whole Main object Whole company, its
27
Short term analysis is mainly concerned with the working capital analysis. In the short run, a company must have ample funds readily available to meet its current needs and sufficient borrowing capacity to meet the contingencies. In short term analysis the current assets and current liabilities are analyzed and liquidity is determined.
2. Long Term Analysis
In the long term a company must earn a minimum amount sufficient to maintain a reasonable rate of return on the investment to provide for the necessary growth and development of the company, and to meet the cost of capital. Financial planning is also desirable for the continued success of a company, thus in the long term analysis the stability and the earning potentiality of the company is analyzed example, fixed assets, long term debt structure and the ownership interest is analyzed.
C. According to the Methods of analysis
Financial statement analysis should focus primarily on isolating information useful for making a particular decision. The information required can take many forms but usually involves comparisons, such as comparing changes in the same item for the same company over a number of years, comparing key relationships within the same year, or comparing the operations of several different companies in the same industry (Edmonds et al., 2012: 676 – 681). Correct application of financial analysis allows answering many questions concerning “financial health” of a business. This section discusses three categories of analysis methods: horizontal, vertical, and ratio analysis.
Financial analysis has its specific set of tools along with particular way of their application that defines methodology of the analysis. Main objectives of financial analysis specify spheres of finances where its methods suit best. The main objectives of financial analysis are:
Making “snapshot” of financial efficiency of a company at a moment of research;
Revealing tendencies and patterns in a company’s development for a period;
Defining weaknesses that negatively influence financial performance;
Revealing reserves which a company can use for improvement of its financial situation;