GLAUCOMA
Optic nerve head microvascular changes
after phacoemulsification surgery
Müjdat Karabulut1 &Sinem Karabulut1&Sabahattin Sül1&Aylin Karalezli1
Received: 16 April 2019 / Revised: 27 August 2019 / Accepted: 7 September 2019 # Springer-Verlag GmbH Germany, part of Springer Nature 2019
Abstract
Background To determine optic nerve head (ONH) microvascular changes detected by optical coherence tomography angiog-raphy (OCTA) and intraocular pressure changes (IOPs) after uncomplicated phacoemulsification surgery.
Methods The study was designed as a prospective observational study. Twenty-four eyes were included. Eyes with retinal vascular pathology, any type of age-related macular degeneration, IOP more than 21 mmHg, axial length less than 20 mm and more than 24 mm, corneal edema and cataracts that can disrupt images, and history of ocular surgery were excluded. Patients underwent OCTA imaging and IOP measurement preoperatively (baseline) and postoperatively (weeks 1 and 4). Vessel density % (VD) in the total disc, peripapillary, and inside disc were measured. IOP was measured with the applanation tonometer. Comparison of VD and IOP and correlation between VD andİOP change were determined.
Results VD was significantly increased in all quadrants in week 4 compared to those in week 1. In terms of VD and IOP, although there was no significant difference between week 1 and baseline, week 4 results were significantly different from baseline (p < 0.05 and p < 0.001, respectively). The IOP was significantly lower in week 4 (14.8 mmHg) than in week 1 (16.0 mmHg) (p < 0.001). There was a significant negative correlation between the inside disc and total VD and IOP at weeks 1 and 4. Conclusion Phacoemulsification surgery can result in a decrease in IOP and an increase in VD of the ONH.
Keywords Optical coherence tomography angiography . Intraocular pressure phacoemulsification . Vessel density
Introduction
Phacoemulsification is a cataract surgery technique that is fre-quently used and has very successful visual results. After cat-aract surgery, some changes in ocular hemodynamics and IOP have been reported in various studies [1,2].
OCTA is a non-invasive and highly repeatable imaging technique that can show the peripapillary microvascular structure [3,4].
This study aims to evaluate changes in the IOP and the VD of the optic nerve head after uncomplicated phacoemulsification surgery and to evaluate the correlation between them.
Method
This study was designed as a prospective study. Twenty-four eyes from 24 patients who underwent uncomplicated phacoemulsification and intraocular lens (IOL) implantation surgery were included in the study. Maculopathies (hereditary or acquired), optic nerve head pathologies (tilted disc, drusen, optic disc edema, atrophy, etc.), optic neuropathies (demyelin-ating, infectious, ischemic, etc.), adjusted IOP for central cor-neal thickness more than 21 mmHg, axial length less than 20 mm and more than 24 mm, surgery-induced corneal edema and massive cataracts that can disrupt images, history of va-soactive agents (calcium antagonists, nitric oxide, etc.) use, systemic diseases (vasculitis, diabetes mellitus, hypertension, etc.) and any ocular surgery, complicated phacoemulsification surgeries, and images with motion or cataract-originated arti-facts (signal strength index less than 60) were excluded. Full ophthalmologic examination and OCTA imaging were per-formed before (baseline) and after surgery (weeks 1 and 4). Imaging was performed using an RTVue-XR Avanti (Optovue, Inc., Fremont, CA, USA). Total, peripapillary, This is to certify that the article has not been presented in a meeting
* Müjdat Karabulut
1
Department of Ophthalmology, Mugla Sıtkı Koçman University Medical School, Mugla, Turkey
/ Published online: 16 September 2019
Check for updates
and inside disc VD was measured using a 4.5 × 4.5-mm scan that was centered on the ONH (Fig.1). IOP was measured using applanation tonometry. Results from baseline, week 1, and week 4 were compared. The correlation between IOP and VD changes was evaluated. Data were analyzed using SPSS version 22.0.0.0 software (IBM Corporation and other(s)). Comparisons were performed using a pairedt test, and corre-lations between the IOP and VD change were determined using the Pearson correlation coefficient (PCC). Statistical significance was defined asp < 0.05.
This study was approved by the Muğla Sıtkı Koçman University Clinical Research Ethics Committee. (decision number 08/VIII date 31/05/2018).
Results
All the patients had grade 2 nuclear sclerosis. The standard phacoemulsification procedure was done using the Alcon CENTURION®Vision System (Alcon Laboratories Inc.) by a single surgeon. A clear, ultraviolet-absorbing, acrylate/ methacrylate copolymer single-piece IOL (Alcon AcrySof® single-piece SA60AT, Alcon Laboratories Inc.) was implanted within the capsular bag. The mean objective surgical time was 14.7 ± 5 min. The mean age was 65.4 years (range, 60– 70 years). Eighteen male (81.8%) and four female (18.2%) patients were included in the study. The mean axial length was 23 ± 0.6 mm. Total, peripapillary, inside disc VD of ONH, andİOP results are shown in Table1. VD was signif-icantly increased in all quadrants in week 4 compared to week
1 (Table1). Moreover, the mean IOP was significantly lower in week 4 (14.8 mmHg) compared with week 1 (16.0 mmHg; p < 0.001; Table1). Figure2 is showing dynamics of IOP before and after surgery. For VD and IOP, although there was no significant difference between week 1 and baseline, week 4 results were significantly different from baseline (p < 0.05 and p < 0.001, respectively; Tables2and3). There was also a negative correlation between the inside disc and total VD and IOP at weeks 1 and 4 (Table4). Both superficial and deep retinal plexus VD were also increased in foveal, parafoveal, and perifoveal quadrants on a 6.00 × 6.00-mm macular-centered imaging.
Discussion
The optic nerve head and retinal blood flow depend on the balance between arterial blood pressure and IOP. Although retinal blood flow is not significantly affected because of ret-inal autoregulation in moderate increases in the IOP, it can be inhibited completely at supra systolic IOP levels [5,6].
Several methods have been described to measure optic nerve head perfusion [7–9]. The ocular pulse amplitude (OPA) is defined as the difference between diastolic and sys-tolic IOP. Pulsatile ocular blood flow in the choroid generates the ocular pulse, showing the choroidal blood flow indirectly, but not retinal blood flow [10,11]. Color Doppler ultrasound can show retrobulbar vascular circulation but not ocular mi-crocirculation [12].
Angiography can only show circulation in the superficial layers but not in the deep layers. Additionally, it is an invasive procedure and has an anaphylaxis risk [13].
The laser doppler flowmeter can detect microcirculation in a limited retinal area, and laser speckle flowgraphy can dis-play only the flow rate [14,15].
A scanning laser Doppler flowmeter can show only super-ficial vascularization of the optic nerve head and retina [16]. Magnetic resonance imaging cannot show the microvascular structures in the optic nerve head and retina because of Fig. 1 Angio-ONH (total, peripapillary, and inside disc) in a 4.5 ×
4.5-mm scan size
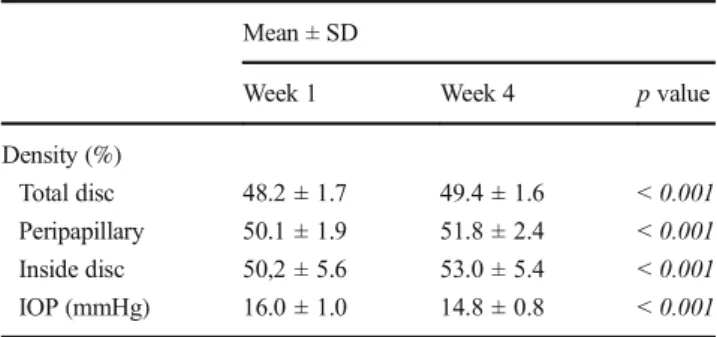
Table 1 Comparison of VD and IOP postoperatively Mean ± SD
Week 1 Week 4 p value
Density (%)
Total disc 48.2 ± 1.7 49.4 ± 1.6 < 0.001
Peripapillary 50.1 ± 1.9 51.8 ± 2.4 < 0.001
Inside disc 50,2 ± 5.6 53.0 ± 5.4 < 0.001
IOP (mmHg) 16.0 ± 1.0 14.8 ± 0.8 < 0.001
insufficient resolution [17]. Doppler Fourier domain OCT (Doppler FD-OCT) can show only large vessels but not microvascularization, and images are mostly affected by eye movements [18].
OCTA is a new, non-invasive imaging technique that uses motion contrast imaging to obtain high-resolution volumetric blood flow information and generate angiographic images in a matter of seconds. A split-spectrum amplitude-decorrelation angiography (SSADA) algorithm can be used to display local microcirculation. SSADA can measure both transverse and axial flow with the same sensitivity [19].
In many studies, the effects of cataract and cataract surgery on ocular hemodynamics have been reported. Hilton et al. found that OPA was lower in eyes with a cataract compared to healthy eyes, and it increased after surgery and correlated with IOP [2]. Similarly, Hopkins et al. reported that OPA was 20–30% lower in eyes with a cataract [20].
However, some studies showed no changes in ocular he-modynamics after cataract surgery. In these studies, Doppler USG which can only image substantial vascularization despite microvascular changes was used [21–23].
OCTA is a novel imaging technique, and very few reports about vascular changes after cataract surgery have been pub-lished. Studies with OCTA showed significantly increased
macular VD after cataract surgery [24]. However, in this study, only macular vascular changes were evaluated, not ONH vascularization.
In this study, VD was increased in all quadrants postoper-atively. Although the VD increased dramatically in week 4 compared to baseline and week 1, the baseline and week 1 results were not significantly different compared to each other. Although the exact mechanism remains unclear, the reduc-tion in IOP after cataract surgery probably results from indi-rect factors that may contribute to facilitating aqueous humor drainage. An increase in the depth of the anterior chamber and the release of prostaglandin F-2 may facilitate drainage through the trabecular meshwork [25–27]. Additionally, an IOL placement, which increases the mechanical tension in the zonation region, may reduce the aqueous humor drainage resistance by expanding the trabecular meshwork space [27,
28]. In this study, the mean IOP decreased postoperatively. Although the mean IOP was significantly reduced in week 4 compared to baseline and week 1, there was no difference in the mean baseline and week 1 IOP results.
The effect of a change in IOP on ocular hemodynamics has been shown in many studies. Hilton et al. reported a negative correlation between OPA and IOP after cataract surgery [2].
17 16 14.8 13.5 14 14.5 15 15.5 16 16.5 17 17.5
Baseline Week 1 Week 4
Mean
IOP (m
mHg)
Time Line of Mean IOP Change
Fig. 2 Dynamics of IOP before and after surgery
Table 2 Comparison of VD and IOP at baseline and week 1 Mean ± SD
Baseline Week 1 p value
Density(%)
Total disc 47.8 ± 1.8 48.2 ± 1.7 0.377
Peripapillary 49.5 ± 1.9 50.1 ± 1.9 0.544
Inside disc 49,3 ± 5.3 50,2 ± 5.6 0.300
IOP (mmHg) 17.0 ± 1.2 16.0 ± 1.0 0.150
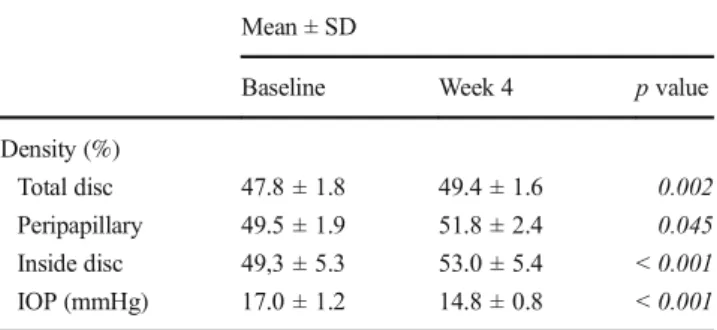
Table 3 Comparison of VD and IOP at baseline and week 4 Mean ± SD
Baseline Week 4 p value
Density (%)
Total disc 47.8 ± 1.8 49.4 ± 1.6 0.002
Peripapillary 49.5 ± 1.9 51.8 ± 2.4 0.045
Inside disc 49,3 ± 5.3 53.0 ± 5.4 < 0.001
IOP (mmHg) 17.0 ± 1.2 14.8 ± 0.8 < 0.001
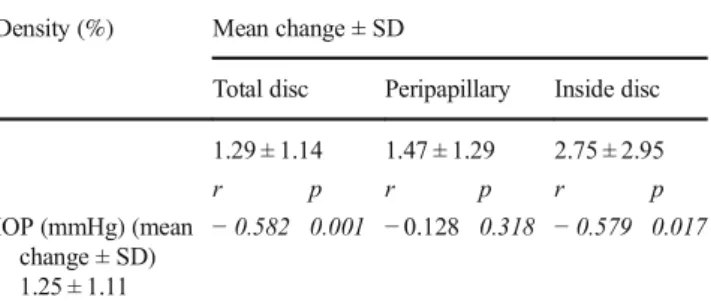
Zhao et al. reported that an increase in retinal vascular density might be associated with a decreased IOP. Similarly, we found a strong negative correlation between IOP and total VD and inside disc VD, but not peripapillary VD, postop-eratively (r =− 0.582, p = 0.001; r = − 0.579, p = 0.017; r = − 0.128, p = 0.318, respectively). We thought these could be caused by the peripapillary blood supply and retinal vascular autoregulation that maintains an adequate blood supply in this area.
In conclusion, in this prospective study, we found a pro-gressive increase in VD in ONH quadrants, except for the peripapillary area, and a decrease in IOP after cataract surgery. Additionally, there was a negative correlation between VD and IOP in the week 1 and 4 results. Novel imaging modalities such as OCTA will be useful to better explain the effect of cataract surgery on ocular hemodynamics. More reliable re-sults can be obtained with a larger number of patients and longer postoperative follow-up.
Compliance with ethical standards
Conflict of interest The authors declare that there is no conflict of interest.
Ethical approval All procedures performed in studies involving human participants were in accordance with the ethical standards of the (place name of institution and/or national research committee) and with the 1964 Helsinki declaration and its later amendments or comparable ethical standards.
Informed consent Informed consent was obtained from all individual participants included in the study.
References
1. Melancia D, Abegao Pinto L, Marques-Neves C (2015) Cataract surgery and intraocular pressure. Ophthalmic Res 53:141–148.
https://doi.org/10.1159/000377635
2. Hilton EJ, Hosking SL, Gherghel D, Embleton S, Cunliffe IA (2005) Beneficial effects of small-incision cataract surgery in
patients demonstrating reduced ocular blood flow characteristics. Eye (London, England) 19:670–675.https://doi.org/10.1038/sj. eye.6701620
3. Wylegala A, Teper S, Dobrowolski D, Wylegala E (2016) Optical coherence angiography: a review. Medicine 95:e4907.https://doi. org/10.1097/md.0000000000004907
4. Spaide RF, Fujimoto JG, Waheed NK, Sadda SR, Staurenghi G (2018) Optical coherence tomography angiography. Prog Retin Eye Res 64:1–55.https://doi.org/10.1016/j.preteyeres.2017.11.003
5. Schmidl D, Boltz A, Kaya S, Werkmeister R, Dragostinoff N, Lasta M, Polska E, Garhofer G, Schmetterer L (2012) Comparison of choroidal and optic nerve head blood flow regulation during chang-es in ocular perfusion prchang-essure. Invchang-est Ophthalmol Vis Sci 53: 4337–4346.https://doi.org/10.1167/iovs.11-9055
6. Guidoboni G, Harris A, Cassani S, Arciero J, Siesky B, Amireskandari A, Tobe L, Egan P, Januleviciene I, Park J (2014) Intraocular pressure, blood pressure, and retinal blood flow auto-regulation: a mathematical model to clarify their relationship and clinical relevance. Invest Ophthalmol Vis Sci 55:4105–4118.
https://doi.org/10.1167/iovs.13-13611
7. Flammer J, Orgul S, Costa VP, Orzalesi N, Krieglstein GK, Serra LM, Renard JP, Stefansson E (2002) The impact of ocular blood flow in glaucoma. Prog Retin Eye Res 21:359–393
8. Shiose Y, Kitazawa Y, Tsukahara S, Akamatsu T, Mizokami K, Futa R, Katsushima H, Kosaki H (1991) Epidemiology of glaucoma in Japan–a nationwide glaucoma survey. Jpn J Ophthalmol 35:133– 155
9. Flammer J, Orgul S (1998) Optic nerve blood-flow abnormalities in glaucoma. Prog Retin Eye Res 17:267–289
10. Langham ME, Farrell RA, O'Brien V, Silver DM, Schilder P (1989) Blood flow in the human eye. Acta ophthalmol Suppl 191:9–13 11. Pekel G, Acer S, Cetin EN, Yagci R, Kasikci A, Cevik A (2015)
Ocular pulse amplitude and retinal vessel caliber changes after in-travitreal ranibizumab. Int Ophthalmol 35:657–662.https://doi.org/ 10.1007/s10792-014-9991-z
12. Matthiessen ET, Zeitz O, Richard G, Klemm M (2004) Reproducibility of blood flow velocity measurements using colour decoded Doppler imaging. Eye (London, England) 18:400–405.
https://doi.org/10.1038/sj.eye.6700651
13. Hayreh SS (1972) Colour and fluorescence of the optic disc. Ophthalmologica 165:100–108. https://doi.org/10.1159/ 000308475
14. Riva CE (2001) Basic principles of laser Doppler flowmetry and application to the ocular circulation. Int Ophthalmol 23:183–189 15. Sugiyama T, Araie M, Riva CE, Schmetterer L, Orgul S (2010) Use
of laser speckle flowgraphy in ocular blood flow research. Acta Ophthalmol 88:723–729.https://doi.org/10.1111/j.1755-3768. 2009.01586.x
16. Sehi M (2011) Basic technique and anatomically imposed limita-tions of confocal scanning laser Doppler flowmetry at the optic nerve head level. Acta Ophthalmol 89:e1–e11.https://doi.org/10. 1111/j.1755-3768.2009.01728.x
17. Prunte C, Flammer J, Markstein R, Rudin M (1995) Quantification of optic nerve blood flow changes using magnetic resonance imag-ing. Invest Ophthalmol Vis Sci 36:247–251
18. Wang Y, Bower BA, Izatt JA, Tan O, Huang D (2008) Retinal blood flow measurement by circumpapillary Fourier domain Doppler op-tical coherence tomography. J Biomed Opt 13:064003.https://doi. org/10.1117/1.2998480
19. Jia Y, Tan O, Tokayer J, Potsaid B, Wang Y, Liu JJ, Kraus MF, Subhash H, Fujimoto JG, Hornegger J, Huang D (2012) Split-spectrum amplitude-decorrelation angiography with optical coher-ence tomography. Opt Express 20:4710–4725.https://doi.org/10. 1364/oe.20.004710
20. Hopkins SD (1989) Ocular haemodynamics in cataractous eyes. A pilot study. Acta ophthalmol Suppl 191:43–48
Table 4 The mean increase in VD and decrease in IOP at week 1 and week 4, correlation between VD and IOP
Density (%) Mean change ± SD
Total disc Peripapillary Inside disc 1.29 ± 1.14 1.47 ± 1.29 2.75 ± 2.95 r p r p r p IOP (mmHg) (mean change ± SD) 1.25 ± 1.11 − 0.582 0.001 − 0.128 0.318 − 0.579 0.017
p p value, r Pearson’s r correlation
21. ALP MN, DOĞAN B, TOLA M, YARANGÜMELİ A, ÖLÇER T, KURAL G (2004) Effect of cataract surgery on orbital blood flow in diabetic patients with nonproliferative retinopathy. Journal of Retina-Vitreous 12:189–194
22. Turk A, Mollamehmetoglu S, Imamoglu HI, Kola M, Erdol H, Akyol N (2013) Effects of phacoemulsification surgery on ocular hemodynamics. Int J Ophthalmol 6:537
23. Rainer G, Kiss B, Dallinger S, Menapace R, Findl O, Schmetterer K, Georgopoulos M, Schmetterer L (1999) Effect of small incision cataract surgery on ocular blood flow in cataract patients1. J Cataract Refract Surg 25:964–968
24. Zhao Z, Wen W, Jiang C, Lu Y (2018) Changes in macular vascu-lature after uncomplicated phacoemulsification surgery: optical co-herence tomography angiography study. J Cataract Refract Surg 44: 453–458.https://doi.org/10.1016/j.jcrs.2018.02.014
25. Mathalone N, Hyams M, Neiman S, Buckman G, Hod Y, Geyer O (2005) Long-term intraocular pressure control after clear corneal
phacoemulsification in glaucoma patients. J Cataract Refract Surg 31:479–483.https://doi.org/10.1016/j.jcrs.2004.06.046
26. Poley BJ, Lindstrom RL, Samuelson TW (2008) Long-term effects of phacoemulsification with intraocular lens implantation in normo-tensive and ocular hypernormo-tensive eyes. J Cataract Refract Surg 34: 735–742.https://doi.org/10.1016/j.jcrs.2007.12.045
27. Shrivastava A, Singh K (2010) The effect of cataract extraction on intraocular pressure. Curr Opin Ophthalmol 21:118–122.https:// doi.org/10.1097/ICU.0b013e3283360ac3
28. Shingleton BJ, Pasternack JJ, Hung JW, O'Donoghue MW (2006) Three and five year changes in intraocular pressures after clear corneal phacoemulsification in open angle glaucoma patients, glau-coma suspects, and normal patients. J Glauglau-coma 15:494–498.
https://doi.org/10.1097/01.ijg.0000212294.31411.92
Publisher’s note Springer Nature remains neutral with regard to jurisdictional claims in published maps and institutional affiliations.