Journal of Science and Technology
1 (1), 2007, 43-57
©BEYKENT UNIVERSITY
STRUCTURAL ENGINEERING APPLICATIONS
OF ARTIFICIAL NEURAL NETWORKS
Muhiddin BAĞCI Gökhan ALTINTAŞ
[email protected] [email protected]
Celal Bayar University, 45140 , Manisa, TURKEY
ABSTRACT
In this study, infilled planar frames and confined reinforced concrete section have been analysed using Artificial Neural Network (ANN). ANN architecture was chosen in which multi layer, feed forward, and back propaga-tion algorithm was used. The training data of infill frame used were provided by a finite element model in which non-linearity of materials and the structural interface were taken into account under increasing lateral load. Using the proposed analytical model (layered model) were generated the training data for confined reinforced concrete section. Analytical technique uses realistic mate-rial models for confined and unconfined concrete. After completing the training phase, verification of the performance of the network was carried out using old (included in training phase) and new (not included in training phase) patterns. The controls conducted in the test phase. The findings of this exercise show that the ANN algorithm can be successfully and easily used within rea-sonable accuracy in order to decrease computational time in finding infill frame and the moment-curvature relationships of reinforced concrete sections. Key words: Artificial Neural Network, Finite Elements Method, Infilled Frame, Confined Reinforced Concrete Section, Moment-Curvature.
ÖZET
Bu çalışmada, Yapay Sinir Ağları (ANN) kullanılarak dolgulu çerçeveler ve sargılı beton kesitlerin analizi yapılmıştır. ANN mimarisi için çok tabakalı ileri beslemeli geri yayılımlı algoritma kullanılmıştır. Dolgu duvarlı çerçeve eğitim verileri elde edilirken ara yüzey ve malzeme bakımından doğrusal olmayan etkilerin de dikkate alındığı sonlu elemanlar yöntemi kullanılmıştır. Sargılı beton kesitlerde önerilen analitik model (tabakalı yaklaşım) kullanılarak eğitim seti oluşturulmuştur. Analitik tekniklerde sargılı ve sargısız betonun dikkate alındığı daha gerçekçi malzeme modelleri kullanılmıştır. Eğitim seti oluşturulduktan sonra, ağ performansının kullanılan veya yeni verilerle yakınsama işlemi gerçekleştirilmiştir. Kontroller yapılan test işlemleriyle gerçeklenmiştir. Bu çalışma bulguları, Yapay Sinir
Ağı algoritmalarının başarılı ve kolay bir şekilde, hesap zamanını da azaltarak, dolgulu çerçeve ve betonarme kesitlerin moment-eğrilik hesabında kullanılabileceğini göstermektedir.
Anahtar kelimeler: Yapay Sinir ağları, sonlu elemanlar yöntemi, dolgulu çerçeve , sargılı betonarme kesit, moment -eğrilik.
1. INTRODUCTION
The mathematical models have been widely applied for the analysis of infilled frame. Holmes M (1) modelled the infill effect occurring in an infilled frame without considering the effects on the interface between frame and in-fill. In studies conducted by Smith BS (2), the approach of diagonal compres-sion strut was dealt with in a more detailed way. Using a finite element model, Mallick DV and Severn RT (3) attained the results without considering the shear effect on the infill frame interface. With a program they prepared, Loo YC and Young Y (4), conducted a linear analysis of the infilled arches in terms of material used. Using a nonlinear finite elements method, Liauw TC and Kwan KH (5) examined a frame with multibay and one-storey. Infilled planar frames have been analysed using artificial neural network by Bağcı and Altintaş (6). The layered model for confined reinforced sections was first used by Pavriz et al (7). Moment-curvature relationships of confined concrete sec-tions were investigated by Ersoy U and Özcebe G (8). The generalized delta rule algorithm of artificial neural networks is employed to predict the flexural behavior of Steel Fibre Reinforced Concrete (SFRC) T-beams using a com-puter program developed in C++, Patodi SC and Purani VS (9). For some other examples of ANN applications, the reader is referred to (Jadid M N and Fairbairn DR (10), Berke L and Hajela P (11), Lee et al (12), Avdelas et al (13), Abdalla and Stavroulakis (14); Karlık et al (15).
In this study, the stiffness, moment and shear force values on frame for five different height of infill wall are calculated using finite elements method (FEM). The behavior values of confined reinforced concrete sections sub-jected to flexure and axial load are obtained by using analytical solution (lay-ered model). The calculated key values are used in training a multi-layer, feed forward, back propagation artificial neural network (ANN). The outcomes of training phase were then tested using the data set reserved for this the network purpose. The findings of this exercise have shown that the ANN algorithm can be successfully and easily used within reasonable accuracy in order to de-crease computational time in infilled frame and confined section problems.
2. ARTIFICIAL NEURAL NETWORKS APPROACH
An alternative to the conventional numerical techniques is presented in this section by employing an artificial neural network algorithm, computa-tional time is drastically reduced compared to the convencomputa-tional numerical techniques. ANN's are capable of self-organization and knowledge learning. Ability to perform tasks involving nonlinear relationships and noise-immunity make ANN a good candidate for classification and prediction.
The ANN system is applied with multi-layer perception, feed forward, back propagation algorithm by supervised training. Back-propagation is a time consuming algorithm. The processing units are arranged in layers. Each ANN has an input layer, number of hidden layers and an output layer. The input vector representing the pattern to be recognized is incident on the input layer and distributed to subsequent hidden layers and finally to the output layer via weighted connections. The pattern of connectivity and the number of process-ing units in each layer may vary with some constraints. No communication is permitted between the processing units in a higher layer. At the forward feed-ing phase, neurones at the input layer transfer the data values directly to the hidden layer. Each neuron in the network operates by taking the sum of its weighted inputs and passing the result through a nonlinear activation function (transfer function). Generally, the sigmoid function is chosen as the nonlinear activation function.
3. PARAMETRIC STUDIES
Dimensions of infilled frame given by Fiorato AC and Sözen M (17) in Fig. 1 are shown, and the materials properties are listed in Tab. 1. The lateral load (P) was applied at the top left hand corner of the frame in Fig. 1a in 20 increments of 10 kN each.
PCtN)
b
a-a cross-section
b-b cross-scction
Table 1. Properties of material
Modulus of elastic- Compression Tension Strength Poisson
ity Strength (kN/m2) Ratio
(kN/m2) (kN/m2)
Frame 2.85x10⁷ 3.1x10⁴ 3x10³ 0.2
Infill 1.7x10⁷ 3.1x10⁴ 2.8x10³ 0.2
The wall was modelled mesh of quadrilateral-shaped isoparametric plane stress elements as shown in Figure 1b. The results of a numerical study are given in Tab. 2, with respect to whether the infill fills the space among the frame. Infill height is a h with a being ranging from 0 and 1 (a=1, a=0.8, a=0.6, a=0.4, a=0.2 and bare).
Table 2. Results of FEM
Infill Load-P Stiffness Left column Left column Infill Load-P Stiffness Left column Left col-height (kN) (infill / no infill) shear force / lateral load moment (Infill / no infill) heig ht (kN) (infill / no infill) shear force /lateral load umn Mo-ment (Infill / no infill) h 10 5,65700 0,19000 0,19000 0,4h 10 1,3140 0,51400 0,87900 20 5,65700 0,19000 0,19000 20 1,2570 0,54200 0,91900 30 5,65700 0,19000 0,19000 30 1,2170 0,55000 0,93800 40 5,65700 0,19000 0,19000 40 1,2050 0,55200 0,94700 50 5,57100 0,19000 0,19000 50 1,2000 0,56000 0,94700 160 3,62800 0,33000 0,40200 160 1,0970 0,54200 0,97600 170 3,58800 0,34000 0,40200 170 1,0910 0,53800 0,97600 180 3,54200 0,35000 0,41400 180 1,0850 0,53800 0,97600 190 3,51400 0,36000 0,42000 190 1,0850 0,53300 0,97600 200 3,45700 0,37000 0,42000 200 1,0850 0,53300 0,97600 0,8h 10 3,14800 0,53000 0,49500 0,2h 10 1,05700 0,51000 0,97900 20 2,98200 0,57000 0,52500 20 1,04800 0,51000 0,98900 30 2,76500 0,61900 0,56100 30 1,04000 0,51000 0,99000 40 2,64000 0,64700 0,59800 40 1,02500 0,51000 0,99000 50 2,55400 0,66600 0,60300 50 1,00000 0,51000 0,99000 160 1,76000 0,66600 0,76800 160 1,00000 0,51000 1,00000 170 1,71400 0,66300 0,77900 170 1,00000 0,51000 1,00000 180 1,67400 0,66000 0,79800 180 1,00000 0,51000 1,00000 190 1,62800 0,65700 0,79800 190 1,00000 0,51000 1,00000 200 1,58800 0,65000 0,80400 200 1,00000 0,51000 1,00000 0,6h 10 2,00000 0,53000 0,70400 Bare 10 1,00000 0,50000 1,00000 20 1,85100 0,57000 0,75400 20 1,00000 0,50000 1,00000 30 1,76000 0,59000 0,79000 30 1,00000 0,50000 1,00000 40 1,68500 0,61000 0,81100 40 1,00000 0,50000 1,00000 50 1,66200 0,62300 0,83100 50 1,00000 0,50000 1,00000 160 1,31400 0,59500 0,91400 160 1,00000 0,50000 1,00000
170 1,30200 0,59000 0,91400 180 1,28500 0,58800 0,92300 190 1,26800 0,58400 0,92300 200 1,25700 0,58000 0,92300 170 1,00000 0,50000 1,00000 180 1,00000 0,50000 1,00000 190 1,00000 0,50000 1,00000 200 1,00000 0,50000 1,00000
In order to obtain a clearer understanding of the behaviour of the frame-wall system response to the lateral force, several different variables were monitored at each loading step, though only a small fraction of the re-sults are reported here. These important rere-sults are presented in the form of a standardized. The secant stiffness of the frame-wall system, expressed as a multiple of the stiffness of the bare frame (for which a is equal to zero) is de-picted in Tab. 2. This is defined as the ratio of the horizontal displacement at the same load level for the bare frame. The shear force at the top of the column where the load is acting in Fig.1a, expressed as a fraction of the lateral load is shown in Tab. 2. The moment at the top of the column where the load is acting in Fig.1a, normalized with respect to the moment at the same location for the bare frame, has been presented in Tab.2.
It has been seen that the effect of infill gets clear only when it reaches at 0.4 for the value at the initial step of loading, though the stiffness of, infilled frame reaches at 5.7 fold, a rather high number, local failures occurring in the infill as a result of increasing dimensionless load, leads to a decrease in the overall stiffness of the system.
Shear strength of the column increases with the height of infill. When the height of infill reached at the value of 0.8h, it was seen that the shear force of the column was 50 % higher than the shear force it carries when it was a bare frame. In this case, "short column" verifies its effect. When the height of infill was organised at the height of storey, it was seen that it was useful in term of shear strength of column.
Input parameters are lateral load (P) and height of infill (ah) values. Output parameters are stiffness (infill /no infill), shear force / lateral load and moment (infill / no infill) at the loaded column. As it is known, in neural net-work applications, the input values and output values can be reduced to the values between 0-1. That is the normalization process, which is done in this work dividing P ' s by 220 and dividing a h ' s by 1.1h. The output values were also divided by 5.7 stiffness ratio, 0.7 shear force ratio and 1.1 moment ratio, which were the highest values that we used in our application. Training was performed for the heights of wall h, 0.8h, 0.6h, 0.4h, 0.2h and bare and for loads of frame 10, 40, 70, 110, 150,190. As known, the general aim in the training process is to teach the relations between input and output values to the program and to obtain good answers to different input values with the possible lowest error rates.
Values obtained from the numerical procedure (FEM) are used in the network training. A special code was used for ANN exercise by Karlık, B et al (17). It is adapted and fitted to our application with some changes. ANN architecture with multi-layered, forward feeding and backward propagation algorithm was chosen for the training. The ANN architecture used is a 2:9:9:3 multi-layer architecture as shown in Fig. 2.
Exact and ANN values of output are compared in Tab. 3 for various a h and P values. For these training values, the ANN algorithm produced results
_ \FEM - ANN\/ ANN
with average error less than 0.2 %. The
maxi-number of output
mum value for F E M / ANN is about 1.0351 in 0.4h infill height and 70 kN load value.
Table 3. The results of ANN and FEM in training
Infill Height Lateral load kN Solution Method Stiffness ratio (Infill / no infill) FEM/ ANN Left column Shear force/lateral load FEM/ ANN Left column Moment ratio (Infill / bare) FEM 5.65699 0.9977 0.18999 0.9984 0.19000 ANN 5.67016 0.9977 0.19030 0.9984 0.18543 FEM 5.65699 1.0136 0.18999 1.0004 0.19000 ANN 5.58108 1.0136 0.18992 1.0004 0.19688 FEM 4.77100 0.9960 0.21499 0.9963 0.25199 ANN 4.79018 0.9960 0.21580 0.9963 0.24728 FEM 3.97100 1.0105 0.28000 0.9961 0.34500 ANN 3.92982 1.0105 0.28110 0.9961 0.34998 FEM 3.66800 0.9976 0.31999 0.9859 0.39299 ANN 3.67685 0.9976 0.32458 0.9859 0.39100 FEM 3.51399 1.0034 0.35999 0.9830 0.42000 ANN 3.50218 1.0034 0.36621 0.9830 0.42245 FEM 3.14800 0.9996 0.52999 1.0010 0.49500 ANN 3.14932 0.9996 0.52945 1.0010 0.49826 FEM/ ANN 10 40 70 110 150 190 10 1.0246 0.9650 1.01.91 0.9858 1.0051 0.9942 0.9935 h
0.8h 0.6h 0.4 0.2h 40 70 110 150 190 10 40 70 110 150 190 10 40 70 110 150 190 10 40 70 110 150 190 10 40 70 110 150 190 FEM 2.64000 1.0004 0.64699 ANN 2.63882 1.0004 0.64981 FEM 2.38000 0.9923 0.69000 ANN 2.39853 0.9923 0.68539 FEM 2.06800 1.0093 0.69000 ANN 2.04899 1.0093 0.68438 FEM 1.80000 0.9923 0.67400 ANN 1.81405 0.9923 0.67482 FEM 1.62799 1.0110 0.65700 ANN 1.61035 1.0110 0.65845 FEM 2.00000 1.0097 0.52999 ANN 1.98080 1.0097 0.52918 FEM 1.68499 1.0184 0.60999 ANN 1.65441 1.0184 0.60451 FEM 1.58799 0.9914 0.62799 ANN 1.60180 0.9914 0.63103 FEM 1.44500 0.9884 0.61899 ANN 1.46194 0.9884 0.61932 FEM 1.34199 0.9902 0.59999 ANN 1.35234 4 0.59997 FEM 1.26799 0.9934 0.58399 ANN 1.27637 0.9934 0.58211 FEM 1.31400 0.9688 0.51399 ANN 1.35626 0.9688 0.51841 FEM 1.20500 1.0073 0.55200 ANN 1.19623 1.0073 0.55243 FEM 1.18800 1.0351 0.55700 ANN 1.14772 1.0351 0.55525 FEM 1.14199 1.0259 0.55000 ANN 1.11313 1.0259 0.54698 FEM 1.10800 1.0106 0.54199 ANN 1.09635 1.0106 0.54013 FEM 1.08499 0.9981 0.53299 ANN 1.08706 0.9981 0.53534 FEM 1.05699 0.9928 0.51000 ANN 1.06466 0.9928 0.50576 FEM 1.02499 1.0116 0.51000 ANN 1.01327 1.0116 0.51457 FEM 0.99999 0.9999 0.51000 ANN 1.00007 0.9999 0.51354 FEM 0.99999 1.0044 0.51000 ANN 0.99560 1.0044 0.51126 FEM 0.99999 1.0035 0.51000 ANN 0.99658 1.0035 0.51065 FEM 0.99999 0.9992 0.51000 ANN 1.00092 0.9992 0.51128 FEM 0.99999 0.9883 0.49999 ANN 1.01186 0.9883 0.49895 FEM 0.99999 1.0003 0.49999 ANN 0.99971 1.0003 0.50082 FEM 0.99999 1.0013 0.49999 ANN 0.99865 1.0013 0.50030 FEM 0.99999 1.0014 0.49999 ANN 0.99875 1.0014 0.49976 FEM 0.99999 1.0029 0.49999 ANN 0.99706 1.0029 0.49999 FEM 0.99999 1.0050 0.49999 ANN 0.99506 1.0050 0.50099 0.9957 1.0067 1.0082 0.9988 0.9978 1.0015 1.0091 0.9952 0.9995 1.0000 1.0032 0.9915 0.9992 1.0031 1.0055 1.0035 0.9956 1.0084 0.9911 0.9931 0.9975 0.9987 0.9975 1.0021 0.9984 0.9994 1.0005 1.0000 0.9980 0.59800 0.59322 0.63299 0.63932 0.69999 0.69937 0.75699 0.75320 0.79799 0.80154 0.70400 0.70163 0.81099 0.80825 0.84700 0.85013 0.88500 0.88322 0.90400 0.90729 0.92299 0.92590 0.87899 0.88908 0.94700 0.94073 0.95700 0.95764 0.96599 0.96755 0.97599 0.97278 0.97599 0.97613 0.97900 0.97675 0.99000 0.99184 0.99999 0.99633 0.99999 0.99820 0.99999 0.99824 0.99999 0.99726 0.99999 0.99798 0.99999 1.00260 0.99999 1.00295 0.99999 1.00302 0.99999 1.00266 0.99999 1.00196 Bare 1.0080 0.9901 1.0009 1.0050 0.9955 1.0034 1.0034 0.9963 1.0020 0.9964 0.9969 0.9887 1.0067 0.9993 0.9984 1.0033 0.9999 1.0023 0.9981 1.0037 1.0018 1.0018 1.0027 1.0020 0.9979 0.9971 0.9997 0.9973 0.9980
In Fig. 3, the mean square errors (MSE) in training versus iteration numbers are shown for problem. After 1600 iterations, the mean square errors dropped drastically. For more than 15000 iterations, our architecture 2:9:9:3 used in the analysis possesses the lowest total error values.
25,00 ^ 20,00 -™ 15,00 - • ^ 10,00 - • 5,00 - • 0,00 -I r - ^ * 1 • 1 1 • r > 1 0 200 400 600 800 1.000 1.200 1.400 Number of iteration
Figure 3. Mean Square Errors (MSE) based on iteration numbers for infilled frame
Different input values were applied to the program for testing the neu-ral network and the results were obtained in milliseconds. Testing was per-formed for height of wall h and for load values of frame 20, 60, 100, 140, 180. In Tab. 4, we compare the test phase results of ANN and FEM.
Table 4. Test Phase Results for infilled frame Left Height of Infill wall Load P kN Stiffness ratio FEM / ANN column shear FEM / ANN Left Column
Moment ratio FEM /
ANN Height of Infill wall Load P
kN Method (Infilled / no infill) FEM
/
ANN /lateral force load
FEM /
ANN (infilled/ no infill)
FEM / ANN 20 FEM 5,65700 1.0021 0,19000 1.0215 0,19000 0.993 20 ANN 5,64500 1.0021 0,18600 1.0215 0,19120 8 60 FEM ANN 5,18800 5,22100 0.9937 0,19500 0,19700 0.9898 0,21400 0,2134 1.002 8
h
100 FEM 4,1140 0.9669 0,27000 0.9953 0,32600 1.031h
100 ANN 4,2550 0.9669 0,27130 0.9953 0,31600 6 140 FEM ANN 3,73100 3,68000 1.0138 0,31000 0,3088 1.0038 0,38000 0,37290 1.019 0 180 FEM 3,54200 1.0022 0,35000 1.0043 0,41400 0.999 180 ANN 3,53400 1.0022 0.3485 1.0043 0,41485 8\FEM - ANNİ / ANN
The average % error ( } ) obtained is
obvi-number of output
ously about 0.269. The maximum value for F E M / ANN is about 1.0316 in 100 kN load value. From an engineering point of view, these errors are con-siderably low.
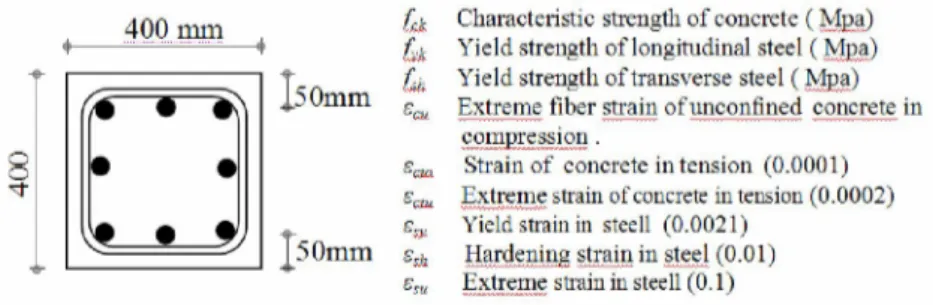
The other parametric study has been conducted to observe the effect of different variables on behavior of confined reinforced section shown in Fig. 4.
(¿t Characteristic strength of concrete ( Mpa)
¿ j Yield strength of longitudinal steel ( Mpa) f ^ Yield strength of transverse steel ( Mpa) s ^ Extreme fiber strain of uneonfined concrete in
compression .
saa Strain of concrete in tension (0.0001) sau Extreme strain of concrete intension (0.0002)
% Yield strain in steell (0.0021) Hardening strain in steel (0.01) Extreme strain in steell (0.1)
Figure 4. The cross-section considered in analyses.
Variables selected to incorporate in the expression of moment-curvature are compressive strength of concrete (fck), the ratio of the axial load
to the axial load capacity (N/No), yield strength in transverse reinforcement
(fsh), space of transverse reinforcement (s), diameter of transverse
reinforce-ment (0), ratio of longitudinal steel (p), yield strength of longitudinal steel (fyk) as shown in Tab. 5. Where TY, TH, CvC, CoC , e, M are yield in
ten-sion, hardening of reinforcing in tension , cover crushing, core crushing, strain at maximum moment, and maximum moment, respectively.
The results obtained from Tab. 5 demonstrates no very significant ef-fect on Moment capacity from compressive strength (fck) in case of pure bend-ing (N=0). The compressive strength becomes effective with increasbend-ing axial load. Maximum moment capacity shows changes of ±25% due to ±25% compressive strength variation. The increasing compressive strength causes the decrease in ductility.
As level of the axial load (N/No) on the cross-section increases,
ductil-ity decreases. Increase in ductilductil-ity with decreasing axial load is very signifi-cant. It is interesting to note that, although the section considered is well con-fined, the behavior becomes very brittle under high levels of axial load. The upper limits imposed on axial loads in seismic codes results from such consid-erations. 400 mm o o •st 0mm 50mm
Variaba prapertips Cuniun (radpi) «« M (Ü.--Q1) No
fa
N itttäl {cm) lllltl P . O U Ott» rv 1« £3£ 3 SO 0 420 15 B 0 03 130 OWSI 0 0365 0 0331 0 0192 0 0125 341 0 2 20 0 420 15 S 0.02 120 0.0105 0.0245 0.03 50 0.0125 22S.2 i 16 0 420 15 11 0.02 120 O.OQP3 00353 0.0212 0.0323 0.0125 222.1 4 30 ¡Ü5 420 IS 8 Mi 420 Mi 13 MÍ 30 Ó.ÓI4I 0.0030 350.1 > 30 0.35 IX 15 8 0 03 4M 0.0171 0 0115 0 0I3J 0 0032 3« 3 6 o ! IX IS £ Mi 410 (1.0167 0.0113 0.01 IS 0.0032 3Í6.Í 42 30 0.25 420 15 « 0.00 II 420 0.0122 0 0.0141 0.01 76 0.0034 IVI ! 43 30 0.5 tX 15 8 0.008 420 0.0165 0.0084 0 0038 214.0 44 30 0.J5 420 15 8 0 OOS 420 0.0059 0.0030 166.5 41 30 0 420 15 8 0011 330 0 00S1 0 03J1 0M54 0 BIB 0 0034 MS 46 30 0 420 IS 5 0.(111 3» 0.055 J 0.O335 0.0630 0.1361 0.0026 633 47 30 025 420 15 0 011 330 0 COS7 0 0303 0 0143 0 0150 0 0034 1« 7 43 30 (Ü5 420 15 i 0.011 320 0.00 V5 0.0311 0.0149 0.0164 0.0038 166.5 49 30 0 J 420 1J A 0 011 330 0 0137 OOOS3 0 00« 0 0033 314 & 50 30 OS 420 15 8 0.011 320 0.0101 0.0034 0.0094 0.0038 196.7 J1 30 0.35 420 15 I 0 011 320 0.0151 0.0059 0.0065 0.0030 163.7 157 .a J: 30 <>7S 420 15 £ 0.011 3» 0.0134 0.0055 0.0063 0.OD30 163.7 157 .aIt is seen that yield strength in transverse reinforcement (fsh) has no
ef-fect on behavior for all levels of axial load. The spacing of the lateral rein-forcement (s) in the confined section is ineffective on behavior at low level of axial load. The maximum moment capacity and ductility increase when spacing of the lateral reinforcement is reduced with increasing axial load. As ductility increases with diameter of transverse reinforcement (0), it has no very effect on moment capacity. The crushing of core concrete delays with increasing diameter of transverse reinforcement. The diameter of transverse reinforcement becomes effective with the increasing axial load. The quantity of longitudinal reinforcement (p) has an important effect on behavior of the confined section. Maximum moment capacity causes increasing 10% due to a the quantity of longitudinal reinforcement variation 30%. The quantity of longitudinal reinforcement has very significant effect on behavior at low level axial load. The moment capacity decreases with the higher axial load . The quantity of longitudinal reinforcement is ineffective on ductility. The yield strength of longitudinal bar (fyk) is effective parameter in case of pure
bend-ing. Maximum moment capacity causes changing ±10% due to a yield strength of longitudinal reinforcement variation ±30%.
In this study , a neural network program which was written by Karlık et al. (17) in PASCAL was used . It is adapted and fitted to our application with some changes. Seven variables for input and six variables for output values were considered in the application. As known, the general aim in the training process is to teach the relations between input and output values to the pro-gram and to obtain good answers to different input values with the possible lowest error rates. Input variables are compressive strength of concrete ( fck ) ,
load level ( N / No), yield strength of transverse steel ( fsh ), spacing of
trans-verse steel ( s ), diameter of transtrans-verse steel (0), quantity of longitudinal bar ( p ) , yield strength of longitudinal bar ( fyk ) . Output variables are yield in
tension (TY), hardening of reinforcing in tension (TH), cover crushing (CvC), core crushing (CoC), strain at maximum moment (e) and maximum moment capacity. As it is known, in neural network applications, the input values and output values can be normalized to the values between 0-1.
A neural network system is applied with multi-layer perception feed forward and back-propagation algorithm by supervised training. After some trials with low number of training iterations, it is seen that the best results were obtained with learning rate a of 0.7, and momentum value ^ of 0.9. The num-ber of nodes in the hidden layer was changed for new trials. 1000 iterations were performed for each node number between 1 and 0, and the errors were obtained from the program per 100 iterations. The chances in % error values of 1000 iterations due to the number of hidden layer nodes are shown in Fig 5. Finally, the lowest errors were obtained in the order of 7:12:13:6 which means 7 input values, 12 and 13 nodes in hidden layers and 6 output value. Thus, the network architecture would be as in Fig 6
Number of hidden layer
Figure 5. The error changes due to the number of nodes in the hidden layer 1000 iterations.
The training iterations were increased to 5000. So, we obtained as low as 0.07% average errors, which is reasonably good for ANN applications. The
change in errors can be seen in Fig. 7. Then the ANN program is tested with sample values that were not used in the training.
Hidden Layer Hidden Layer
Figure 6. ANN architecture for confined sections
Number of iterations
Figure 7. The error change at ANN architecture (7:12:13:6) for confined sections
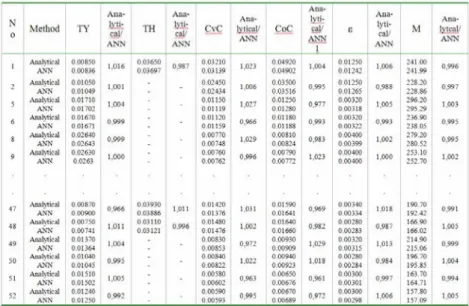
ANN values of output are compared in Tab. 6. The average error
be-\Analytical - ANN 1/ ANN
tween analytical and ANN ( ) is produced less
number of solution
than 0.2 %. The maximum difference (Analytical / ANN) for TY, TH, CvC, CoC,e and M is about 0.965, 0.978, 1.039, 0.961 , 0.962 , and 0.976 , respec-tively. From an engineering point of view, these errors are considered low.
A n a - A n a A n a A n a -l i t b A n a - A n a -N 0 Method TY Mr cay A N N TH lyti-cal/ A N N C v C lytical/ A N N C o C cal A N N İ € lytic cal/ A N N M luteal/ A N N Analytical 0.00850 3,016 0-03650 0,987 0.03210 1,023 0.04920 1,004 0.01250 1.006 241.00 0,996 ANN 0.00836 3,016 0.03697 0,987 0.03139 1,023 0.04902 1,004 0,0! 242 1.006 241,99 0,996 Analytical 0.01050 1,001 0.02450 1,006 0.03500 0,995 0.01250 0.988 228.20 0,997 • ANN 0,01049 1,001 0.02434 1,006 0.03516 0,995 001265 0.988 228.86 0,997
5 Analytical ANN 0.01710 003702 1,004 0.Oİ150 0 01119 1,037 0.01250 0 01280 0,977 0.00320 OOOJIS 1,005 296.20 295,29 1,003 6 Analytical ANN 0 01670 0 0167] 0,999 0 01320 0 01159 0,966 OOl ISO 0 01388 0,993 0,00320 0 00322 0.993 236 90 23«,05 0,995 S Analytical ANN 0.02640 0.02643 0,999 0.00770 0.00748 1,029 0.00810 0.00824 0.9S 3 0.00400 O.0Û399 1,002 279.20 280.52 0,995 9 Analytical ANN 0,02630 0.0263 1,000 0.00760 0.00762 0,996 0.00790 0.00772 1,023 0,00400 0.00400 1,000 253.10 252,70 1,002
47 Analytical ANN 0 00£70 0 00900 0,966 0 03930 • 03886 1,011 00 01376 01420 1,031 00 01641 01590 0,969 0,00340 O0OÎ34 1,0] S 190 70 192 42 0,991
48 Analytical ANN 0 00750 0.00741 1,011 0.03310 0.03121 0,996 0.01476 001480 1.002 00.01660 01640 0,982 0 00780 0.00283 0,98? 166 90 166 02 1,005 49 Analytical ANN 0.01370 0.01364 1,004 0.00830 O.OOS53 0,972 0.00930 0.00909 1,029 0.00320 0.00315 1.013 214.90 215.06 0,999 50 Analytical ANN 0 01040 0.01045 0,995 0 00840 0.00822 1.022 0 00940 0.00923 1.018 0,00280 0.00284 0,984 196 70 195.85 1.004 51 Analytical ANN 0.01510 0.01502 1,005 0.00580 0.00602 0,963 0.00650 0.00676 0,961 0.00300 0.00301 0,997 163.70 164.71 0,994 52 Analytical ANN 0.01240 0.01250 0,992 0.00590 0 00593 0,995 0.00670 0 00689 0,972 0.00300 0 00298 1,006 157.BO 35709 1,005
The ANN program is tested with sample values that were not used in the training. Different input values were applied to the program for testing the neural network and the results were obtained in milliseconds. A comparison of test and analytical values is given in Tab. 7. The average error
I.Analytical - ANN 1/ ANN
(J ) obtained is obviously about 0.33%. The
number of solution
maximum difference (Analytical / ANN) for TY, TH, CvC, CoC, s and M is about 0.967, 0.966, 0.972, 0.968 , 0.991 , and 0.992 , respectively. From an engineering point of view, these errors are considered low.
Table 7. Testing process and results for confined sections
N Attaly. f Aiialy. t Anaty- A n a t y . / A n a i y . Anaiy. Method TY Attaly. f TH Aiialy. t C v C / CoC A n a t y . / £ A n a i y . M t 0 A N N A N N A N N A N N A N N A N N 3 Analytical ANN 0 009} 0 0094 0,987 0 0363 0 0375 0 966 0.0212 0 0206 1,025 0 0323 0 0313 1 0 3 1 0 0125 0 0125 0 9 9 9 222 40 224 18 0 992 4 Analytic al ANN 0.0112 0.0110 1.0M 0.0120 0.0122 0,976 0.0141 0.014? 0,968 0.0028 0.0027 1,004 350.10 3-W.19 1.005 7 Analytical ANN 0 0251 0 0 2 5 0 1 003 0.0079 0 DOB 1 0 9 7 2 0 0089
0 0086 1.032 0 0032 00032 0 9 9 7 342 40 342 33 3 000 Analytical 0.0048 1.024 0.0059 1.021 0.0036 1,002 173.80 0,994 12 ANN 0.0046 1.024 0.0057 1.021 0.0035 1,002 174.08 0,994
35 Analytical ANN ooos;' 0 0083 0 9E6 00337 0 0335 1 004 00390 0 03£6 1,009 0 0646 0 0654 0 9S8 o o i o o 0 0100 0 9 9 9 135 30 134 19 3 OOS 17 Analytical ANN 0.0115 0.0115 0.992 0.0520 0.0513 1.012 0.0135 0.0133 0.979 0.0151 0.0154 0,975 0.0034 0.0034 0 991 214.30 214.79 0.998 24 Analytical ANN 0.0208 0.0215 0.967 0.0081 0.00*2 0.978 0.0038 0.003S 0.991 222.70 224.44 0.992
4. CONLUSIONS
In this paper, an alternative numerical and analytical techniques, an ANN algorithm is used in the analysis of infilled frame and confined rein-forced section. Neural simulation of numerical and analytical procedure are given in this study. To reduce the calculation time of the microprocessor of system, a new computer program is used by the ANN method, which gives answer in milliseconds. ANN architecture was chosen in which multi layer, feed forward, and back propagation algorithm is used. The training data of infill frame are provided by a finite element model in which non-linearity of materials and the structural interface were taken into account under increasing lateral load. For the inelastic static analysis, an incremental iterative procedure is adopted. Using the proposed analytical model (layered model) are generated the training data for confined reinforced concrete section. Developed model is using layered modeling technique and capable of taking into account; crushing of cover and core concrete, strain hardening of steel and effect of confinement on core concrete. After completing the training phase, verification of the performance of the network was carried out using old (included in training phase) and new (not included in training phase) patterns. The controls con-ducted in the test phase.
ANN algorithms can not of course replace totally the conventional nu-merical and analytical techniques, since they need some key values for train-ing. However, in the analysis infilled frame and confined reinforced sections, they can be implemented as an efficient supplementary tool reducing drasti-cally the computational cost. Modeling process in neural network is more di-rect, since there is no necessity to specify a mathematical relationship between input and output variables. The trained ANN is able to produce quick results in the analysis of infilled frame and confined reinforced section with the same degree of accuracy as numerical and analytical model. Therefore, the trained ANN may be used in practice for the design of infilled frame and confined cross section as on alternative to the time consuming numerical and analytical procedure.
REFERENCES
1. Holmes M. Steel frames with brick work and concrete infilling. Proc. Instn. Civ. Engrs. 1961, 19: 473-498.
2. Smith BS. Lateral stiffness of infilled frames. Journal Struct. Div. ASCE. 1962, 88 ST6: 183-99.
3. Mallick D V and Severn RT. The behaviour of infilled frames under static loading. Proc. Instn. Civ. Engrs. 1967, 38: 639-656.
4. Loo YC and Yang Y. Cracking and failure analysis of masonry arch bridges. Journal of Structural Engineering. 1991, 6- 117: 1641-1658.
5. Liauw TC and Kwan KH. Non-linear analysis of multistorey infilled frames. Proc. Instn. Civ. Engrs. 1982, 2, 73: 441-454.
6. Bağcı M., Altıntaş G., Artificial Neural Network Analysis of Infilled Planar Frames, Proceedings Of ICE, Structures & Buildings 159(1), 37-44, 2006
7. Parviz S, Jongsung S, and Jer-Wen H. Axial / Flexural Behavior of Rein-forced Concrete Sections / Effects of Design Variables. ACI, 1991, 88:
17-21.
8. Ersoy U.and Özcebe G. Moment-Curvature Relationship of Confined Con-crete Sections. First Japan-Turkey Workshop On Earthquake Engineering, Ankara, Turkey,1997, 10-21.
9. Patodi SC and Purani VS. Modeling flexural behavior of steel fibre rein-forced concrete beams using neural networks. Journal of New Building Materials and Construction World, 1998, 4: 28-35.
10. Jadid M N and Fairbairn DR. Neural-network Applications in Predicting Moment-curvature Parameters from Experimental Data. Engineering Ap-plications of Artificial Intelligence, 1996, 9: 309-319.
11. Berke L and Hajela P. Applications of Artificial Neutral Nets in Structural Mechanics, Structural Optimisation., 1992, 4: 90-98.
12. Lee Y, Oh SH., Hong HK., and Kim MW. Design Rules of Multi-Layer Perceptron. Proc. SPIE, Science of Artificial Neutral Nets in Structural Mechanics. Structural Optimisation, 1992, 1710: 329-339.
13. Avdelas AV, Panagiotopoulos PD, and Kortesis S. Neutral Networks for Computing in the Elastoplastic Analysis of Structures. Meccanica, 1995, 30: 1-15.
14. Abdalla K M and Stavroulakis GE. A Back propagation Neutral Network Model for Semi-rigid Steel Connections. Microcomputers in Civil Engi-neering. 1995, 10: 77-87.
15. Karlık B, Özkaya E, Aydın S, and Pakdemirli M. Vibration of beam-mass system using artificial neural networks. Computers & Structures, 1998, 69: 339-347.
16. Fiorato A. C., Sözen M. A.,. An investigation of the interaction of rein-forced concrete frames with masonry filler walls. Structural research se-ries report No. 370, University of Illinois, Urbana, November, 1973 .