© TÜBİTAK
doi:10.3906/elk-1804-195 h t t p : / / j o u r n a l s . t u b i t a k . g o v . t r / e l e k t r i k /
Research Article
Design of a portable and low-cost mass-sensitive sensor with the capability of
measurements on various frequency quartz tuning forks
Mehmet Altay ÜNAL1,2,, İsmail Cengiz KOÇUM3,, Dilek ÇÖKELİLER SERDAROĞLU3,∗, 1Physics Engineering, Faculty of Engineering, Ankara University, Ankara, Turkey
2Biotechnology Institute, Ankara University, Ankara, Turkey
3Biomedical Engineering, Faculty of Engineering, Başkent University, Ankara, Turkey
Received: 27.04.2018 • Accepted/Published Online: 30.12.2018 • Final Version: 15.05.2019
Abstract: Recently, sensor and biosensor applications have become widespread and are now significant tools in the biomedical field and other areas. Since quartz tuning fork (QTF) resonance frequency depends on the mass adsorbed to its prongs, it is generally used to measure minor mass change and detect target analyte in picogram levels. This study is undertaken to design and fabricate a sensor device for the measurement of QTF transducers. When QTF sensor studies were investigated, it was found that explanations on the details of instrumentation part were limited, and in addition, there was no compact commercial products. In this study, a novel, low-cost, portable quartz tuning fork sensor device with ability to work with any kind of display is presented in detail. Moreover, the effect of the ambient temperature during the measurements was checked. Six other QTF transducer types, 32, 32.768, 40, 65.536, 75, and 100 kHz, have been studied as the other novel part of the research. As a result, a QTF sensor device was fabricated that has further advanced features when compared with its alternatives and works with a more accurate measurement method. Owing to this advancement, using biosensor/chemical sensor which consists of QTF transducers with features that can take sensitive analyte measurement in picogram level will be able to spread.
Key words: Quartz tuning fork, mass-sensitive sensor, portable device
1. Introduction
In analytical chemistry, selectivity has a great importance, particularly at low analyte concentrations and in the presence of interfering substances for direct measurement without any pretreatment of samples. The sensitive and selective determination of compounds that are in a large quantity has a direct effect on scientific research and several branches of industry. For instance, process control in the chemical, food industries, biotechnology, and biomedical applications (diagnosis of diseases etc.) [1]. In recent years, ‘chemical sensors or biosensors’ have been recognized as a desirable approach for direct molecule detection. There has been an increasing interest and demand in sensors that are capable of rapid analyte detection with high sensitivity and selectivity [1–9]. To add, according to the transducer type some sensors offer portable and low-cost detection. Bringing the given two critical performance features to the sensor device directly affects the sensor’s in situ detection capabilities [10, 11]. A sensor measures analyte by using a sensing element. Sensor devices are based on the direct spatial coupling of an active compound with a signal transducer and an electronic amplifier. The term “sensor” is generally describes the whole device that shows a measurable analytical signal from a transducer ∗Correspondence: [email protected]
which indicates a characteristic respond when subjected to an analyte [5]. While a sensor is defined as a whole measuring device, a transducer is a part of a sensor that converts an observed change (physical or chemical) into a measurable signal. In sensor devices, physicochemical change from the interaction with the analyte must be converted into an electrical output signal by an appropriate transducer. However, this simple explanation does not completely define the term. Because a transducer is the heart of any sensor like, biosensors, chemical sensors, and physical sensors. A chemical sensor is defined as a device which responds to a particular analyte in a selective way through a chemical reaction and can be used for the qualitative or quantitative determination of the analyte [5]. Biosensors are really a subset of chemical sensors, but are often treated as a topic in their own right. The key difference is that the recognition element is a biological molecule that is found in nature [5,12]. On the other hand, physical sensors are concerned with measuring only physical quantities such as length, weight, temperature, pressure, and electricity. To sum up, sensors have to be integrated with a transducer of some sort; thus, a visibly observable response occurs [5]. This study presents a sensor system that is capable of measuring signals form quartz tuning fork (QTF) which is a mass-sensitive transducer and measurement results. It is compared with alternative QTF sensor systems to bring out its advantages over them. The details of a new QTF sensor system that carries the potential of being setup as a chemical or biosensor device are given.
QTF transducers have been reported to be valuable for mass detection. The basic principle of the ‘tuning fork’ is well known to musicians: two prongs connected at one end make a resonator whose resonance frequency is defined by the properties of the material from which it is made and by its geometry. Using a piezoelectric substrate allows the mechanical excitation of the tuning fork to be replaced by an electrical excitation. Piezoelectricity defines the ability of a material to convert a voltage to a mechanical displacement, and conversely, to generate electrical charges by the deformation of the crystalline matrix [13–18]. Therefore, the tuning fork resonance frequency depends on the mass adsorbed to its prongs. This gives the QTFs a capability to measure picogram to nano-gram level of mass. For that reason, they can be used to develop biosensor or chemical sensor. QTF sensors have previously been proposed as simple alternatives to other conventional mass-sensing quartz crystal microbalances (QCM) [19]. In addition, Zhang’s comparative study found that QTF’s results are more sensitive and reliable than QCM’s results [20]. Due to the hardness of the quartz, the acoustic energy can be trapped between the two forks. This gives us a chance to reach high quality factors. Quality factor is a measure that determines the behavioral characteristics under external perturbing forces. Previous research shows that high-quality factor which is the ratio of the energy stored in the resonator to the energy loss during each oscillation period is among the most important factors for stability of mass-sensitive sensors [21, 22]. Several experimental sets (sensor devices) have been used for exciting QTF in several applications. There are mainly four types of topology to establish QTF excitation and measurement system. I) Using impedance analyzer and digital oscilloscope, II) Making oscillator circuit using QTF, III) Using discrete devices which are frequency generator, I/V converter, RMS-DC converter, demodulation circuit, lock-in amplifier, data acquisition module, and personal computer (PC), IV) Using specially designed devices. The first setup includes an Impedance analyzer which is a very complex instrument that has a capability to measure several parameters in a single device. For that reason it is bulky and expensive. A digital oscilloscope may or may not be used to observe the signal. On the other hand, such kind of instruments cannot only be described as expensive, since they are extremely expensive [23]. The application that can be grouped under the second setup include several oscillator circuits that have been implemented by the aid of digital gates or analog components. Because of the high Q factor (greater than conventional quartz crystals) of QTFs, these circuits are critically oscillating, and they need more accurate impedance matching. Additionally, QTFs also need energy for oscillation, so
sensitivity of QTF is relatively lower for this kind of self-driving circuits [24–27]. The third setup which is the most common in QTF studies generally involves discrete devices. These devices can be examined in two parts which are digital devices like frequency generator, data acquisition module, personal computer, and analog devices like I/V converter, RMS-DC converter, demodulation circuit. In this respect, sensitivity, repeatability, and resolution depend on the worst device in chain and generally these are analog devices. As an example, I/V converters consist of operational amplifiers (op-amp) and resistors which produce noise. Thermal drift is another problem for op-amps. RMS-DC converters also consist of op-amps, resistors, capacitors, and diodes to convert AC to DC and to take the integration of signal. Although each of them has different problems, capacitors are another big problem because of thermal drift and its internal resistance. Demodulation circuits are similar with RMS-DC converters and have similar problems. For these reasons, in very short time intervals relatively good sensitivities may achievable. On the other hand, most probably in several seconds, output of these devices will have been drifting because of several factors like temperature and humidity. [19,22, 28–31]. The fourth setup example that can be found in some QTF studies are specially designed devices which consist of a function generator and again some analog circuits like transimpedance amplifier, voltage amplifier, filters. [32]. Moreover, there are also some more additional circuits which may be analog or digital like windowing, peak detector, zero crossing. For that reason, it can be said that specially designed devices are also more complicated and consist of critical analog circuits which restrict the sensitivity and repeatability. Once again, it is crucial to emphasize that the values being measured are profoundly low, in the picogram (pg) range. Therefore, the approaches chosen for the measurement device setup have critical effects on the measurement signals of the analytes that are distinctively low in concentration. In this study, to eliminate the mentioned disadvantages, a relatively new, cost efficient, compact and totally digital QTF exciting and reading device is presented. Besides this, as in all the other type of mass-sensitive devices (such as quartz crystal microbalance) thermal drift of QTFs is a critical point to measure pg level mass variation [33]. In this reference, thermal drift effect on QCM was presented and determined as 2.28 Hz/T(◦C). Due to QTF’s principle, it is highly important to show relevant profile since it is nonlinear. Therefore, our second goal is to demonstrate shifting of resonance frequency with temperature. Because of this goal, in the second part of study several QTFs which have different resonance frequency are tested against temperature as an application. To perform this test, a temperature controlled chamber was realized and controlled by using the same digital device.
2. Hardware infrastructures and design
The Sauerbrey equation given in Eq. (1) is a well-known equation that presents the relationship between the mass load and frequency shifting of transducer expressed as in [20];
S = ∆f ∆m =−f0 2m=− 1 Π 1 ω3l3 √ Eq ρ3 q , (1)
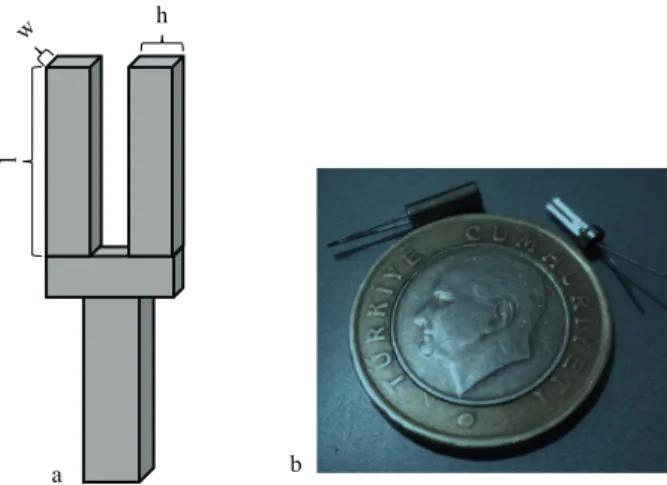
where f0 is unperturbed frequency of QTF, m is real mass for tine, w is width, and l is length of tine respectively as demonstrated in Figures 1a and 1b. To add, Eq is the Young’s modulus of quartz and ρ is given as quartz density. This equation shows the working principle of mass-sensitive systems and defines the relation between extrinsic factor as mass and frequency shift. In this study, the effect of temperature which is another extrinsic factor was examined
h
w
l
a b
Figure 1. a- Schematic presentation of QTF transducer. b- Commercial QTFs that has a cap over its prongs that is under vacuum.
2.1. QTF exciter and reader
QTF is a discerete component. Measurements can be made by placing it with tweezers on the socket of the circuit. Therefore, disposable and low-cost QTF transducers are a simple and advantageous option for biosensor applications. Generating a high-resolution sinus function was the first criterion because of our main goal is pg level mass detection. Therefore, AD9850 was chosen because it has innovative high-speed direct digital synthesizing (DDS) core that provides a 32-bit frequency tuning word, which results in an output tuning resolution of 0.0291 Hz, for a 125 MHz reference clock input (AD9850 datasheet and product info, http://www.analog.com/en/rfif-components/direct-digital-synthesis-dds/ad9850/products/product.html., Accessed: 17th September 2014) and it has a 0–40 MHz frequency range. In order to synthesize any frequency, AD9850 needs digital information in a special format. This information (frequency tuning control and phase modulation words) are loaded into the AD9850 via a parallel byte or serial loading format by a microcontroller which is Arduino Due board in this study. AD9850 needs four connections to communicate with Arduino Due which are word load clock pin (WCLK), frequency update pin (FQUD), serial data load pin (DATA), and reset pin (RESET) pins and all these pins are controlled by the Arduino DUE board.
Arduino boards are easily available and low-cost and Arduino Due board is one of the most powerful boards of the Arduino series which consist of high-speed ADC as well. Atmel SAM3X8E ARM Cortex-M3 CPU has 1 MSPS ADC speed theoretically. For these reasons, Arduino Due board was preferred to run all functions like to upload frequency data to the DDS chip, to read voltage, to display results. The whole QTF exciting and reading system is presented in Figure2 with a block diagram. In this system, the excitation frequency is shifted step by step and voltages are read to find the new resonance frequency of the QTF after mass loaded. The microcontroller finds the maximum voltage from the frequency-voltage matrix which is memorized during scanning. According to theoretical knowledge, at the value of the resonance frequency of the QTF the current value is maximum. This current flows through the input impedance of ADC. Although this current is very small (around 60 nA) dramatic voltage changes occur at high input impedances of ADC (around 10 M Ω) at the resonance frequency [34].
The voltage reading process at the designed and implemented instrument is carried out directly by a sampling technique without converting the data into any other forms like DC voltage, frequency etc. Although,
Figure 2. Block diagram of the whole QTF sensor system.
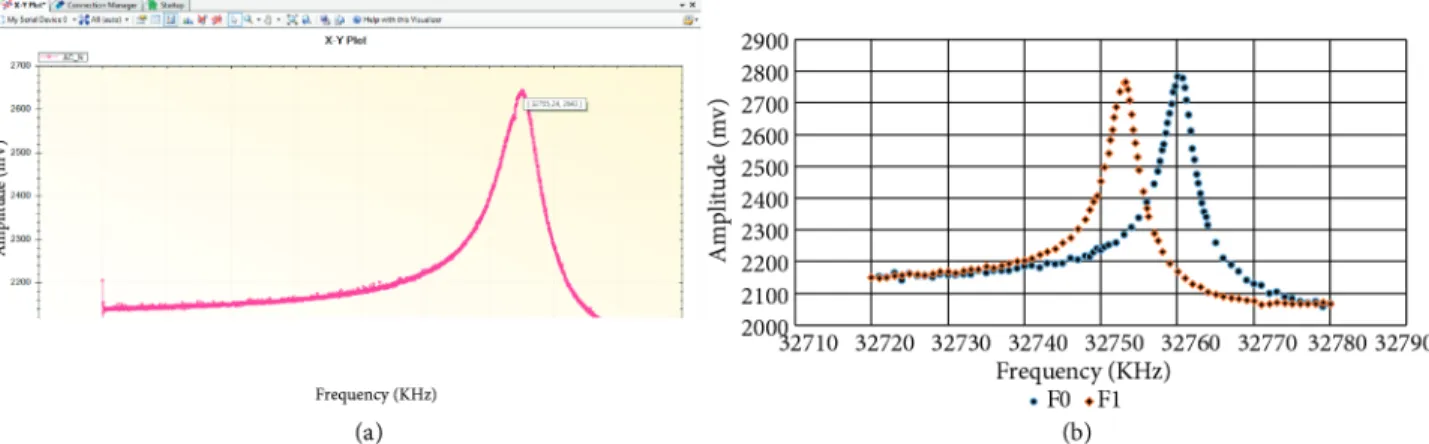
theoretically, the ADC speed of Arduino Due board is 1 MSPS, by using default conversion protocol it is impossible to reach this much of speed. However, Arduino Due allows reaching to its own registry due to it is ARM-based microcontroller board. Through this way, it is possible to bypass ADC conversion protocol to reach high speed. This mode of conversion is known as free running mode. Therefore, in this study ADC were set up to free running mode to reach high conversion speed. By using this method, it was observed that only 600 KSPS can be reached. The final part of the device implementation is designing a display. Generally, a measuring device has a display unit to show the results. Nonetheless, no display was used because this device can communicate with a smartphone via Bluetooth or a computer via USB port etc. For this reason, the results were displayed on computer during forward experiments. As a result, with the integration of the QTF transducer into the sensor system a sample of frequency-amplitude data has been obtained and given as a graphic in Figure3a. The peak in the graphic is saved as the base frequency f0 of the QTF. Later on, with any mass load that might be on the QTF surface due to a chemical sensor or a biosensor application (i.e. any physical adsorption or antibody immobilization) the frequency scanning process is repeated and a new peak is determined ( f ). The difference between the given two values is proportional to the mass load on the QTF transducer (Figure3b).
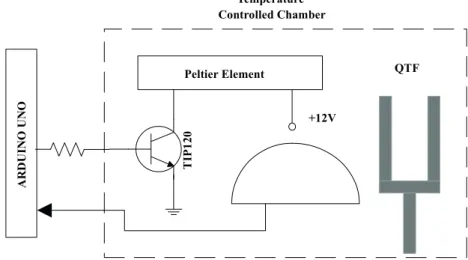
2.2. Temperature-controlled chamber
In this part of the study, a temperature-controlled chamber that has been briefly explained in Figure 2 has been designed for testing of QTFs which have different resonance frequency against temperature. The details of this temperature-controlled chamber is presented in Figure 4. It is well known that the frequency shifting of a quartz resonator depends on some environmental factor such as temperature change [35] as can be seen in Eq. (2):
Figure 4. Schema of electronic heating control unit.
∆f fq = ( ∆f fq ) M + ( ∆f fq ) T + ( ∆f fq ) S + ( ∆f fq ) P + ( ∆f fq ) µ , (2)
where ∆f is the frequency shift, fq is the fundamental resonant frequency of the quartz, M is base mass, T is
temperature, S is stress, P is pressure, and µ is viscosity. We can express the change due to temperature as [36] in Eq. (3): 1 f0 ∂f ∂T = 1 2(α + β), (3)
where α is the isotropic expansion coefficient and β is the temperature coefficient of the young module. A shift occurs at the frequency of the crystal exposed to one or more of these effects. After all, temperature change is one of the most common variable in a QTF integrated chemical sensor or biosensor application. The difference in frequency between the resonance value obtained in the main steady state and the resonance value after the stimulation with the temperature, for example, gives us very accurate information about the impact of the effect. Therefore, the differentiation of a possible frequency change due to a temperature change in a QTF sensor application either as a chemical or biosensor is crucial since the sensor has the capacity of measuring analytes that are in pg-ng levels. Most studies in the field of QTF biosensors have only focused on frequency shifting that depends solely on mass loading. In addition, previous studies have reported that the temperature influence needs further investigation [37,38]. Even though some studies have assessed the temperature effects on frequency shifting of QTF, only one type of QTF (base frequency = 32.768 kHz) was used in these studies [7,39,40]. However, in this study, an experimental setup has been established which allows precise observation of the temperature change, and the stability of QTF transducers with different base frequencies (base frequency:
32, 45, 65.736, 75, and 100 kHz) are defined in the sensor system which is produced and contains unique features. Consequently, it can be stated that one other goal of this research is to demonstrate how frequency shifting is affected by temperature changes for QTFs with different base frequencies in addition to 32.768 kHz. For this purpose, commercially available LM35 as a temperature sensor, TIP120 as a power transistor to drive heater, and a Peltier element as an actuator have been used (Figure 4). An important point is that LM35 temperature sensor localization must be very close to QTF sensor for the reason of heat gradient; therefore, LM 35 was located as close as possible to QTF for more accurate control. LM35 can be used with single power supplies or with bipolar supply. Arduino Uno board has 5V power pin that can provide the power necessity of LM35 temperature sensor. For that reason, LM35 is supplied from that pin. LM35 is a precision centigrade temperature sensor (Texas Instruments, Texas, USA), which normally has a sensitivity of 10 mV/◦C. On the other hand, for each 1.1 V reference voltage of ADC, its sensitivity is 9.31 mV/◦C (LM35HigherResolution, http://playground.arduino.cc/Main/LM35HigherResolution.,Accessed: 23rd September 2014). The low output impedance, linear output, and precise inherent calibration of the LM35 make interfacing to readout especially easy. Thus, it has been directly connected to one analog input of Arduino Uno which is reserved for temperature sensor data (in this study used Analog 5 port).
2.3. Software information
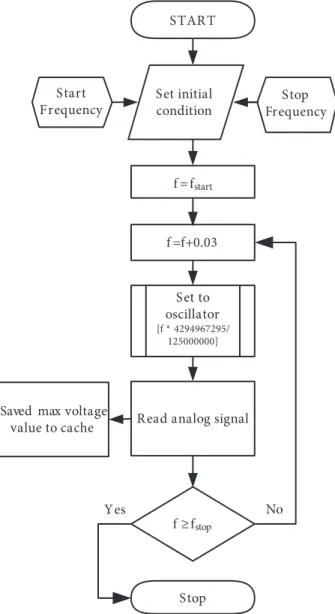
As mentioned before in this study two different micro controllers, one for oscillator control and sampling of QTF’s signal, and the other one is for controlling of temperature of chamber have been used. Hence, two different algorithms run inside two different microcontrollers. For oscillator control, a frequency sweep algorithm which contains two sweeping mode as high-speed and low-speed runs inside micro controller. The high-speed mode provides an estimation regarding frequency shifting in order to determine the start and stop frequencies of sweeping. Although low-speed sweeping gives more accurate results, it takes long time. Thus, the start and stop frequency should be selected according to the result obtained in high-speed mode. The second duty of Arduino Due is to acquire amplitude data from the output of QTF by applying direct sampling technique. After the detection of start and stop frequency in high-speed mode, more precise low-speed mode begins. During the low-speed sweeping mode, frequency is increased with 0.03 Hz steps which are the maximum resolution of DDS chip. For each step of frequency, voltage output of QTF is read by applying sampling method in free running mode. By this way, a frequency-voltage matrix is created in memory of computer, tablet, or phone which is used as a display and memory. Flow chart of this main algorithm is presented in Figure 5. During frequency switching, peak bounces are observed for a very short time interval because of capacitive effects of electrodes on QTFs. For this reason, the sweeping algorithm waits for 2 s just before reading analog input signal, so as to eliminate peak bounce.
Additionally, for each frequency value, analog signals have been read for at least three periods and then the values were written to the serial port in a frequency-voltage value format. In this study, we have used a notebook to display and store data. Another microcontroller, Arduino Uno, is used for the temperature control of the chamber. The control method for the proposed system is simple proportional control with offset adjustment. For this purpose, duty cycle of driving signal of peltier element is controlled proportionally. In this study, Analog pin 3 was used for PWM signal which can be adjusted between 0 (always off) and 255 (always on). By using this system, the temperature of the chamber has been controlled in the range of 30–80 ◦C with
± 0.2 ◦C precision. Total stability, offset, and steady-state time depend on the volume of chamber, applied
STAR T Set initial condition f = fstart f =f+0.03 Set to oscillator [f * 4294967295/ 125000000]
R ead analog signal
f ≥fstop
Stop
Yes No
Saved max voltage value to cache
Start Frequency
Stop Frequency
Figure 5. Flow chart of algorithms.
can change the control method by changing the program inside the microcontroller. This is another important advantage of the proposed system.
3. Test and discussions 3.1. Affordable QTF sensor
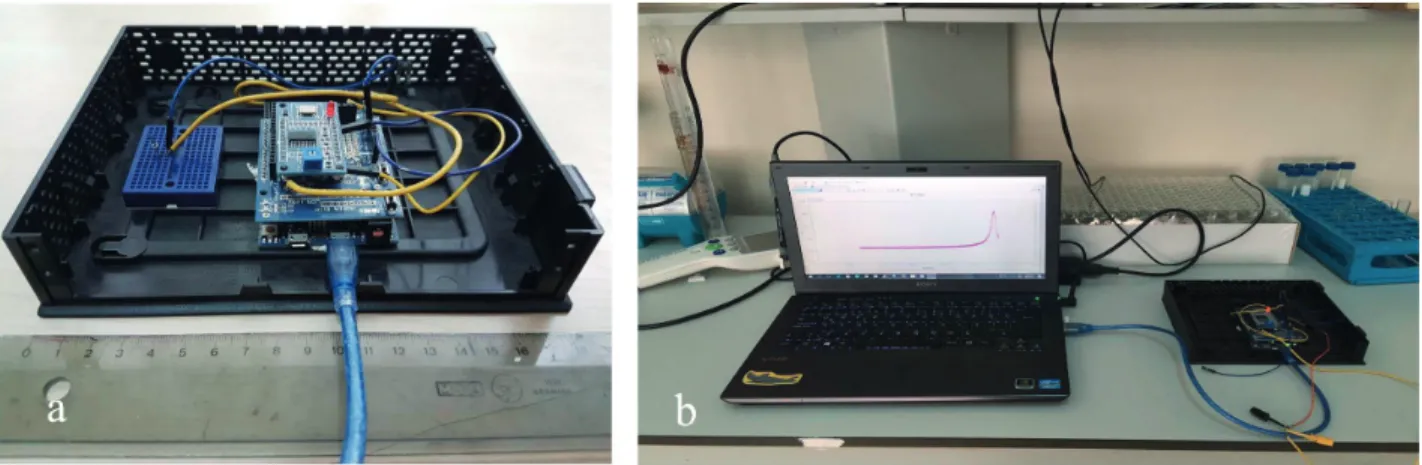
In the study, a sensor device is configured for which the hardware details are described in the text. Basically, the QTF measuring system has cost around $ 100–150, frequency synthesizer, microcontroller, and signal reader included. Consequently, a portable, lightweight, low-cost, and user-friendly QTF measuring system prototype has been developed. As given in Figure 6, the part which the QTF transducer can attach and detach from the sensor the dimensions of it is about 3 × 10 × 15 cm and it weighs about 300 g. The system given in Figures6a and 6b is capable of connecting to any display device (PC, notebook, smartphone, tablet, etc.). In this study generally a notebook has been used.
Figure 6. a- Configured QTF sensor. b- Connection to the notebook.
3.2. Testing and evaluation of temperature drift of QTF
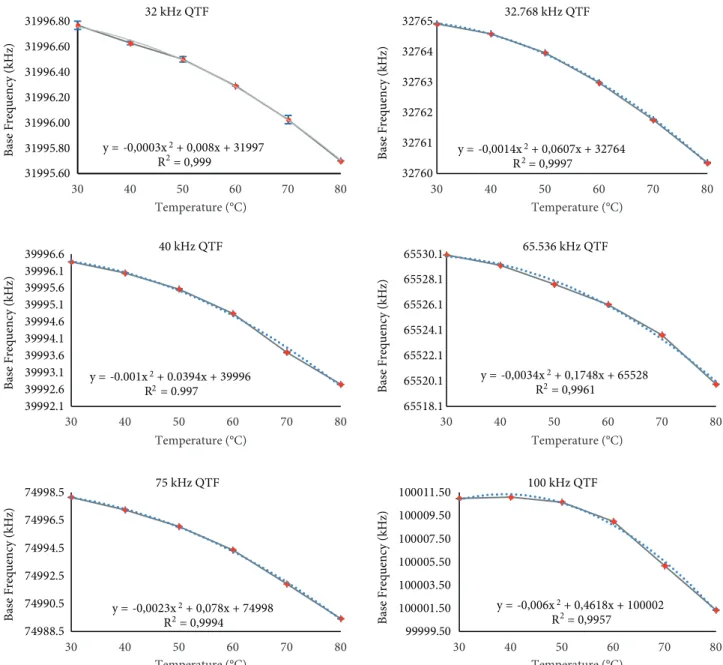
In this part, the steps and the results of the temperature change experiments have been presented. Firstly, the QTF (32 kHz, ECS Inc., USA ) was inserted into the heating chamber and connected to the AD9850 frequency output and analog input of Arduino DUE which is A0 in this study. It is important to note that the experiment started 45 min later, to allow the chamber to reach the target temperature and then to a steady state. The QTF reached the aimed temperature rather later than the heating chamber since the QTF sensor is covered by a metallic enclosure cap and it is under the vacuum. Each experiment started from 30 ◦C and carried out until 80 ◦C with 10 ◦C increments. For each temperature, the highest voltage value and its related frequency value is chosen from the frequency-voltage matrix. This is due to the resonant frequency drifts that occurs according to the temperature change, and this exclusive highest voltage value will point to the new drifted frequency. To demonstrate the temperature effect for other types of QTFs which have different base resonance frequency as mentioned before, (32, 32.768, 40, 65.536, 75, 100 Hz) were tested for their temperature change response by using the designed device each at a time. For each base resonance frequency, four QTFs were tested and each test have been repeated ten times; the related results are presented as follows. Figure7shows the effect of the increasing temperature on the base frequency for different QTF transducers with different base frequencies.
We have two main points to consider in Figure 7. The first one is that we observed a decline in the base frequency with increased temperature in all types of QTF transducers (32, 32.658, 40, 65.536, 75, 100 kHz). This result emphasizes that it is crucial to consider temperature correction in QTF sensors. This study contributes by conjecturing that this relationship can apply to the QTF sensor systems as well. This idea is demonstrated in this given case: a QTF transducer with 32.768 kHz is selected randomly. We observe that if the environmental temperature increases by 10 ◦C (from 30 ◦C to 40 ◦C) due to a change in the field conditions, the resonance frequency deviates by 3.41 Hz. This deviation might be misinterpreted as an increase of 3.4 ng mass loading. However, when this deviation is deducted from the observed mass the exact amount of the target analyte can be determined. Our sensor presents reliable results in various field conditions, which makes it a good candidate for sensor and biosensor implementations that require field studies (e.g., desert). The second point to take into consideration is that the standard deviations of base frequencies in all transducers are around 0.01, except for the 100 kHz QTF transducer. The error bars are almost invisible due to the low standard deviations. This presents a very stable response pattern from the QTFs and there is a very high fit of the model ( R2 =
y = -0,0003x2+ 0,008x + 31997 R = 0,999 31995.60 31995.80 31996.00 31996.20 31996.40 31996.60 31996.80 30 40 50 60 70 80 B as e F re q u en cy ( kHz) Temperature (°C) Temperature (°C) Temperature (°C) Temperature (°C) Temperature (°C) Temperature (°C) 32 kHz QTF y = -0,0014x2 2 2 2 2 2 2 + 0,0607x + 32764 R = 0,9997 32760 32761 32762 32763 32764 32765 30 40 50 60 70 80 B as e F re q u en cy ( kHz) 32.768 kHz QTF y = -0.001x2+ 0.0394x + 39996 R = 0.997 39992.1 39992.6 39993.1 39993.6 39994.1 39994.6 39995.1 39995.6 39996.1 39996.6 30 40 50 60 70 80 B as e F re q u en cy ( kHz) 40 kHz QTF y = -0,0034x2+ 0,1748x + 65528 R = 0,9961 65518.1 65520.1 65522.1 65524.1 65526.1 65528.1 65530.1 30 40 50 60 70 80 B as e F re q u en cy ( kHz) 65.536 kHz QTF y = -0,0023x2+ 0,078x + 74998 R = 0,9994 74988.5 74990.5 74992.5 74994.5 74996.5 74998.5 30 40 50 60 70 80 B as e F re q u en cy ( kHz) 75 kHz QTF y = -0,006x2+ 0,4618x + 100002 R = 0,9957 99999.50 100001.50 100003.50 100005.50 100007.50 100009.50 100011.50 30 40 50 60 70 80 B as e F re q u en cy ( kHz) 100 kHz QTF
Figure 7. Frequency measurements for changing temperatures; various QTF transducers with different base frequency.
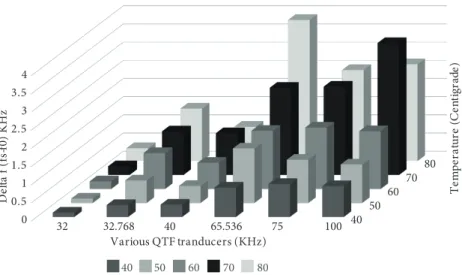
0.99). To sum up the previously given information, a frequency drift occurs with temperature change; however, the crucial point is that the drift has been detected to be stable and for each repetition, the drift respond has been determined to be the same. We observed very similar values with each repeated test temperature with a standard deviation value of ± <0.01%. Therefore, our QTF sensor device reports very similar values steadily between 30 ◦C and 80 ◦C, even if the environmental conditions change. The stability is a basic feature required in any sensor or biosensor implementation [41]. Figure8provides an alternative presentation of frequency-shift and temperature relationship. We presented the frequency shift (the difference between the base frequency and the observed frequency) for different QTF types and temperature. The effect of temperature on frequency shift is lowest for the QTF transducer with the base frequency of 32 kHz. It is interesting to note that the existing
40 50 60 70 80 0 0.5 1 1.5 2 2.5 3 3.5 4 32 32.768 40 65.536 75 100 T em p er a tur e ( C en ti gr ad e) D el ta f ( fs -f 0) K H z Various QTF tranducers (KHz) 40 50 60 70 80
Figure 8. Frequency reductions in different QTF converters and temperature conditions.
studies on QTF-based sensors/biosensors use transducers with 32.658 kHz instead of 32 kHz. In addition, for all QTF transducers, increased field temperature lead to higher frequency shifts; however, only with 40 and 100 kHz did the transducers respond with a lower frequency drifts at an increase from 60 ◦C to 80 ◦C. This points out how crucial it is to choose the right QTF transducer according to the environmental working conditions. It is fundamental to state that the frequency shifts that have been determined in this study are very low when compared to other types of mass-sensitive transducers (QCM) [33]. This indicates that QTF transducers are capable of being much more promoted when compared with other mass-sensitive transducers.
4. Conclusion
The previous studies that include QTF sensors that are summarized in detail are in experimental setup rather than a device setup and the disadvantages of them have already been described. In addition, expensive heavy hardware like impedance analyzer or data acquisition cards and computers that have been used in the mentioned studies are not suitable for a portable system design. On the contrary, the QTF sensor that we have developed is much more adaptable for in situ chemical sensor and biosensor applications since it is portable and low-cost. Due to being affordable and its stable temperature drift, the sensor has the potential to be preferred and widely used. When referred to previous studies, it can be stated that very few details have been shared and that there is a signal conversion as in AC signal is detected by converting to DC level. While the conversion might not create a problem measuring for only an approximate estimation, the data loss due to the conversion is a significant problem when applied to a biosensor that works in a picogram range. On the contrary, we propose that AC signal from the QTF being directly converted into digital data by sampling instead of bogus DC conversion. Owing to this direct sampling, only a small (but capable) microcontroller board (like a mobile phone size) is enough to make portable compact circuit, which is powered by the integrated display devices power source (i.e. battery) which eventually leads to lowering the cost of the device ($ 100–150 app). According to our investigations, so far this is the lowest production cost.
In addition, generally the drawings of the measurement systems are not included in detail and there are not any commercially produced devices. So far, our study presents the most detailed sensor device implementation/design of the hardware. Future studies might consider utilizing our proposed QTF sensor
with immobilization of antibodies or aptamers onto the transducer’s surface, which provides direct measuring without pretreatment of real samples and possibly leading to fast and specific measurement for trace analytes. Another important point is that the previous studies generally use QTF transducers with base frequency of 32.768 Hz. They do not explicitly state the underlying criteria for this selection. It is possible that QTFs with 32.768 kHz is easily available to researchers as it is also used in watches. QTFs which have different resonance frequencies can also work with our device. The ambient temperature effect has scientifically researched for various QTFs as opposed to current literature. Thus, various QTF’s which has got different resonance frequency have been tested with various temperatures precisely with well-defined drift. This is another unique point of our study. As our study reports reliable frequency values with varying level of temperature, the usage of QTF transducers in sensor or biosensor implementations for extreme field conditions may become more widespread. Especially when the biosensor is supposed to detect very small quantities of analyte, we should check for the effect of temperature changes on the measurement and take a preventive approach (such as chamber adaptation and signal processing). Finally, the sensor can be integrated to different displays, which enables the QTF sensor to be compatible with open sources technologies. Additionally the device can easily be adaptable to mobile phones and operating systems as well. As a result, this paper proposes a portable, low-cost, Internet of things (IoT)-ready and smart-phone-compatible QTF measurement device that can be used as a powerful biosensor device.
Acknowledgments
The authors would like to note that there has been a patent application and the results for the implantation part of the device is yet expected (Reference number: UCK/01TR-2016/05031). This publication also concerns the dissertation prepared by Mehmet Altay ÜNAL at the Biotechnology Institute of Ankara University, Turkey.
References [1] Scheller F. Biosensors. New York, NY, USA: Elsevier, 1992.
[2] Alocilja EC, Radke SM. Market analysis of biosensors for food safety. Biosensors and Bioelectronics 2003; 18: 841-846.
[3] Rodriguezmozaz S, Alda M, Marco M, Barcelo D. Biosensors for environmental monitoring: a global perspective. Talanta 2005; 65: 291-297.
[4] Kissinger PT. Biosensors—a perspective. Biosensors and Bioelectronics 2005; 20: 2512-2516. [5] Eggins BR. Chemical sensors and biosensors. Chichester, Hoboken, NJ, USA: J. Wiley, 2002.
[6] Su L, Jia W, Hou C, Lei Y. Microbial biosensors: a review. Biosensors and Bioelectronics 2011; 26: 1788-1799. [7] Arora P, Sindhu A, Dilbaghi N, Chaudhury A. Biosensors as innovative tools for the detection of food borne
pathogens. Biosensors and Bioelectronics 2011; 28: 1-12.
[8] Gooding JJ. Biosensor technology for detecting biological warfare agents: recent progress and future trends. Analytica Chimica Acta 2006; 559: 137-151.
[9] Wang Y-C, Cokeliler D, Gunasekaran S. Reduced graphene oxide/carbon nanotube/gold nanoparticles nanocompos-ite functionalized screen-printed electrode for sensitive electrochemical detection of endocrine disruptor bisphenol A. Electroanalysis 2015; 27: 2527-2536.
[10] Xu D, Huang X, Guo J, Ma X. Automatic smartphone-based microfluidic biosensor system at the point of care. Biosensors and Bioelectronics 2018; 110: 78-88.
[11] Zhang D, Liu Q. Biosensors and bioelectronics on smartphone for portable biochemical detection. Biosensors and Bioelectronics 2016; 75: 273-284.
[12] Tranh Minh C. Biosensors. London, England: Chapman and Hall, 1993.
[13] Yang JS. An introduction to the theory of piezoelectricity. New York, NY, USA: Springer, 2005.
[14] Heywang W, Lubitz K, Wersing W. Piezoelectricity: evolution and future of a technology. Berlin, Germany: Springer, 2008.
[15] Vijaya MS. Piezoelectric materials and devices applications in engineering and medical sciences. Boca Raton, FL, USA: CRC Press, 2013.
[16] Lucklum R, Eichelbaum F. Interface Circuits for QCM Sensors. In: Steinem C, Janshoff A, editors. Piezoelectric Sensors. Berlin, Germany: Springer, 2007. pp. 3-47.
[17] Arnau V. Piezoelectric transducers and applications. Berlin, Germany: Springer, 2008.
[18] Yang J. Basic equations. In: Yang J, editors. Special Topics in the Theory of Piezoelectricity. New York, NY, USA: Springer, 2000. pp. 1-12.
[19] Vlassov S, Scheler O, Plaado M, Lõhmus L, Kurg A, Saal K, Kink I. Integrated carbon nanotube fibre–quartz tuning fork biosensor. Proceedings of the Estonian Academy of Sciences 2012; 61: 48-51.
[20] Zhang J, O’Shea S. Tuning forks as micromechanical mass sensitive sensors for bio- or liquid detection. Sensors and Actuators B: Chemical 2003; 94: 65-72.
[21] Friedt J-M, Carry É. Introduction to the quartz tuning fork. American Journal of Physics 2007; 75: 415-422. [22] Su X, Dai C, Zhang J, O’Shea SJ. Quartz tuning fork biosensor. Biosensors and Bioelectronics 2002; 17: 111-117. [23] Zhou X, Jiang T, Zhang J, Wang X, Zhu Z. Humidity sensor based on quartz tuning fork coated with sol–gel-derived
nanocrystalline zinc oxide thin film. Sensors and Actuators B: Chemical 2007; 123: 299-305.
[24] Ma J, Xu J, Duan J, Xu H. Micro-temperature sensor based on quartz tuning fork resonator. Research Journal of Applied Sciences, Engineering and Technology 2013; 5: 1232-1237.
[25] Jayapandian J, Swarrup JS, Sheela OK, Ravi U. PSoC-based embedded design and quartz tuning fork for low-temperature measurement system design. Journal of Laboratory Automation 2012; 17: 144-154.
[26] Xu J, Li X, Duan J, Xu H. High-precision low-power quartz tuning fork temperature sensor with optimized resonance excitation. Journal of Zhejiang University SCIENCE C 2013; 14: 264-273.
[27] Xu J, Sun G, Ma J, Li X. Implement and Research on the Miniature Quartz Tuning Fork Temperature Sensor. Sensors and Transducers 2014; 176: 13-20.
[28] Gula G, Waszczuk K, Olszak T, Majewska J, Gotszalk T, Drulis-Kawa Z, Gutowicz J. Piezoelectric tuning fork mass sensors as a novel tool for determination of antibiotic activity on Pseudomonas aeruginosa biofilm. Procedia Engineering 2011; 25: 980-983.
[29] Waszczuk K, Gula G, Swiatkowski M, Olszewski J, drulis-Kawa Z, Gutowicz J, Gotszalk T. Evaluation of Pseu-domonas aeruginosa biofilm formation using piezoelectric tuning forks mass sensors. Procedia Engineering 2010; 5: 820-823.
[30] Otero J, Baños R, González L, Torrents E, Juárez A, Puig-Vidal M. Quartz tuning fork studies on the surface properties of Pseudomonas aeruginosa during early stages of biofilm formation. Colloids and Surfaces B: Biointerfaces 2013; 102: 117-123.
[31] Piasecki T, Guła G, Waszczuk K, Drulis-Kawa Z, Gotszalk T. Quartz tuning fork as in-situ sensor of bacterial biofilm. Procedia Engineering 2014; 87: 369-372.
[32] Chałupniak A, Waszczuk K, Hałubek-Głuchowska K, Piasecki T, Gotszalk T, Rybka J. Application of quartz tuning forks for detection of endotoxins and Gram-negative bacterial cells by monitoring of Limulus Amebocyte Lysate coagulation. Biosensors and Bioelectronics 2014; 58: 132-137.
[33] Kocum C, Erdamar A, Ayhan H. Design of temperature controlled quartz crystal microbalance system. Instrumen-tation Science and Technology 2009; 38: 39-51.
[34] González L, Otero J, Cabezas G, Puig-Vidal M. Electronic driver with amplitude and quality factor control to adjust the response of quartz tuning fork sensors in atomic force microscopy applications. Sensors and Actuators A: Physical 2012; 184: 112-118.
[35] Mecea VM, Carlsson JO, Heszler P, Bârtan M. Development and testing of a high temperature quartz crystal microbalance. Vacuum 1995; 46: 691-694.
[36] Ziegler C. Cantilever-based biosensors. Analytical and Bioanalytical Chemistry 2004; 379: 946-959.
[37] Blaauwgeers R, Blazkova M, Človečko M et al. Quartz tuning fork: thermometer, pressure- and viscometer for helium liquids. Journal of Low Temperature Physics 2007; 146: 537-562.
[38] Wang R, Tsow F, Zhang X et al. Real-time ozone detection based on a microfabricated quartz crystal tuning fork sensor. Sensors 2009; 9: 5655-5663.
[39] Amine A, Mohammadi H, Bourais I, Palleschi G. Enzyme inhibition-based biosensors for food safety and environ-mental monitoring. Biosensors and Bioelectronics 2006; 21: 1405-1423.
[40] Rogers K. Biosensors for environmental applications. Biosensors and Bioelectronics 1995; 10: 533-541.
[41] Grieshaber D, MacKenzie R, Vörös J, Reimhult E. Electrochemical biosensors - sensor principles and architectures. Sensors 2008; 8: 1400-1458.