JHEP07(2019)142
Published for SISSA by SpringerReceived: March 11, 2019 Revised: June 24, 2019 Accepted: July 10, 2019 Published: July 24, 2019
Search for charged Higgs bosons in the H
±→ τ
±ν
τdecay channel in proton-proton collisions at
√
s = 13 TeV
The CMS collaboration
E-mail: [email protected]
Abstract: A search is presented for charged Higgs bosons in the H±→ τ±ντ decay mode
in the hadronic final state and in final states with an electron or a muon. The search is based on proton-proton collision data recorded by the CMS experiment in 2016 at a
center-of-mass energy of 13 TeV, corresponding to an integrated luminosity of 35.9 fb−1.
The results agree with the background expectation from the standard model. Upper limits at 95% confidence level are set on the production cross section times branching fraction to
τ±ντ for an H± in the mass range of 80 GeV to 3 TeV, including the region near the top
quark mass. The observed limit ranges from 6 pb at 80 GeV to 5 fb at 3 TeV. The limits are
interpreted in the context of the minimal supersymmetric standard model mmod−h scenario.
Keywords: Hadron-Hadron scattering (experiments), Higgs physics
JHEP07(2019)142
Contents 1 Introduction 1 2 The CMS detector 3 3 Event simulation 4 4 Event reconstruction 5 5 Event selection 75.1 Hadronic final state (τh + jets) 8
5.2 Leptonic final state with a hadronically decaying tau lepton (` + τh) 9
5.3 Leptonic final state without a hadronically decaying tau lepton (` + no τh) 10
6 Background estimation 11 7 Systematic uncertainties 12 8 Results 15 9 Summary 18 The CMS collaboration 27 1 Introduction
In 2012, the ATLAS and CMS experiments observed a resonance consistent with the Higgs
boson with a mass of approximately 125 GeV at the CERN LHC [1–3], providing strong
evidence for spontaneous symmetry breaking via the Brout-Englert-Higgs mechanism [4–9].
The observation was followed by precision measurements of the mass, couplings, and CP quantum numbers of the new boson, which were found to be consistent with the predictions
of the standard model (SM) of particle physics [10–14].
Several extensions of the SM predict a more complex Higgs sector with several Higgs fields, yielding a spectrum of Higgs bosons with different masses, charges, and other prop-erties. These models are constrained, but not excluded, by the measured properties of the 125 GeV boson. The observation of additional Higgs bosons would provide unequivocal evidence for the existence of physics beyond the SM. Two-Higgs-doublet models (2HDMs)
predict five different Higgs bosons: two neutral CP-even particles h and H (with mh ≤ mH),
one neutral CP-odd particle A, and two charged Higgs bosons H± [15].
The 2HDMs are classified into different types, depending on the coupling of the two Higgs doublets to fermions. This search is interpreted in the context of the “type II” 2HDM,
JHEP07(2019)142
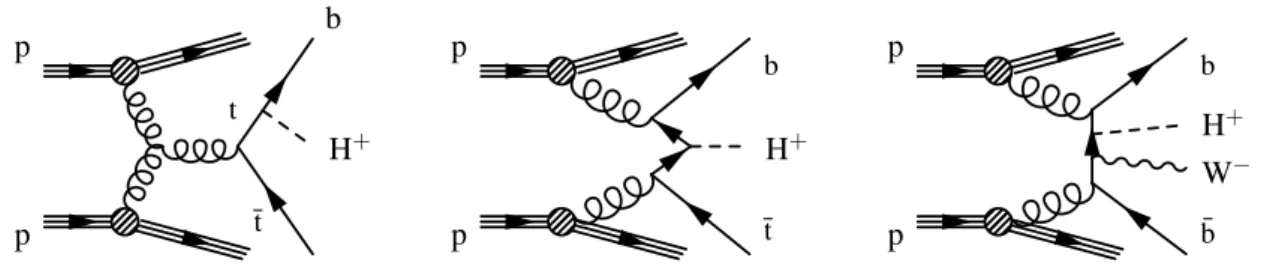
¯t t p p H+ b p p H+ ¯t b p p ¯b W− H+ bFigure 1. Leading order diagrams describing charged Higgs boson production. Double-resonant top quark production (left) is the dominant process for light H±, whereas the single-resonant top quark production (middle) dominates for heavy H± masses. For the intermediate region (mH± ∼ mt),
both production modes and their interplay with the nonresonant top quark production (right) must be taken into account. Charge-conjugate processes are implied.
where one doublet couples to down-type quarks and charged leptons, and the other to up-type quarks. The minimal supersymmetric standard model (MSSM) Higgs sector is a up-type
II 2HDM [16]. At tree level, the Higgs sector of a type II 2HDM can be described with
two parameters. In the context of H± searches, they are conventionally chosen to be the
mass of the charged Higgs boson (mH±) and the ratio of the vacuum expectation values
of the two Higgs doublets, denoted as tan β. Charged Higgs bosons are also predicted by
more complex models, such as triplet models [17–19].
The dominant production mechanism of the H± depends on its mass. Examples of
leading order (LO) diagrams describing the H± production in 2HDM in different mass
regions are shown in figure 1. Light H±, with a mass smaller than the mass difference
between the top and the bottom quarks (mH± < mt− mb), are predominantly produced
in decays of top quarks (double-resonant top quark production, figure 1 left), whereas
heavy H±(mH± > mt− mb) are produced in association with a top quark as pp→ tbH±
(single-resonant top quark production, figure1middle). In the intermediate region near the
mass of the top quark (mH± ∼ mt), the nonresonant top quark production mode (figure 1
right) also contributes and the full pp → H±W∓bb process must be calculated in order to
correctly account for all three production mechanisms and their interference [20].
In type II 2HDM, a light H±decays almost exclusively to a tau lepton and a neutrino.
For the heavy H±, the decay into top and bottom quarks (H+ → tb and H− → tb,
together denoted as H±→ tb) is dominant, but since the coupling of the H± to leptons is
proportional to tan β, the branching fraction to a tau lepton and a neutrino (H+→ τ+ντ
and H−→ τ−ντ, together denoted as H± → τ±ντ) remains sizable for large values of tan β.
Direct searches for H±have been performed at LEP [21], at the Fermilab Tevatron [22,
23], and by the LHC experiments. The ATLAS and CMS Collaborations have covered
several H± decay channels, such as τ±ντ [24–30], t b [28, 31, 32], c s [33, 34], c b [35]
and W±Z [36, 37], in their previous searches at center-of-mass energies of 7, 8, or 13 TeV.
Additionally, the ATLAS and CMS results on searches for additional neutral Higgs bosons
have been interpreted in the 2HDM parameter space, constraining the allowed H± mass
JHEP07(2019)142
In this paper, a direct search for H± decaying into a tau lepton and a neutrino is
presented, based on data collected at a center-of-mass energy of 13 TeV by the CMS
ex-periment in 2016, corresponding to an integrated luminosity of 35.9 fb−1. The search is
conducted in three different final states, labeled in this paper as the hadronic final state
(τh + jets, where τh denotes a hadronically decaying tau lepton), the leptonic final state
with a τh(` + τh), and the leptonic final state without a τh (` + no τh). For the hadronic
final state, events contain a τh, missing transverse momentum due to neutrinos, and
ad-ditional hadronic jets from top quark decays and b quarks. The leptonic final state with
a τh contains a single isolated lepton (electron or muon), missing transverse momentum,
hadronic jets and a τh. The leptonic final state without a τh is defined in a similar way,
ex-cept that events with a τh are rejected. In the leptonic final states, the lepton can originate
either from the decays of the tau leptons from H± decays, or from a W± boson decay.
In each final state, events are further classified into different categories for statistical analysis. A transverse mass distribution is reconstructed in each category of each final state
and used in a maximum likelihood fit to search for an H±signal. The H±mass range from
80 GeV to 3 TeV is covered in the search, including the intermediate mass range near mt.
This paper is organized as follows. The CMS detector is briefly presented in section 2.
The methods used in event simulation and reconstruction are described in sections3and4,
respectively. The event selection and categorization criteria are presented in section5, while
section 6 details the background estimation methods used in the analysis. Systematic
uncertainties included in the analysis are described in section 7. Finally, the results are
presented in section 8 and summarized in section9.
2 The CMS detector
The central feature of the CMS apparatus is a superconducting solenoid of 6 m internal diameter, providing a magnetic field of 3.8 T. Within the solenoid volume are a silicon pixel and strip tracker, a lead tungstate crystal electromagnetic calorimeter (ECAL), and a brass and scintillator hadron calorimeter, each composed of a barrel and two endcap sections. Forward calorimeters extend the pseudorapidity (η) coverage provided by the barrel and
endcap detectors up to|η| = 5. Muons are detected in gas-ionization chambers embedded
in the steel flux-return yoke outside the solenoid. Events of interest are selected using a
two-tiered trigger system [42]. The first level, composed of custom hardware processors,
uses information from the calorimeters and muon detectors to select events at a rate of around 100 kHz within a time interval of less than 4 µs. The second level, known as the high-level trigger (HLT), consists of a farm of processors running a version of the full event reconstruction software optimized for fast processing, and reduces the event rate to around 1 kHz before data storage. A more detailed description of the CMS detector, together with a definition of the coordinate system used and the relevant kinematic variables, can be
JHEP07(2019)142
3 Event simulation
The signal samples for the light H± mass values from 80 to 160 GeV are generated at
next-to-leading order (NLO) with the MadGraph5 amc@nlo v2.3.3 [44] generator, assuming
H±production via top quark decay (pp→ H±W∓bb). For the heavy H± mass range from
180 GeV to 3 TeV, the same approach is used except that H±production via pp → tbH±is
assumed. For the intermediate mass range from 165 to 175 GeV, the samples are generated
at LO using the MadGraph5 amc@nlo v2.3.3 with the model described in ref. [20], which
is available only at LO.
The effect of using LO instead of NLO samples is estimated by comparing kinematic distributions and final event yields from both types of samples in mass regions below (150–160 GeV) and above (180–220 GeV) the intermediate range. Significant differences are observed in some kinematic variables such as jet multiplicity, affecting the selection
efficiency and the predicted final signal yield. Since the shapes of the final mT distributions
are found to be compatible between the LO and the NLO samples, a LO-to-NLO correction is performed by scaling the final signal event yield from each intermediate-mass sample. The overall effect of the correction is to scale down the signal event yield, resulting in more conservative results than would be obtained using LO samples without this correction.
The NLO/LO signal yield ratios are similar for all mass points within the 150–160 GeV and 180–200 GeV mass regions, but different between these two regions. Thus the correction factor for each final state and event category is calculated as an average over the NLO/LO ratios of the final event yields. This is done separately for the 150–160 GeV and 180– 200 GeV regions, and the correction derived in the 150–160 GeV region is applied to the
intermediate signal sample with mH± = 165 GeV, for which m
H± < mt − mb and the
H± production is still dominated by top quark decays, while the correction derived in the
180–200 GeV region is applied to the 170 and 175 GeV samples with mH± > mt− mb. For
all signal samples up to mH± = 500 GeV, MadSpin [45] is used to model the H± decay,
while pythia 8.212 is used above 500 GeV.
In the leptonic final states, where accurate modeling of jet multiplicity is needed for the
correct categorization of events, the MadGraph5 amc@nlo v2.2.2 generator [44] is used
to simulate the tt events at NLO. In the hadronic final state, the statistical uncertainty in
the final event yield needs to be minimized for reliable modeling of the mTshape of the tt
background, and thus a larger sample generated using powheg v2.0 [46–50] with FxFx jet
matching and merging [51] is used to model this background. The powheg v2.0 generator
is used to model single top quark production via t-channel and t W production [52,53],
while the MadGraph5 amc@nlo v2.2.2 generator is used for the s-channel production.
The value of mt is set to 172.5 GeV for all tt and single top quark samples. The W +jets
and Z/γ∗ events are generated at LO using MadGraph5 amc@nlo v2.2.2 with up to four
noncollinear partons in the final state [54]. The diboson processes (WW, WZ, ZZ) are
simulated using pythia 8.212.
The simulated samples are normalized to the theoretical cross sections for the corre-sponding processes. For the tt background and the single top quark background in the
JHEP07(2019)142
NLO precision calculations are used for single top quark production in the t channel, and
for the W +jets, Z/γ∗, and diboson processes [56–59].
For all simulated samples, the NNPDF3.0 parton distribution functions (PDFs) [60] are
used, and the generators are interfaced with pythia 8.212 to model the parton showering, fragmentation, and the decay of the tau leptons. The pythia parameters affecting the
description of the underlying event are set to the CUETP8M1 tune [61] for all processes
except tt, for which a customized CUETP8M2T4 tune [62] is used.
Generated events are processed through a simulation of the CMS detector based on the
Geant4 v9.4 software [63], and they are reconstructed following the same algorithms that
are used for data. The effect of additional soft inelastic proton-proton (pp) interactions (pileup) is modeled by generating minimum bias collision events with pythia and mixing them with the simulated hard scattering events. The effects from multiple inelastic pp collisions occurring per bunch crossing (in-time pileup), as well as the effect of inelastic collisions happening in the preceding and subsequent bunch crossings (out-of-time pileup) are taken into account. The simulated events are weighted such that the final pileup distribution matches the one observed in data. For the data collected in 2016, an average of approximately 23 interactions per bunch crossing was measured.
4 Event reconstruction
Event reconstruction is based on the particle-flow (PF) algorithm [64] that aims to
recon-struct and identify each individual particle in an event with an optimized combination of information from the various elements of the CMS detector. The output of the PF algo-rithm is a set of PF candidates, classified into muons, electrons, photons, and charged and neutral hadrons.
The collision vertices are reconstructed from particle tracks using the deterministic
annealing algorithm [65]. The reconstructed vertex with the largest value of the
physics-object transverse momentum squared (p2T) sum is taken to be the primary p p interaction
vertex. The physics objects in this case are the jets, clustered using the anti-kT jet finding
algorithm [66, 67] with the tracks assigned to the vertex as inputs, and the associated
missing transverse momentum, calculated as the negative vector sum of the pT of those
jets. All other reconstructed vertices are attributed to pileup.
Electrons are reconstructed and their momentum is estimated by combining the mo-mentum measurement from the tracker at the interaction vertex with the energy measure-ment in the ECAL. The energy of the corresponding ECAL cluster and the energy sum of all bremsstrahlung photons spatially compatible with originating from the electron tracks
are taken into account. The momentum resolution for electrons with pT ≈ 45 GeV from
Z→ ee decays ranges from 1.7% for nonshowering electrons in the barrel region to 4.5% for
showering electrons in the endcaps [68]. In addition, electrons are required to pass an
iden-tification requirement based on a multivariate discriminant that combines several variables describing the shape of the energy deposits in the ECAL, as well as the direction and
JHEP07(2019)142
for tt events is used to select events with an electron, while a loose working point with 95% efficiency is used to veto events with one or several electrons, depending on the final state. Muons are identified as tracks in the central tracker, consistent with either a track or several hits in the muon chambers, and associated with calorimeter deposits compatible
with the muon hypothesis [70]. The momenta of muons are obtained from the curvatures
of the corresponding tracks. Contributions from other particles misidentified as muons are suppressed with a discriminant based on the track fit quality. Two working points as
defined in ref. [70] are used: a medium working point with 97% identification efficiency is
used to select events with a muon, while a loose working point with >99% identification efficiency is used for vetoing muons.
The background contributions from nonprompt and misidentified leptons are sup-pressed by requiring the leptons to be isolated from hadronic activity in the event. For
this purpose, an isolation discriminant is defined as the pT sum of the PF candidates
in a cone around the lepton, divided by the pT of the lepton. For optimal performance
across the lepton momentum range, the cone size is varied with the lepton pT as ∆R =
p
(∆η)2+ (∆φ)2 = 10 GeV/min(max(pT,50 GeV), 200 GeV), where ∆φ denotes a
differ-ence in azimuthal angle, leading to cone radii from 0.05 to 0.20. A tight (loose) isolation criterion with discriminant < 0.1 (0.4) is used in lepton selection (veto).
For each event, hadronic jets are clustered from the reconstructed PF candidates using
the infrared and collinear safe anti-kT algorithm [66, 67] with a distance parameter of
0.4. The jet momentum is determined as the vectorial sum of all particle momenta in the jet, and is found from simulation to be within 5 to 10% of the true momentum over the
whole pT spectrum and detector acceptance. Pileup can contribute additional tracks and
calorimetric energy deposits to the jet momentum. To mitigate this effect, tracks identified as originating from pileup vertices are discarded and an offset correction is applied to correct for remaining contributions. Jet energy corrections are derived from simulation to bring the measured response of jets to that of particle level jets on average. In situ measurements of the momentum balance in dijet, photon+jet, Z+jet, and multijet events are used to account
for any residual differences in jet energy scale between data and simulation [71]. The jet
energy resolution amounts typically to 15% at 10 GeV, 8% at 100 GeV, and 4% at 1 TeV [72].
Additional selection criteria are applied to each jet to remove jets potentially dominated by anomalous contributions from various subdetector components or reconstruction failures.
Jets originating from the hadronization of b quarks (b jets) are identified using the
combined secondary vertex algorithm [73,74], which uses information on the decay vertices
of long-lived hadrons and the impact parameters of charged particle tracks as input to a neural network discriminant. The working point is chosen such that the probability to misidentify jets originating from light-flavor quarks or gluons (c quarks) as b jets is 1% (12%), corresponding to 63% efficiency for the selection of genuine b jets in tt events. Simulated samples are corrected for differences in b jet identification and misidentification efficiency compared to the data.
The τh are reconstructed with the hadron-plus-strips algorithm [75, 76], which uses
JHEP07(2019)142
decay modes with one charged pion and up to two neutral pions (one-prong), or three charged pions (three-prong). Since neutral pions decay promptly to a photon pair, they
are reconstructed by defining strips of ECAL energy deposits in the η-φ plane. The τh
candidates are rejected if they are consistent with the hypothesis of being muons or
elec-trons misidentified as τh. The jets originating from the hadronization of quarks or gluons
misidentified as τh are suppressed using a multivariate discriminant [76]. It combines
in-formation on τh isolation, based on the surrounding hadronic activity, and on its lifetime,
inferred from the tracks of the τhdecay products. A loose working point is used for this
dis-criminant, corresponding to≈50% identification efficiency, determined from Z/γ∗→ τ+τ−
events, and 3× 10⁻³ probability for misidentifying a jet as a τh, determined from quantum
chromodynamics (QCD) multijet events. A correction to the energy scale is derived using
eτh and µτh final states of Z/γ∗ → τ+τ− events [76] and applied in simulated samples.
The missing transverse momentum (~pTmiss) is defined as the negative vector sum of the
pT of all reconstructed PF candidates [77]. The energy scale corrections applied to jets and
τh are propagated to the ~pTmiss.
The transverse mass is defined as
mT(τh/`) = q 2pT(τh/`)p miss T [1− cos ∆φ(~pT(τh/`), ~p miss T )], (4.1)
where ` is a generic symbol used to label the electron or muon present in the leptonic final
states, while the leading τh is used in the mT in the hadronic final state.
5 Event selection
The search is conducted in three exclusive final states:
• τh + jets: hadronic final state (events with an electron or a muon are vetoed);
• ` + τh: leptonic final state with a hadronically decaying tau lepton (events with
additional electrons or muons are vetoed); and
• ` + no τh: leptonic final state without a hadronically decaying tau lepton (events
with a τh or additional electrons or muons are vetoed).
In the low-mH± region, below mt, the sensitivity of the hadronic final state is limited
by the relatively high trigger thresholds, making the leptonic final states most sensitive for
the H± signal. In the high-mH± region, above mt, the hadronic final state dominates the
sensitivity, since the selection efficiency is higher as a result of more inclusive jet multiplicity requirements.
The event selection and categorization strategies are chosen separately for each final state to efficiently discriminate against the background events, while ensuring a sufficient signal selection efficiency.
JHEP07(2019)142
5.1 Hadronic final state (τh + jets)
An HLT algorithm requiring the presence of a τhcandidate and trigger-level missing
trans-verse momentum estimated from calorimeter information (pmiss,caloT ) is used to select the
events for offline analysis. The trigger requires the τhcandidate to be loosely isolated with
pT >50 GeV and|η| < 2.1, and with a leading track transverse momentum ptrackT >30 GeV.
The pmiss,caloT is required to be larger than 90 GeV.
The trigger efficiencies for the τh and p
miss,calo
T requirements are measured separately.
The efficiency of the τh part of the trigger is determined with the tag-and-probe
tech-nique [78], using Z/γ∗ → τ+τ− events with one hadronic and one muonic tau lepton
decay. The efficiency is found to vary between 50 and 100%, as a function of pT and η
of the τh. The efficiency of the pmiss,caloT part of the trigger is measured from events with
a signal-like topology selected with a single-τh trigger, resulting in efficiencies between 10
and 100%, depending on the value of the pmissT . The simulated events are corrected to
match the trigger efficiencies measured in the data.
In the offline selection, low thresholds for the pT of the reconstructed τh and p
miss T are
needed to maximize the sensitivity for light H±. Thus selection criteria identical to those
in the HLT are applied to the reconstructed τh candidate and to the pmissT . The one-prong
τh candidates, corresponding to τ decays into a charged pion and up to two neutral pions,
are selected for further analysis. Events are required to contain at least three jets with
pT >30 GeV and|η| < 4.7, separated from the reconstructed τhby ∆R > 0.5. At least one
of the jets is required to pass the b jet identification with|η| < 2.4. Any event with isolated
electrons (muons) with pT>15(10) GeV,|η| < 2.5, and passing the loose identification and
isolation criteria is rejected.
To suppress the background from QCD multijet events with a jet misidentified as a
τh, an additional selection based on ∆φ(τh, pmissT ) and ∆φ(jetn, p
miss
T ) is applied, where the
index n runs over the three highest pTjets (jetn) in the event. QCD multijet events passing
the previous selection steps typically contain a hadronic jet misidentified as a τh, another
hadronic jet recoiling in the opposite direction, and ~pTmiss arising from the mismeasurement
of the jet momenta. These events can be suppressed with an angular discriminant defined as
Rminbb = min
n
(r h
180◦− ∆φ(τh, ~pTmiss)i2+h∆φ(jetn, ~pTmiss)i2
)
. (5.1)
The selected events are required to have Rminbb >40
◦
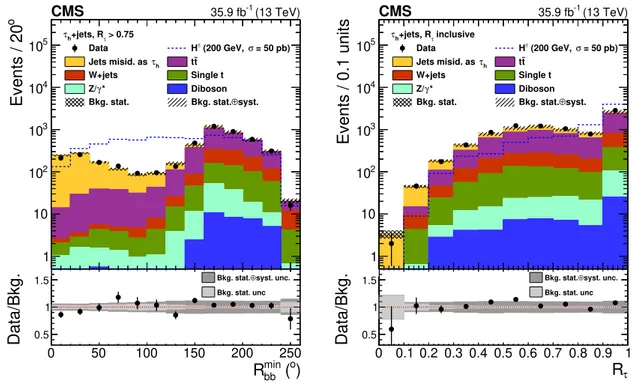
. The distribution of the Rminbb variable
after all other selections is shown in figure 2(left).
The selected events are classified into two categories based on the value of the variable Rτ = ptrackT /p
τh
T , reflecting the helicity correlations emerging from the opposite polarization
states of the tau leptons originating from W± and H±decays [79]. The distribution of the
Rτ variable is shown in figure2(right). After all other selections, most of the signal events
have a large value of Rτ, and the high-Rτ category provides a good signal-to-background
ratio. For large mH± values, the signal events are more evenly distributed between the two
JHEP07(2019)142
0 50 100 150 200 250 ) o ( min bb R 0.5 1 1.5 Data/Bkg. syst. unc. ⊕ Bkg. stat. Bkg. stat. unc 1 10 2 10 3 10 4 10 5 10 o Events / 20 > 0.75 τ +jets, R h τ Data H± (200 GeV, σ = 50 pb) h τ Jets misid. as tt W+jets Single t * γ Z/ DibosonBkg. stat. Bkg. stat.⊕syst.
(13 TeV) -1 35.9 fb CMS 0 0.1 0.2 0.3 0.4 0.5 0.6 0.7 0.8 0.9 1 τ R 0.5 1 1.5 Data/Bkg. syst. unc. ⊕ Bkg. stat. Bkg. stat. unc 1 10 2 10 3 10 4 10 5 10 Events / 0.1 units inclusive τ +jets, R h τ Data H± (200 GeV, σ = 50 pb) h τ Jets misid. as tt W+jets Single t * γ Z/ Diboson
Bkg. stat. Bkg. stat.⊕syst.
(13 TeV)
-1
35.9 fb
CMS
Figure 2. The distribution of the angular discriminant Rminbb after all other selections including the Rτ = p
track
T /p
τh
T > 0.75 requirement have been applied (left), and the distribution of the Rτ
variable used for categorization after all other selections including the Rminbb >40◦requirement have been applied (right).
analysis further improves the sensitivity for the heavy H±. Separating the two categories
at Rτ = 0.75 maximizes the signal sensitivity across the mH± range.
5.2 Leptonic final state with a hadronically decaying tau lepton (` + τh)
Single-lepton trigger algorithms are used for the online selection of events with isolated electrons or muons. Several HLT algorithms for electron (muon) selection with different
thresholds starting from 27 (24) GeV, with |η| < 2.1 (2.4) and with different isolation
criteria, are used in or combination to maximize the efficiency across the lepton pT range.
In the offline selection, electrons (muons) are required to have pT > 35(30) GeV and
|η| < 2.1(2.4) because of trigger constraints. Electrons (muons) are required to pass the tight (medium) identification and tight isolation requirements. Events with any additional
electrons (muons) with pT > 10 GeV and |η| < 2.1(2.4) that pass the loose identification
and isolation criteria are vetoed. Efficiencies for online and offline identification of leptons are measured, and the simulated events are corrected to match the efficiencies observed
in data. The presence of a τh is required, with pT > 20 GeV, |η| < 2.3, and with a ∆R
separation of at least 0.5 with respect to the lepton.
One, two, or three jets are required with pT >30 GeV and |η| < 2.4, separated from
the lepton and the τh by ∆R > 0.5. At least one of the jets is required to pass the b
JHEP07(2019)142
required to be at least 70 GeV. The background contribution from events with muons
originating from b hadron decays is suppressed by requiring ∆φ(`, ~pTmiss) to exceed 0.5.
The selected events are classified into several categories for statistical analysis. Three categories are defined based on the jet multiplicity and the number of jets passing the
b jet identification: 1j1b (one jet that is also identified as a b jet), ≥2j1b, and ≥2j≥2b.
A second categorization is performed in bins of pmissT : 70–100, 100–150, and >150 GeV.
Together with the separate electron and muon final states, this results in 18 categories.
The signal-to-background ratio in different categories varies with H± mass, as jet
categories with two jets and high pmissT become more sensitive for higher mH± values. The
background-enriched categories allow a precise determination of the background yields with a fit to data and extrapolation of this information to signal regions. The categorization is
found to improve the expected sensitivity significantly, especially in the low-mH± region,
where efficient discrimination against backgrounds is essential.
5.3 Leptonic final state without a hadronically decaying tau lepton (` + no τh)
The event selection criteria for the ` + no τh final state are identical to those described
in section 5.2 for the ` + τh final state, except for the following requirements. An event
is vetoed if it contains a τh with pT > 20 GeV, |η| < 2.3, and with a ∆R separation of
at least 0.5 with respect to the lepton. Two or three jets are required, each jet separated from the lepton by ∆R > 0.5. Higher jet multiplicities are not selected, because they are
expected to be more sensitive in searches for other H±decay modes, such as H±→ tb. At
least one of the jets is required to pass the b jet identification.
The number of QCD multijet events with jets misidentified as leptons is reduced to a
negligible level by requiring a high pmissT of >100 GeV and by applying the following angular
selections:
• ∆φ(`, ~pTmiss) > 0.5;
• ∆φ(leading jet, ~pTmiss) > 0.5; and
• min(∆φ(`, jetn)) < π− 0.5,
where jetnrefers to any of the selected jets in the events. The first criterion is identical to
the one applied in the ` + τh final state against muons from b hadron decays whereas the
second discriminates efficiently against the QCD multijet background. The last requirement is designed to reject background events where all the jets are back-to-back with respect to the selected lepton.
To further enhance the signal sensitivity and to constrain the backgrounds, a similar
categorization as in the ` + τh final state is established. Four categories are used based
on jet multiplicity and the number of jets passing the b jet identification: 2j1b, 2j2b, 3j1b,
and 3j≥2b, followed by two categories in pmissT : 100–150 and >150 GeV. Together with the
separate electron and muon final states, this results in 16 categories.
JHEP07(2019)142
Selection τh+ jets ` + τh ` + no τh Trigger τh+p miss,calo T single e or single µ † Number of τhcandidates ≥1 ≥1 0 τhpT pT> 50 GeV, p track T > 30 GeV pT> 20 GeV — τh|η| |η| < 2.1 |η| < 2.3 —Number of electrons and muons 0 1e or 1 µ (exclusively) †
Electron pT — pT> 35 GeV †
Electron |η| — |η| < 2.1 †
Muon pT — pT> 30 GeV †
Muon |η| — |η| < 2.4 †
Number of jets (incl. b jets) ≥3 jets 1–3 jets 2–3 jets
Jet pT pT> 30 GeV pT> 30 GeV †
Jet |η| |η| < 4.7 |η| < 2.4 †
Number of b jets ≥1 b jets 1–3 b jets †
b jet |η| |η| < 2.4 |η| < 2.4 † pmissT p miss T > 90 GeV p miss T > 70 GeV p miss T > 100 GeV
Angular selections Rminbb > 40 ◦
∆φ(`, pmissT ) > 0.5 ∆φ(`, ~p miss T ) > 0.5,
(` = e or µ) ∆φ(leading jet, ~pTmiss) > 0.5,
min(∆φ(`, jetn)) < π − 0.5 Table 1. A summary of the event selection criteria applied in each final state. The electrons, muons, τh candidates and jets are required to be separated from each other by ∆R > 0.5 in all final states. The † symbol means that the selection is identical between ` + τh and ` + no τh final states. In all final states, events with additional electrons or muons are vetoed as detailed in section5. In this table, “b jets” refers to all jets passing the b jet identification, and jetn refers to any of the selected jets.
6 Background estimation
The dominant background processes in the hadronic final state are QCD multijet and tt production. Other backgrounds are single top quark production, W boson production in
association with jets, Z/γ∗processes, and diboson production. We refer to tt and single top
quark events as “top events”, and to W +jets, Z/γ∗, and diboson events as “electroweak
events”. The backgrounds from events containing either a genuine τh or an electron or
a muon misidentified as a τh are estimated from simulation, while the background from
jets misidentified as a τh is estimated from data. The correct identification or
misidenti-fication of a τh is determined by requiring a generator-level tau lepton to match with the
reconstructed τh within a ∆R cone of 0.1.
In the events where a jet is misidentified as a τh (denoted as jet → τh), QCD
mul-tijet production is the dominant process. The jet → τh background is estimated using a
control sample enriched in jets misidentified as τh, obtained by inverting the offline τh
iso-lation requirement used for signal selection. The contamination of the control region from
electroweak/top events with a genuine τh or a lepton misidentified as a τh is estimated
from the simulation and subtracted from the control sample. The difference in selection efficiency between signal and control regions is corrected by normalizing the control
sam-JHEP07(2019)142
ple with fake factors, calculated at an early stage of event selection (i.e. before applying
b jet identification, offline selection on pmissT or the angular selections), where a possible
signal does not stand out from the large background yield. To account for the correlation
between the pT of the τh and p
miss
T as well as geometrical differences in detector response,
the measurement is performed in bins of pT and|η| of the τh.
The jet → τh background consists of two components: the QCD multijet events and
electroweak/top events with jets misidentified as τh. The jets in these two background
components have different quark and gluon composition implying different tau fake
fac-tors. Thus the fake factors for misidentified τh from the QCD multijet events and for
misidentified τh from electroweak/top events are estimated separately. The fake factor for
the QCD multijet events is defined as the ratio of the QCD multijet event yields in signal and control regions. The QCD multijet event yield in the control region is estimated by
subtracting the simulated electroweak/top contribution (both genuine and non-genuine τh
events) from data. To estimate the contribution of the QCD multijet events in the signal
region, a binned maximum likelihood fit of pmissT templates to data is performed, using
the fraction of the QCD multijet events as a fit parameter. The templates describe the
expected shape of the pmissT distribution for each background component prior to the fit.
The pmissT shape of the QCD multijet events is assumed to be similar in the signal and
control regions, so the shape observed in the control region is used as the fit template. The template for electroweak/top events is obtained directly from simulation. The fake factor for electroweak/top events is also estimated from simulation as the ratio of event yields in signal and control regions. Finally, the overall normalization factor of the control sample
(as a function of the pT and |η| of the τh) is determined as a weighted sum of the two fake
factors, where the weight corresponds to the relative fractions of the QCD multijet and electroweak/top events in the control region after all selections. A closure test is performed by comparing the background predictions obtained with the above method to data in a signal-depleted validation region. The validation region is defined similarly to the signal region, except that events with jets passing the b jet identification are vetoed.
In the leptonic final states, the dominant background is tt production in which the
semileptonic tt decays are dominant in the ` + no τhfinal state and the dilepton tt decays
are dominant in the ` + τh final state. Minor backgrounds include single top quark, W
+jets, Z/γ∗, and diboson production. The QCD multijet background is suppressed to a
negligible level with tight angular selections and pmissT requirements. All backgrounds in
the two leptonic final states are estimated from simulation.
7 Systematic uncertainties
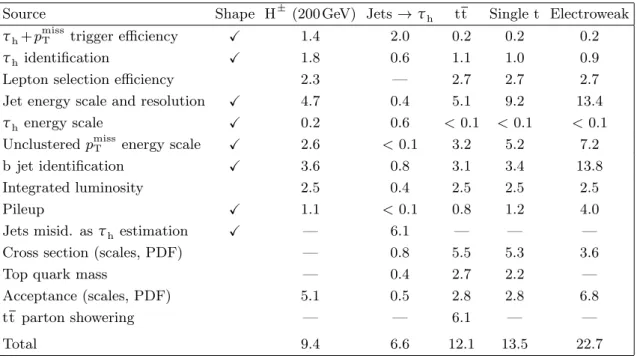
A summary of uncertainties incorporated in the analysis is given in table2, where the effects
of the different uncertainties on the final event yields are shown. For the uncertainties common to all final states, the variations in the yields are similar across the final states. Some of them affect only the final event yield for a given signal or background process,
whereas others also modify the shape of the final mT distributions. The uncertainties from
JHEP07(2019)142
Source Shape H± (200 GeV) Jets → τh tt Single t Electroweakτh+ p
miss
T trigger efficiency X 1.4 2.0 0.2 0.2 0.2
τh identification X 1.8 0.6 1.1 1.0 0.9
Lepton selection efficiency 2.3 — 2.7 2.7 2.7
Jet energy scale and resolution X 4.7 0.4 5.1 9.2 13.4
τh energy scale X 0.2 0.6 < 0.1 < 0.1 < 0.1
Unclustered pmissT energy scale X 2.6 < 0.1 3.2 5.2 7.2
b jet identification X 3.6 0.8 3.1 3.4 13.8
Integrated luminosity 2.5 0.4 2.5 2.5 2.5
Pileup X 1.1 < 0.1 0.8 1.2 4.0
Jets misid. as τhestimation X — 6.1 — — —
Cross section (scales, PDF) — 0.8 5.5 5.3 3.6
Top quark mass — 0.4 2.7 2.2 —
Acceptance (scales, PDF) 5.1 0.5 2.8 2.8 6.8
tt parton showering — — 6.1 — —
Total 9.4 6.6 12.1 13.5 22.7
Table 2. Effect of systematic uncertainties on the final event yields in per cent, prior to the fit, summed over all final states and categories. For the H± signal, the values for mH± = 200 GeV are
shown.
correlated among the signal and background processes, except for the few special cases mentioned in the following.
The simulated events are corrected to match the online and offline selection efficiencies
measured in data. For the trigger used in the τh + jets final state, the correction depends
on the pT of the τh and p
miss
T , so the corresponding uncertainty is taken into account as a
shape uncertainty.
In the ` + τh and ` + no τh final states, the online selection with single-lepton
triggers is incorporated into the overall lepton selection efficiency and the corresponding normalization uncertainty.
The systematic uncertainties in identification and isolation efficiencies for τh,
elec-tron, and muon candidates are taken into account. The agreement of the τh identification
efficiency between data and simulated samples is measured using the tag-and-probe
tech-nique [76]. The uncertainty in the measurement is 5%. It is incorporated as a
normaliza-tion uncertainty for all events with genuine tau leptons, and anticorrelated between the
`+ no τh final state and the final states with a τh. For the τh with large pT, an additional
uncertainty of +5−35%pT/TeV is applied in the hadronic final state as a shape uncertainty
to account for possible differences arising in the extrapolation of the measured efficiencies
to the high-pT range. Simulated events with an electron or a muon misidentified as a
τh are weighted to obtain the misidentification rates measured in data. The corrections
are applied as a function of η and the corresponding uncertainties are propagated to mT
JHEP07(2019)142
For the selection of electrons (muons), the combined uncertainty in online selection and offline identification is 3 (4)%. For leptons vetoed with loose identification and isolation criteria the effect of this uncertainty in the final event yield is typically only 0.3%. Both effects are included as normalization uncertainties.
The systematic uncertainties related to the calibration of energy measurement for jets,
τh and pmissT are considered as shape uncertainties. The uncertainties in the jet energy
scale and jet energy resolution are specified as a function of jet pT and η. The uncertainty
in the τh energy scale is±1.2% for pT <400 GeV and±3% otherwise [76]. The variations
of the jet and τh energy scales are propagated to ~pTmiss, for which the uncertainties arising
from the unclustered energy deposits in the detector are also included. The uncertainty in the lepton energy scale is negligible for this analysis. Correcting the b jet identification
and misidentification efficiencies in simulated samples affects the final mT shapes, so the
related uncertainties are considered as shape uncertainties [74].
The systematic uncertainty due to the pileup modeling is obtained by shifting the mean
of the total inelastic pp production cross section by ±5% around its nominal value [80],
and propagating the difference to the final mT distributions as a shape uncertainty.
The uncertainty in the measurement of the integrated luminosity is 2.5% [81].
The uncertainties related to the jet → τh background measurement in the hadronic
final state are included. The statistical uncertainties in the data and simulated samples
used to determine the fake factors are propagated into the final mT distributions as a
normalization uncertainty. The limited statistical precision of samples in the signal and
control region after all selections can lead to a difference in mT shapes between the two
regions. This effect is estimated and incorporated as a shape uncertainty. As the jet→ τh
background is estimated by subtracting simulated events (electroweak/top contribution) from the control data sample, all uncertainties related to the simulated samples are propa-gated to this background. These uncertainties are scaled to correspond to the contribution from simulated events in the control region after all selections, and anticorrelated between
the jet→ τh background and the other background processes.
The reference cross sections used to normalize each simulated background process are varied within their theoretical uncertainties related to the choice of renormalization and
factorization (RF) scales and PDFs [82]. For tt and single top quark processes, the effect
of mt on the cross sections is considered by varying mt by 1.0 GeV around the nominal
value of 172.5 GeV. Theoretical uncertainties in the acceptance of signal and background
events are determined by varying the RF scales and PDFs [82]. For the RF uncertainties,
the RF scales are varied by factors of 0.5 and 2, excluding the extreme variations where one scale is varied by 0.5 and the other one by 2. The envelope of the six variations is used to determine the total uncertainty. The cross section and acceptance uncertainties are uncorrelated between different background processes.
The uncertainty arising from the parton shower modeling is included for the dominant tt background in the leptonic final states. Four parton showering variations are included
by perturbing the initial- and final-state parameters [83], the matching of jets from matrix
element calculations and from parton shower, and the underlying event tune [62]. The
JHEP07(2019)142
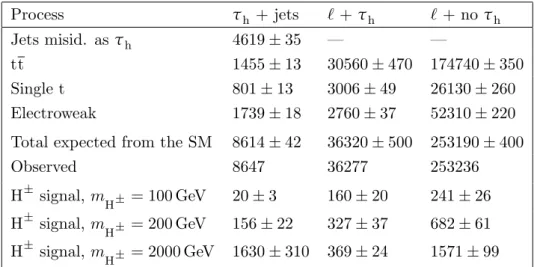
Process τh + jets `+ τh `+ no τh Jets misid. as τh 4619± 35 — — tt 1455± 13 30560± 470 174740 ± 350 Single t 801± 13 3006± 49 26130± 260 Electroweak 1739± 18 2760± 37 52310± 220Total expected from the SM 8614± 42 36320± 500 253190 ± 400
Observed 8647 36277 253236 H± signal, m H± = 100 GeV 20± 3 160± 20 241± 26 H± signal, m H± = 200 GeV 156± 22 327± 37 682± 61 H± signal, m H± = 2000 GeV 1630± 310 369 ± 24 1571± 99
Table 3. Number of expected and observed events for the three final states after all selections, summed over all categories in each final state. For background processes, the event yields after a background-only fit and the corresponding uncertainties are shown. For the H± mass hypotheses of 100, 200, and 2000 GeV, the signal yields are normalized to an H± production cross section of 1 pb and the total systematic uncertainties (prior to the fit) are shown.
uncertainties, uncorrelated between categories. The leptonic final states are sensitive to the parton shower modeling due to the event categorization based on the jet multiplicity. In the hadronic final state, the event selection is inclusive in jet multiplicity and thus this uncertainty is neglected.
For the intermediate-mass signal samples, an additional normalization uncertainty is assigned to incorporate the statistical uncertainties of the samples used in the calculation of the LO-to-NLO correction factors.
The statistical uncertainties related to the finite number of events in the final mT
distributions are taken into account using the Barlow-Beeston method [84].
8 Results
A simultaneous binned maximum likelihood fit is performed over all the categories in the
three final states. In total, 36 mTdistributions (two from the τh + jets final state, 18 from
the ` + τhfinal state, and 16 from the ` + no τhfinal state) are fitted. The distributions are
binned according to the statistical precision of the samples, separately for each category. This leads to wider bins in the tail of the distributions, such that the last bin extends to 5 TeV. The systematic uncertainties are incorporated as nuisance parameters in the likelihood. They are profiled in the fit according to their probability density functions, taking correlations into account. For normalization uncertainties, log-normal probability density functions are used as priors. For shape uncertainties, polynomial interpolation
is used to derive continuous prior distributions from the nominal and varied mT shape
templates. The expected event yields after a background-only fit to the data and the
JHEP07(2019)142
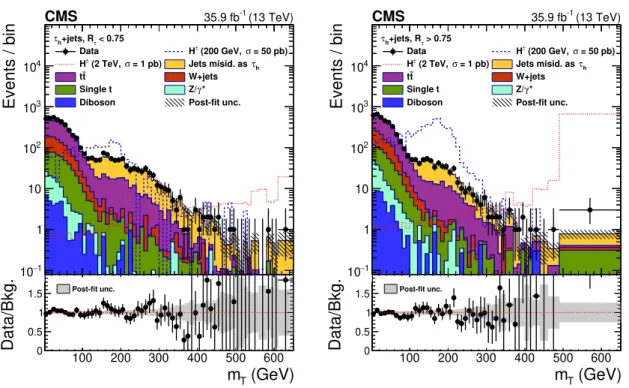
100 200 300 400 500 600 (GeV) T m 0 0.5 1 1.5 2 Data/Bkg. Post-fit unc. 1 − 10 1 10 2 10 3 10 4 10 Events / bin < 0.75 τ +jets, R h τ Data H± (200 GeV, σ = 50 pb) = 1 pb) σ (2 TeV, ± H Jets misid. as τh t t W+jets Single t Z/γ*Diboson Post-fit unc.
(13 TeV) -1 35.9 fb CMS 100 200 300 400 500 600 (GeV) T m 0 0.5 1 1.5 2 Data/Bkg. Post-fit unc. 1 − 10 1 10 2 10 3 10 4 10 Events / bin > 0.75 τ +jets, R h τ Data H± (200 GeV, σ = 50 pb) = 1 pb) σ (2 TeV, ± H Jets misid. as τh t t W+jets Single t Z/γ*
Diboson Post-fit unc.
(13 TeV)
-1
35.9 fb
CMS
Figure 3. The transverse mass distributions in the τh + jets final state after a background-only fit to the data. Left: category defined by Rτ < 0.75. Transverse mass values up to 5 TeV are
considered in the fit, but the last bins with mT >650 GeV do not contain any observed events. Right: category defined by Rτ >0.75. The last bin shown extends to 5 TeV.
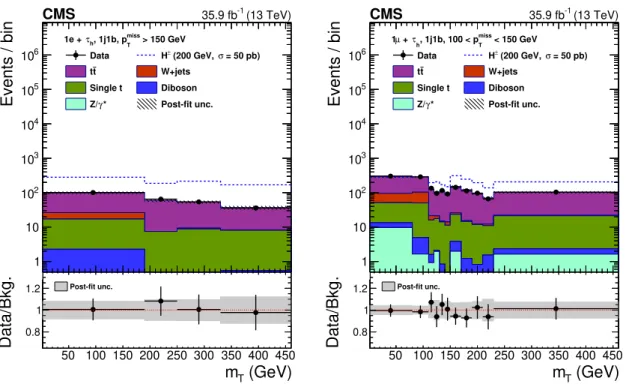
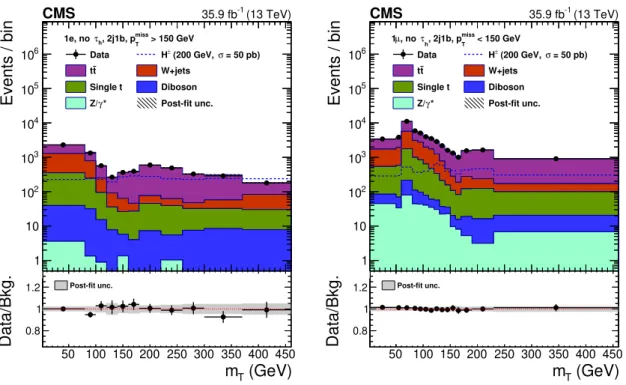
The distributions of mT after a background-only fit to the data are shown in figure 3
for both categories in the τh + jets final state, in figure 4 for two categories with high
signal sensitivity in the ` + τhfinal state, and in figure5for two high-sensitivity categories
in the ` + no τh final state. No significant excess is observed in any of the categories, and
the result of the simultaneous fit is found to agree with the SM prediction.
The modified frequentist CLscriterion [85,86] based on the profile likelihood ratio test
statistic [87] is applied to determine the 95% confidence level (CL) limit for the product
of the H± production cross section and the branching fraction B(H± → τ±ντ). The
asymptotic approximation [88] is used throughout the analysis. Pseudo-experiments are
performed for selected signal mass hypotheses to verify the validity of the asymptotic
approximation. For the H± mass range up to 165 GeV, the limit onB(t → bH±)B(H± →
τ±ντ) is calculated, scaling down the tt background component consistently with theB(t →
bH±) signal hypothesis, and the result is interpreted as a limit on σH±B(H±→ τ±ντ) by
assuming σH±= 2σttB(t → bH±)(1−B(t → bH±)), where the tt production cross section
σtt is assumed unmodified by the presence of H±and the value of 831.76 pb is used [55,56].
For the H±mass range from 170 GeV to 3 TeV, the limit on σH±B(H±→ τ±ντ) is calculated
without assuming a specific production mode.
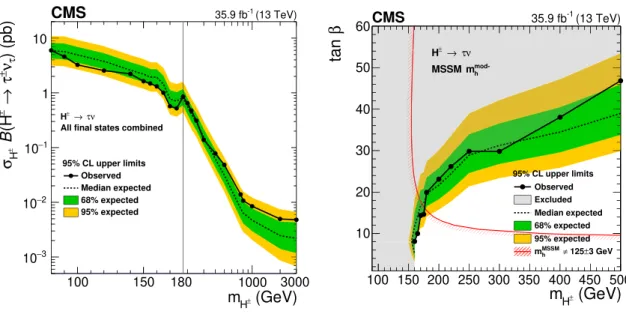
The model-independent upper limit with all final states and categories combined is
JHEP07(2019)142
50 100 150 200 250 300 350 400 450 (GeV) T m 0.8 1 1.2 Data/Bkg. Post-fit unc. 1 10 2 10 3 10 4 10 5 10 6 10 Events / bin > 150 GeV miss T , 1j1b, p h τ 1e + Data H± (200 GeV, σ = 50 pb) t t W+jets Single t Diboson * γ Z/ Post-fit unc. (13 TeV) -1 35.9 fb CMS 50 100 150 200 250 300 350 400 450 (GeV) T m 0.8 1 1.2 Data/Bkg. Post-fit unc. 1 10 2 10 3 10 4 10 5 10 6 10 Events / bin < 150 GeV miss T , 1j1b, 100 < p h τ + µ 1 Data H± (200 GeV, σ = 50 pb) t t W+jets Single t Diboson * γ Z/ Post-fit unc. (13 TeV) -1 35.9 fb CMSFigure 4. The transverse mass distributions for two ` + τh categories with high signal sensitivity after a background-only fit to the data. Left: category with one electron, one τh, one jet identified as a b jet, and pmissT >150 GeV. Right: category with one muon, one τh, one jet identified as a b jet and 100 < pmissT <150 GeV. In both categories, the last bin shown extends to 5 TeV.
limit ranges from 6 pb at 80 GeV to 5 fb at 3 TeV. For the light H± mass range of 80–
160 GeV, the limit corresponds to B(t → bH±)B(H± → τ±ντ) values between 0.36% (at
80 GeV) and 0.08% (at 160 GeV). In the light H± mass range, this is the most stringent
limit on B(t → bH±)B(H±→ τ±ντ) to date set by the CMS Collaboration, with a factor
of 1.5–3.0 improvement with respect to ref. [28], depending on mH±. In the intermediate
mass range of 165–175 GeV, this is the first limit on σH±B(H± → τ±ντ) set by the CMS
Collaboration. The drop in the expected and observed limits in the intermediate region is
not predicted from theory [20] but is rather an experimental feature explained by the fact
that in this region LO signal samples are used instead of NLO. This dip is mitigated but not completely cancelled by the LO-to-NLO corrections extrapolated from the surrounding mass regions. In the heavy mass range from 180 GeV, this result extends the search region
up to mH± = 3 TeV, compared to 600 GeV in ref. [28].
In the light and intermediate H± mass regions all three final states contribute
signifi-cantly to the sensitivity, and the combined limits are on average≈40% lower compared to
the τh+ jets final state alone. In the heavy H
±
mass region, the sensitivity of the leptonic
final states decreases, and the τh + jets final state starts to dominate the limit as mH±
increases. Above mH± = 500 GeV the combined limit is solely driven by the τh + jets final
JHEP07(2019)142
50 100 150 200 250 300 350 400 450 (GeV) T m 0.8 1 1.2 Data/Bkg. Post-fit unc. 1 10 2 10 3 10 4 10 5 10 6 10 Events / bin > 150 GeV miss T , 2j1b, p h τ 1e, no Data H± (200 GeV, σ = 50 pb) t t W+jets Single t Diboson * γ Z/ Post-fit unc. (13 TeV) -1 35.9 fb CMS 50 100 150 200 250 300 350 400 450 (GeV) T m 0.8 1 1.2 Data/Bkg. Post-fit unc. 1 10 2 10 3 10 4 10 5 10 6 10 Events / bin < 150 GeV miss T , 2j1b, p h τ , no µ 1 Data H± (200 GeV, σ = 50 pb) t t W+jets Single t Diboson * γ Z/ Post-fit unc. (13 TeV) -1 35.9 fb CMSFigure 5. The mT distributions for two ` + no τh categories with high signal sensitivity after a background-only fit to the data. Left: category with one electron, no τh, two jets (one identified as a b jet), and pmissT >150 GeV. Right: category with one muon, no τh, two jets (one identified as a b jet) and pmissT <150 GeV. In both categories, the last bin shown extends to 5 TeV.
The limit is interpreted in the MSSM mmod-h benchmark scenario [89] by comparing
the observed limit on the H± cross section to the theoretical cross sections predicted in
this scenario [20, 90–94]. The MSSM mmod-h scenario is specified using low-energy MSSM
parameters and is designed to give a mass of approximately 125 GeV for the light CP-even
Higgs boson over a wide region of the parameter space. The limit for the MSSM mmod-h
scenario in the mH±-tan β plane is shown on the right side of figure6. Based on the observed
limit, all values of the parameter tan β from 1 to 60 are excluded for mH± values up to
160 GeV. The limit extends to mH± = 500 GeV. For m
H± = 200 (400) GeV, the observed
limit excludes all tan β values above 26 (40), compared to 45 (56) excluded in ref. [28].
9 Summary
A search is presented for charged Higgs bosons decaying as H± → τ±ντ, using events
recorded by the CMS experiment in 2016 at a center-of-mass energy of 13 TeV. Transverse mass distributions are reconstructed in hadronic and leptonic final states and are found
to agree with the standard model expectation. Upper limits for the product of the H±
production cross section and the branching fraction to τ±ντ are set at 95% confidence level
for an H± mass ranging from 80 GeV to 3 TeV, including the range close to the top quark
mass. The observed limit ranges from 6 pb at 80 GeV to 5 fb at 3 TeV. The results are interpreted as constraints in the parameter space of the minimal supersymmetric standard
JHEP07(2019)142
100 150 ) (pb)τ ν ± τ → ± (H B ± H σ 3 − 10 2 − 10 1 − 10 1 10 CMS 95% CL upper limits Observed Median expected 68% expected 95% expected ν τ → ± HAll final states combined
(GeV) ± H m1000 (13 TeV) -1 35.9 fb 180 3000 100 150 200 250 300 350 400 450 500 (GeV) ± H m 10 20 30 40 50 60 β tan 95% CL upper limits Observed Excluded Median expected 68% expected 95% expected 3 GeV ± 125 ≠ MSSM h m (13 TeV) -1 35.9 fb CMS ν τ → ± H mod-h m MSSM
Figure 6. The observed 95% CL exclusion limits on σH±B(H± → τ±ντ) (solid black points),
com-pared to the expected limit assuming only standard model processes (dashed line) for the H±mass range from 80 GeV to 3 TeV (left), and the same limit interpreted in the mmod-h benchmark scenario (right). The green (yellow) bands represent one (two) standard deviations from the expected limit. On the left, the horizontal axis is linear from 80 to 180 GeV and logarithmic for larger mH± values.
On the right, the region below the red line is excluded assuming that the observed neutral Higgs boson is the light CP-even 2HDM Higgs boson with a mass of 125± 3 GeV, where the uncertainty is the theoretical uncertainty in the mass calculation.
model mmod-h benchmark scenario. In this scenario, all tan β values from 1 to 60 are
excluded for charged Higgs boson masses up to 160 GeV.
Acknowledgments
We congratulate our colleagues in the CERN accelerator departments for the excellent per-formance of the LHC and thank the technical and administrative staffs at CERN and at other CMS institutes for their contributions to the success of the CMS effort. In addition, we gratefully acknowledge the computing centers and personnel of the Worldwide LHC Computing Grid for delivering so effectively the computing infrastructure essential to our analyses. Finally, we acknowledge the enduring support for the construction and operation of the LHC and the CMS detector provided by the following funding agencies: BMBWF and FWF (Austria); FNRS and FWO (Belgium); CNPq, CAPES, FAPERJ, FAPERGS, and FAPESP (Brazil); MES (Bulgaria); CERN; CAS, MoST, and NSFC (China); COL-CIENCIAS (Colombia); MSES and CSF (Croatia); RPF (Cyprus); SENESCYT (Ecuador); MoER, ERC IUT, and ERDF (Estonia); Academy of Finland, MEC, and HIP (Finland); CEA and CNRS/IN2P3 (France); BMBF, DFG, and HGF (Germany); GSRT (Greece); NKFIA (Hungary); DAE and DST (India); IPM (Iran); SFI (Ireland); INFN (Italy); MSIP and NRF (Republic of Korea); MES (Latvia); LAS (Lithuania); MOE and UM (Malaysia); BUAP, CINVESTAV, CONACYT, LNS, SEP, and UASLP-FAI (Mexico); MOS
(Montene-JHEP07(2019)142
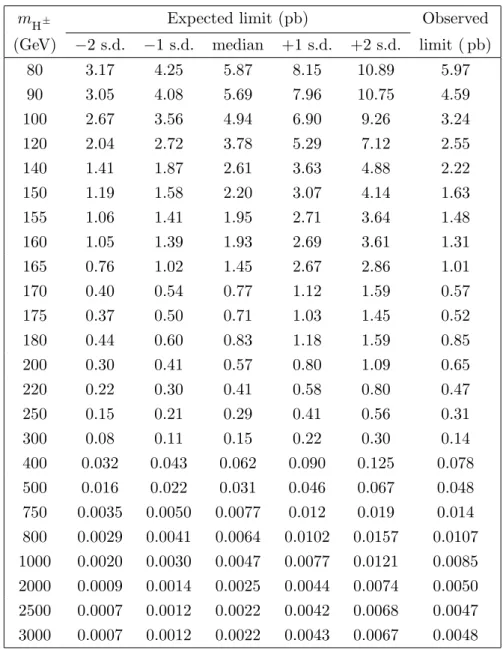
mH± Expected limit (pb) Observed
(GeV) −2 s.d. −1 s.d. median +1 s.d. +2 s.d. limit ( pb)
80 3.17 4.25 5.87 8.15 10.89 5.97 90 3.05 4.08 5.69 7.96 10.75 4.59 100 2.67 3.56 4.94 6.90 9.26 3.24 120 2.04 2.72 3.78 5.29 7.12 2.55 140 1.41 1.87 2.61 3.63 4.88 2.22 150 1.19 1.58 2.20 3.07 4.14 1.63 155 1.06 1.41 1.95 2.71 3.64 1.48 160 1.05 1.39 1.93 2.69 3.61 1.31 165 0.76 1.02 1.45 2.67 2.86 1.01 170 0.40 0.54 0.77 1.12 1.59 0.57 175 0.37 0.50 0.71 1.03 1.45 0.52 180 0.44 0.60 0.83 1.18 1.59 0.85 200 0.30 0.41 0.57 0.80 1.09 0.65 220 0.22 0.30 0.41 0.58 0.80 0.47 250 0.15 0.21 0.29 0.41 0.56 0.31 300 0.08 0.11 0.15 0.22 0.30 0.14 400 0.032 0.043 0.062 0.090 0.125 0.078 500 0.016 0.022 0.031 0.046 0.067 0.048 750 0.0035 0.0050 0.0077 0.012 0.019 0.014 800 0.0029 0.0041 0.0064 0.0102 0.0157 0.0107 1000 0.0020 0.0030 0.0047 0.0077 0.0121 0.0085 2000 0.0009 0.0014 0.0025 0.0044 0.0074 0.0050 2500 0.0007 0.0012 0.0022 0.0042 0.0068 0.0047 3000 0.0007 0.0012 0.0022 0.0043 0.0067 0.0048
Table 4. The expected and observed 95% CL exclusion limits on σH±B(H± → τ±ντ) for the H±
mass range from 80 GeV to 3 TeV. The ±1 s.d. (±2 s.d.) refers to one (two) standard deviations from the expected limit.
gro); MBIE (New Zealand); PAEC (Pakistan); MSHE and NSC (Poland); FCT (Portugal); JINR (Dubna); MON, RosAtom, RAS, RFBR, and NRC KI (Russia); MESTD (Serbia); SEIDI, CPAN, PCTI, and FEDER (Spain); MOSTR (Sri Lanka); Swiss Funding Agen-cies (Switzerland); MST (Taipei); ThEPCenter, IPST, STAR, and NSTDA (Thailand); TUBITAK and TAEK (Turkey); NASU and SFFR (Ukraine); STFC (United Kingdom); DOE and NSF (U.S.A.).
Individuals have received support from the Marie-Curie program and the European Research Council and Horizon 2020 Grant, contract No. 675440 (European Union); the Leventis Foundation; the A. P. Sloan Foundation; the Alexander von Humboldt
Founda-JHEP07(2019)142
tion; the Belgian Federal Science Policy Office; the Fonds pour la Formation `a la Recherche
dans l’Industrie et dans l’Agriculture (FRIA-Belgium); the Agentschap voor Innovatie door Wetenschap en Technologie (IWT-Belgium); the F.R.S.-FNRS and FWO (Belgium) under the “Excellence of Science — EOS” — be.h project n. 30820817; the Ministry of Education,
Youth and Sports (MEYS) of the Czech Republic; the Lend¨ulet (“Momentum”) Program
and the J´anos Bolyai Research Scholarship of the Hungarian Academy of Sciences, the
New National Excellence Program ´UNKP, the NKFIA research grants 123842, 123959,
124845, 124850 and 125105 (Hungary); the Council of Science and Industrial Research, India; the HOMING PLUS program of the Foundation for Polish Science, cofinanced from European Union, Regional Development Fund, the Mobility Plus program of the Min-istry of Science and Higher Education, the National Science Center (Poland), contracts Harmonia 2014/14/M/ST2/00428, Opus 2014/13/B/ST2/02543, 2014/15/B/ST2/03998, and 2015/19/B/ST2/02861, Sonata-bis 2012/07/E/ST2/01406; the National Priorities Re-search Program by Qatar National ReRe-search Fund; the Programa Estatal de Fomento de la
Investigaci´on Cient´ıfica y T´ecnica de Excelencia Mar´ıa de Maeztu, grant MDM-2015-0509
and the Programa Severo Ochoa del Principado de Asturias; the Thalis and Aristeia pro-grams cofinanced by EU-ESF and the Greek NSRF; the Rachadapisek Sompot Fund for Postdoctoral Fellowship, Chulalongkorn University and the Chulalongkorn Academic into Its 2nd Century Project Advancement Project (Thailand); the Welch Foundation, contract C-1845; and the Weston Havens Foundation (U.S.A.).
Open Access. This article is distributed under the terms of the Creative Commons
Attribution License (CC-BY 4.0), which permits any use, distribution and reproduction in
any medium, provided the original author(s) and source are credited.
References
[1] ATLAS collaboration, Observation of a new particle in the search for the Standard Model Higgs boson with the ATLAS detector at the LHC,Phys. Lett. B 716(2012) 1
[arXiv:1207.7214] [INSPIRE].
[2] CMS collaboration, Observation of a new boson at a mass of 125 GeV with the CMS experiment at the LHC,Phys. Lett. B 716(2012) 30[arXiv:1207.7235] [INSPIRE].
[3] CMS collaboration, Observation of a new boson with mass near 125 GeV in pp collisions at √s= 7 and 8 TeV, JHEP 06(2013) 081[
arXiv:1303.4571] [INSPIRE].
[4] P.W. Higgs, Broken symmetries, massless particles and gauge fields,Phys. Lett. 12(1964)
132[INSPIRE].
[5] P.W. Higgs, Broken symmetries and the masses of gauge bosons,Phys. Rev. Lett. 13(1964)
508[INSPIRE].
[6] G.S. Guralnik, C.R. Hagen and T.W.B. Kibble, Global conservation laws and massless particles,Phys. Rev. Lett. 13(1964) 585[INSPIRE].
[7] P.W. Higgs, Spontaneous symmetry breakdown without massless bosons,Phys. Rev. 145 (1966) 1156[INSPIRE].
[8] T.W.B. Kibble, Symmetry breaking in non-Abelian gauge theories,Phys. Rev. 155(1967)
JHEP07(2019)142
[9] F. Englert and R. Brout, Broken symmetry and the mass of gauge vector mesons,Phys. Rev.Lett. 13(1964) 321[INSPIRE].
[10] CMS collaboration, Constraints on the spin-parity and anomalous HVV couplings of the Higgs boson in proton collisions at7 and 8 TeV,Phys. Rev. D 92(2015) 012004
[arXiv:1411.3441] [INSPIRE].
[11] ATLAS and CMS collaborations, Combined measurement of the Higgs boson mass in pp collisions at √s= 7 and 8 TeV with the ATLAS and CMS experiments,Phys. Rev. Lett. 114 (2015) 191803[arXiv:1503.07589] [INSPIRE].
[12] ATLAS collaboration, Study of the spin and parity of the Higgs boson in diboson decays with the ATLAS detector,Eur. Phys. J. C 75(2015) 476[Erratum ibid. C 76 (2016) 152] [arXiv:1506.05669] [INSPIRE].
[13] ATLAS and CMS collaborations, Measurements of the Higgs boson production and decay rates and constraints on its couplings from a combined ATLAS and CMS analysis of the LHC pp collision data at√s= 7 and 8 TeV,JHEP 08(2016) 045[arXiv:1606.02266] [INSPIRE].
[14] CMS collaboration, Measurements of properties of the Higgs boson decaying into the four-lepton final state in pp collisions at√s= 13 TeV,JHEP 11(2017) 047
[arXiv:1706.09936] [INSPIRE].
[15] G.C. Branco, P.M. Ferreira, L. Lavoura, M.N. Rebelo, M. Sher and J.P. Silva, Theory and phenomenology of two-Higgs-doublet models,Phys. Rept. 516(2012) 1[arXiv:1106.0034]
[INSPIRE].
[16] A. Djouadi, The anatomy of electro-weak symmetry breaking. II. The Higgs bosons in the minimal supersymmetric model,Phys. Rept. 459(2008) 1[hep-ph/0503173] [INSPIRE].
[17] G. Senjanovi´c and R.N. Mohapatra, Exact left-right symmetry and spontaneous violation of parity,Phys. Rev. D 12(1975) 1502[INSPIRE].
[18] J.F. Gunion, R. Vega and J. Wudka, Higgs triplets in the Standard Model,Phys. Rev. D 42 (1990) 1673[INSPIRE].
[19] H. Georgi and M. Machacek, Doubly charged Higgs bosons, Nucl. Phys. B 262(1985) 463
[INSPIRE].
[20] C. Degrande, R. Frederix, V. Hirschi, M. Ubiali, M. Wiesemann and M. Zaro, Accurate predictions for charged Higgs production: closing the mH± ∼ mt window,Phys. Lett. B 772
(2017) 87[arXiv:1607.05291] [INSPIRE].
[21] ALEPH, DELPHI, L3, OPAL and LEP collaboration, Search for charged Higgs bosons: combined results using LEP data,Eur. Phys. J. C 73(2013) 2463[arXiv:1301.6065]
[INSPIRE].
[22] CDF collaboration, Search for Higgs bosons predicted in two-Higgs-doublet models via decays to tau lepton pairs in1.96 TeV p¯p collisions, Phys. Rev. Lett. 103(2009) 201801
[arXiv:0906.1014] [INSPIRE].
[23] D0 collaboration, Search for Higgs bosons of the minimal supersymmetric Standard Model in p¯p collisions at √s= 1.96 TeV,Phys. Lett. B 710(2012) 569[arXiv:1112.5431] [INSPIRE].
[24] ATLAS collaboration, Search for charged Higgs bosons decaying via H+→ τν in top quark pair events using pp collision data at√s= 7 TeV with the ATLAS detector,JHEP 06(2012) 039[arXiv:1204.2760] [INSPIRE].
[25] CMS collaboration, Search for a light charged Higgs boson in top quark decays in pp collisions at √s= 7 TeV, JHEP 07(2012) 143[arXiv:1205.5736] [INSPIRE].
JHEP07(2019)142
[26] ATLAS collaboration, Search for charged Higgs bosons through the violation of leptonuniversality in t¯t events using pp collision data at √s= 7 TeV with the ATLAS experiment,
JHEP 03(2013) 076[arXiv:1212.3572] [INSPIRE].
[27] ATLAS collaboration, Search for charged Higgs bosons decaying via H± → τ±ν in fully hadronic final states using pp collision data at√s= 8 TeV with the ATLAS detector,JHEP 03(2015) 088[arXiv:1412.6663] [INSPIRE].
[28] CMS collaboration, Search for a charged Higgs boson in pp collisions at√s= 8 TeV,JHEP 11(2015) 018[arXiv:1508.07774] [INSPIRE].
[29] ATLAS collaboration, Search for charged Higgs bosons produced in association with a top quark and decaying via H±→ τν using pp collision data recorded at√s= 13 TeV by the ATLAS detector,Phys. Lett. B 759(2016) 555[arXiv:1603.09203] [INSPIRE].
[30] ATLAS collaboration, Search for charged Higgs bosons decaying via H± → τ±ντ in the τ +jets and τ +lepton final states with36 fb−1 of pp collision data recorded at √s= 13 TeV with the ATLAS experiment,JHEP 09(2018) 139[arXiv:1807.07915] [INSPIRE].
[31] ATLAS collaboration, Search for charged Higgs bosons in the H±→ tb decay channel in pp collisions at √s= 8 TeV using the ATLAS detector,JHEP 03(2016) 127
[arXiv:1512.03704] [INSPIRE].
[32] ATLAS collaboration, Search for charged Higgs bosons decaying into top and bottom quarks at√s= 13 TeV with the ATLAS detector,JHEP 11(2018) 085[arXiv:1808.03599]
[INSPIRE].
[33] ATLAS collaboration, Search for a light charged Higgs boson in the decay channel H+→ c¯s in t¯t events using pp collisions at √s= 7 TeV with the ATLAS detector,Eur. Phys. J. C 73 (2013) 2465[arXiv:1302.3694] [INSPIRE].
[34] CMS collaboration, Search for a light charged Higgs boson decaying to c¯s in pp collisions at √s= 8 TeV, JHEP 12(2015) 178[
arXiv:1510.04252] [INSPIRE].
[35] CMS collaboration, Search for a charged Higgs boson decaying to charm and bottom quarks in proton-proton collisions at√s= 8 TeV,JHEP 11(2018) 115[arXiv:1808.06575]
[INSPIRE].
[36] ATLAS collaboration, Search for a charged Higgs boson produced in the vector-boson fusion mode with decay H±→ W±Z using pp collisions at √s= 8 TeV with the ATLAS
experiment,Phys. Rev. Lett. 114(2015) 231801 [arXiv:1503.04233] [INSPIRE].
[37] CMS collaboration, Search for charged Higgs bosons produced via vector boson fusion and decaying into a pair of W and Z bosons using pp collisions at√s= 13 TeV,Phys. Rev. Lett. 119(2017) 141802 [arXiv:1705.02942] [INSPIRE].
[38] ATLAS collaboration, Search for additional heavy neutral Higgs and gauge bosons in the ditau final state produced in 36 fb−1 of pp collisions at √s= 13 TeV with the ATLAS detector,JHEP 01(2018) 055[arXiv:1709.07242] [INSPIRE].
[39] CMS collaboration, Search for additional neutral MSSM Higgs bosons in the τ τ final state in proton-proton collisions at√s= 13 TeV,JHEP 09(2018) 007[arXiv:1803.06553]
[INSPIRE].
[40] CMS collaboration, Search for beyond the Standard Model Higgs bosons decaying into a b¯b pair in pp collisions at√s= 13 TeV,JHEP 08(2018) 113[arXiv:1805.12191] [INSPIRE].
[41] A. Arbey, F. Mahmoudi, O. Stal and T. Stefaniak, Status of the charged Higgs boson in two Higgs doublet models,Eur. Phys. J. C 78 (2018) 182[arXiv:1706.07414] [INSPIRE].