Contents lists available atScienceDirect
Clinica Chimica Acta
journal homepage:www.elsevier.com/locate/cca
Relationship between postprandial lipemia and atherogenic factors in
healthy subjects by considering gender di
fferences
As
ım Orem
a,⁎, Serap Ozer Yaman
a, Buket Altinkaynak
b, Birgül Vanizor Kural
a,
Fulya Balaban Yucesan
a, Yahya Altinkaynak
c, Cihan Orem
daDepartment of Medical Biochemistry, Faculty of Medicine, Karadeniz Technical University, Trabzon, Turkey bDepartment of Nursing, Faculty of Health, Ardahan University, Ardahan, Turkey
cProgram of Laborant and Veterinary Health, Department of Veterinary Medicine, Ardahan University, Ardahan, Turkey dDepartment of Cardiology, Faculty of Medicine, Karadeniz Technical University, Trabzon, Turkey
A R T I C L E I N F O
Keywords: Postprandial lipemia Oral fat tolerance test Oxidized LDL Area under curve LDL subfractions
A B S T R A C T
Background: Postprandial triglyceride concentrations are clinically significant and independent predictor of cardiovascular disease risk. The purpose of this study was to determine postprandial TG ranges in healthy subjects by considering gender differences. Secondly, assess the relationship between postprandial lipemia and atherogenic indicators. Finally, investigate the use of the postprandial 4h TG test instead of the area under the curve (AUC).
Methods: Postprandial lipemia was investigated using the standardized oral fat tolerance test (OFTT) in 96 healthy subjects (45 female/51 male). Study group was categorized into tertiles based on AUC calculated using TG concentrations at fasting and 2, 4 and 6h after OFTT. Lipid, lipoproteins, apolipoproteins, LDL subfractions and oxidized LDL (oxLDL) were evaluated in tertiles in both sex groups.
Results: The cut-off concentrations for postprandial 4-hour TG concentrations in female and male were 3.20 mmol/L and 4.59 mmol/L, respectively. We observed higher concentrations for atherogenic indicates like small dense-low density lipoprotein (sdLDL), oxLDL values in top tertiles for both groups (P < 0.05). Cohen's kappa coefficients for the agreement of AUC and 4h postprandial TG tests were 0.935, 0.970, 0.469 (P = 0.0001) in female, male and total study group, respectively.
Conclusion: Due to predominant effects of gender differences on postprandial lipemia, postprandial TG cut-off values for female and male subjects should be determined separately. Postprandial lipemia may be associated with atherogenic tendency by changing lipids, lipoproteins, sdLDL and oxLDL concentrations, especially in males. Four-hour postprandial TG concentrations emerged as a useful and reliable marker for evaluation of postprandial lipemia.
1. Introduction
Epidemiological and case-control studies in the last decade have demonstrated that non-fasting and postprandial (TG) concentrations are clinically significant and independent predictors of the cardiovas-cular disease (CVD) risk [1]. Since humans spend most of their time in a postprandial state, rather than fasting, it has been suggested that postprandial plasma lipid and lipoprotein concentrations are more meaningful and important than fasting values in evaluating coronary risk [2]. Several aspects related to non-fasting and postprandial TG and their role as risk factors for CVD were discussed by scientists and clinicians in February 2010 [3]. Among several possible factors, the increased highly atherogenic triglyceride (TG)-rich remnant lipoprotein
particles associated with low high-density lipoprotein cholesterol (HDL-C) concentrations in plasma have been proposed as the most important attribute for the atherogenicity of postprandial lipemia [4]. Moreover, it has been suggested that the co-presence of increased more athero-genic small dense low-density lipoprotein (sdLDL) and decreased HDL-C is associated with an augmented atherogenic tendency in lipid and lipoprotein profiles [5].
Various lipoprotein ratios or atherogenic indices including total cholesterol (TC)/HDL-C, LDL-C/HDL-C and apo B/apo AI have also been described. It has been suggested that these risk indicators have a greater predictive value than isolated parameters used independently, particularly LDL-C [6]. Moreover, the TG/HDL-C ratio has been pro-posed as a good discriminator for CVD risk prediction [7]. This ratio has
https://doi.org/10.1016/j.cca.2018.01.038
Received 21 July 2017; Received in revised form 17 January 2018; Accepted 20 January 2018
⁎Corresponding author at: Department of Medical Biochemistry, Faculty of Medicine, Karadeniz Technical University, 61080 Trabzon, Turkey.
E-mail address:[email protected](A. Orem).
Available online 20 February 2018
0009-8981/ © 2018 Elsevier B.V. All rights reserved.
been shown to reflect atherogenic sdLDL particles and to be associated with insulin resistance and metabolic syndrome [8,9]. Our present knowledge of the postprandial changes in lipoproteins and their sub-classes is relatively poor. Few previous studies have investigated post-prandial changes in the above-mentioned atherogenic parameters [10]. The methodology for evaluating postprandial TGs using the oral fat tolerance test (OFTT) and a desirable TG concentration (≤2.5 mmol/L) for any time during the postprandial period was defined by an expert panel [3]. Only a few studies have investigated postprandial TG ranges in healthy subjects in the light of gender differences because of the lack of OFTT standardization [11].
The purpose of this study was i) to define postprandial TG ranges in healthy subjects by considering gender differences, ii) to evaluate the relationship between postprandial lipemia and atherogenic indices in-cluding lipids, lipoproteins, sdLDL and ox-LDL concentrations, and iii) to assess the use of the 4 h postprandial TG test, as suggested by the expert panel group, instead of the area under the curve (AUC) calcu-lated using TG concentrations at fasting, and 2, 4 and 6 h after the OFTT.
2. Materials and methods 2.1. Subjects
Ninety-six healthy volunteers (51 male and 45 female) aged be-tween 19 and 54 years and with different socio-economic levels were randomly enrolled in this study. All participants were recruited through e-mail and personal contact among students and staff and their ac-quaintances at Karadeniz Technical University (KTU), Turkey. Subjects' health status was evaluated by means of detailed medical history, physical examinations and laboratory tests of blood samples (complete blood cell count (CBC), lipids, lipoproteins and thyroid function tests including TSH, free-T4, liver and kidney function tests) at the KTU Medical Faculty. Exclusion criteria included smoking status, alcohol or drug abuse, presence of acute and chronic inflammatory diseases, chronic kidney disease, obesity and endocrine disorders related to lipid and lipoprotein metabolism, such as diabetes mellitus, menopause, es-trogen replacement therapy and thyroid hormone disorders. Subjects performing heavy exercise and those on herbal medicines were also excluded. Body weights (kg), body fat percentages, body mass index (BMI) were obtained using impedance scales (Tanita Body Composition Analyzer, TBF-300, Illinois, USA). BMI was calculated using the formula weight/height2(kg/m2). The waist to hip ratio (WHR) was calculated by measuring the circumferences at the waist (midway between the rib cage and iliac crest) and hip (maximal circumference between the iliac crest and thigh region). Since the use of the waist to-height ratio (WHtR) has been shown to be a better discriminator of coronary heart disease and cardiovascular risk factors than waist circumference and BMI [12], the WHtR was also evaluated in the present study. All sub-jects gave written consent to participate in the study, which was ap-proved by the KTU Medical Ethics Committee.
2.2. Oral fat tolerance test
Participants consumed routine daily meals prior to the OFTT. They were instructed to avoid alcohol intake 24 h before the test. After 12 h overnight fasting, blood samples were collected at 8:00 am. Each par-ticipant was then given an OFTT meal containing a total 75 g fat in line with the expert panel suggestion [3]. The test meal consisted of toast bread, cheese and butter served as a toasted sandwich. In order to in-crease the digestibility and tolerability of the meal, 200 mL liquid ‘ayran’, a traditional homogenous drink made from yoghurt and water, was also provided. All test foods and drink were provided in the form of commercial products with specific ingredients approved by the Ministry of Food Agriculture and Livestock of the Republic of Turkey. The OFTT meal closely matched the expert panel recommendations of 62.5% fat,
24.1% carbohydrate and 13.4% protein. The test meal was consumed within 20 min, after which all subjects were instructed not to consume anything orally for the following 6 h, except for water. The test meal was well tolerated by all subjects. The OFTT was conducted at the KTU Medical Faculty Medical Biochemistry Department, where participants spent the entire test and were not allowed bed-rest or heavy exercise. 2.3. Biochemical analyses
Blood samples were drawn into the tubes without any anticoagulant for serum acquisition, as well as EDTA-anticoagulant tubes for plasma, by venipuncture before the test and every 2 h there after over a 6 h period. After centrifugation at 1800g for 10 min (Eppendorf 5804, Hamburg, Germany), serum and plasma samples were obtained and stored at−80 °C for 2 months until analysis. In order to reduce inter-assay measurement errors, samples were processed using the same test kit batch.
Concentrations of glucose, TC, TG, HDL-C and LDL-C were mea-sured in serum samples using enzymatic methods. These assays were performed on an AU 5800 autoanalyzer (Beckman Coulter, Shizuoka, Japan) and using its original reagents. Quantitative determination of insulin was performed using an IMMULITE 2000 XPi analyzer with its original reagents (Siemens, Munich, Germany). Apolipoprotein AI and B were assessed on the immunonephelometry BN II system (Siemens, Munich, Germany). These parameters were run after daily quality control procedures at the Clinical Biochemistry Laboratory as approved by the Ministry of Health at the KTU Medical Faculty. Insulin resistance was determined using the homeostasis model assessment method-in-sulin resistance (HOMA-IR) method and calculated with the appropriate formula [13]. AUC values were calculated from TG concentrations obtained at the baseline fasting period and at 2, 4, and 6 h after the OFTT using the trapezoidal rule [14].
LDL subfractions were measured in serum samples using a Lipoprint System (Quantimetrix Inc., Redondo Beach, CA, USA). This system se-parates lipoproteins in a non-denaturing gel gradient of polyacrylamide on the basis of net surface charge and size. The dye binds proportionally to the relative amount of cholesterol in each lipoprotein. After elec-trophoresis, densitometric analyses and proportional concentrations of lipoprotein classes and subclasses were calculated on Lipoware soft-ware. Very low-density lipoprotein (VLDL) and intermediate density lipoprotein (IDL) fractions were also determined in this system. In ad-dition to providing seven LDL subfractions (LDL-1-7), we divided LDL particles into “large” and “small” species as previously described by Vega et al. [15]. Reagents supplied by the manufacturer were used for each analysis. Oxidized LDL (ox-LDL) was measured in plasma samples using the ELISA method (Mercodia, Uppsala, Sweden).
Cut-off values were calculated for postprandial 4 h TG concentra-tions for females and males. The mean values plus 1.96 standard de-viation (SD) were used to obtain cut-off value for the sexes.
2.4. Statistical analysis
Data were expressed as mean ± SD for normally distributed and as median (interquartile range) values for non-normally distributed vari-ables. The distribution of variables was assessed using Kolmogorov-Smirnov test. Comparison of two groups was performed using Student's t-test or Mann–Whitney U test. Each sex group was categorized into three equal subgroups based on tertiles of AUC values. Participants with low AUC values were enrolled in Group 1, those with intermediate values in Group 2 and those with high values in Group 3. One-way analysis of variance (ANOVA) and Kruskal-Wallis test were used to compare parameters among tertiles. Tukey's and Tamhane's T2 tests were performed for post-hoc comparisons. Pearson or Spearman cor-relation analysis was used to assess the cor-relationships between post-prandial lipemia and atherogenic indices including lipids, lipoproteins, sdLDL and oxLDL in the light of the skewness of data distribution.
Cohen's kappa statistic was used to assess the agreement between AUC values and postprandial TG 4 h concentrations. AUC values and post-prandial TG 4 h concentrations were categorized based on tertiles as low, intermediate and high for kappa coefficients. Statistical sig-nificance was set at P < 0.05. Statistical procedures were performed on SPSS for Windows version 16.0 (SPSS Inc., Chicago, IL) software. 3. Results
Anthropometric measurements and biochemical variables re-presenting gender differences in the study group were summarized in Table 1. Significant differences were observed in these parameters be-tween males and females. Undesirable changes observed in anthropo-metric parameters, insulin resistance and LDL subfractions in the upper tertile of male subjects were accompanied by the atherogenic profile in the lipid and lipoprotein profile (Table 2). No significant difference was observed among the tertiles in terms of anthropometric parameters and HOMA-IR in female subjects (Table 3).
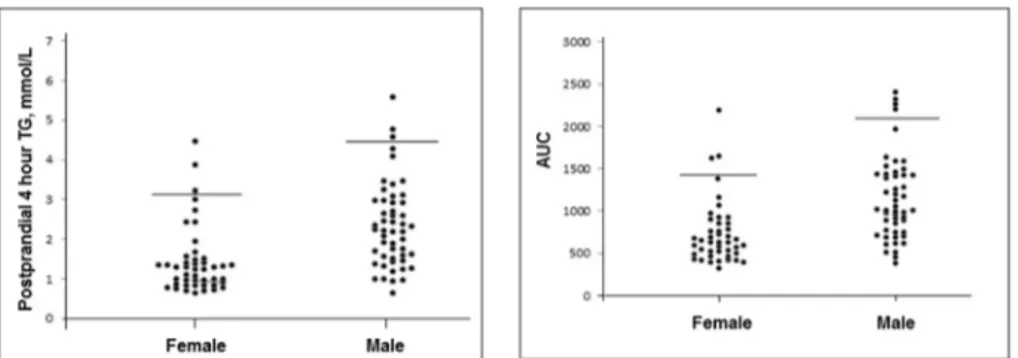
The cut-off values for postprandial 4 h TG concentrations for fe-males and fe-males were 3.20 mmol/L and 4.59 mmol/L, respectively (Fig. 1). When 2.5 mmol/L was adopted as a cut-off value, 19 male subjects (19/51) and 5 females (5/45) were above thisfigure.
The mean lipid (TC, TG) and lipoprotein (LDL-C) concentrations in male subjects were higher than those of females (Table 1). LDL-C, HDL-C, sdLDL and ox-LDL in the upper tertile for males were significantly different than those for females. In contrast, differences between the upper and lower tertiles for these parameters were predominant in male subjects (Fig. 2). Compared to the bottom tertile, the upper tertile for LDL-C concentrations in males exhibited an approximately 50% in-crease, while HDL-C decreased by 25% (Fig. 2). Small dense LDL con-centrations in male subjects increased approximately 3-fold in the
upper tertile compared to the bottom tertile (Fig. 2). Most of the parameters in the upper tertile were significantly different from those in the lower tertile in males (Table 2). However, except for a decrease in HDL-C, the concentrations of TG, TC, LDL-C, apo B and sdLDL increased in the upper tertile compared to the other, lower tertiles (Table 2). sdLDL and ox-LDL concentrations in males in the upper tertile were nearly twice as high as those in females (Fig. 2).
AUC and TG 4 h values were positively correlated with atherogenic indices including TC/HDL-C ratio, LDL-C/HDL-C ratio, TG/HDL-C ratio, ApoB/ApoA1 ratio, sdLDL and ox-LDL concentrations in both the fe-male and fe-male subgroups. The correlation coefficients were given in Table 4. The relationship between atherogenic indicates and post-prandial lipemia was predominant among male subjects.
Cohen's kappa statistic revealed agreement between AUC and 4 h postprandial TG tests. Perfect agreement was observed for the female and male groups (kappa coefficients = 0.935 and 0.970, P = 0.0001, respectively), while the agreement between AUC and 4 h postprandial TG tests was 91% (41/45) in the female group and 96% (49/51) in the male group. Moreover, moderate agreement was found for the entire study group (kappa coefficient = 0.469, P = 0.0001). The concordance between AUC and the 4 h postprandial TG tests was 65% (62/96) in this group.
4. Discussion
One of the main goals of this preliminary study was to define postprandial TG ranges in healthy Turkish subjects by considering gender differences. The cut-off concentrations for postprandial 4 h TG concentrations for females and males were 3.20 mmol/L and 4.59 mmol/L, respectively (Fig. 1). It was difficult to compare the ranges of postprandial TG concentrations in the present study with data
Table 1
Anthropometric measurements and biochemical variables in the study group.
Total study group (n = 96) Female (n = 45) Male (n = 51) P Age (years) 29 (20–37) 26 (19–30) 34 (19–43) 0.051⁎ BMI (kg/m2) 25.4 ± 4.4 23.9 ± 4.5 26.9 ± 3.9 0.002 AUC 949 ± 485 [850–1047] 728 ± 377 [615–841] 1143 ± 489 [1006–1281] 0.000 Postprandial 4 h TG (mmol/L) 1.53 (0.994–2.59) 1.92 ± 1.11 1.22 (0.819–1.49) 1.42 ± 0.888 2.24 (1.50–3.02) 2.37 ± 1.11 0.0001⁎ WHR 0.849 ± 0.095 0.776 ± 0.072 0.911 ± 0.062 0.0001 WHtR 0.520 ± 0.076 0.490 ± 0.080 0.545 ± 0.063 0.0001 TG (mmol/L) 1.12 ± 0.593 0.891 ± 0.449 1.32 ± 0.633 0.0001 TC (mmol/L) 4.85 ± 1.07 4.54 ± 0.805 5.12 ± 1.20 0.007 LDL-C (mmol/L) 2.87 ± 0.955 2.46 ± 0.669 3.23 ± 1.03 0.0001 HDL-C (mmol/L) 1.34 ± 0.309 1.54 ± 0.290 1.17 ± 0.197 0.0001 TC/HDL-C ratio 3.83 ± 1.37 3.02 ± 0.747 4.54 ± 1.40 0.0001 LDL-C/HDL-C ratio 2.30 ± 1.08 1.65 ± 0.576 2.88 ± 1.10 0.0001 TG/HDL-C ratio 2.14 ± 1.58 1.40 ± 0.830 2.80 ± 1.78 0.0001 Apo-A1 (g/L) 1.26 (1.15–1.42) 1.40 (1.29–1.68) 1.18 (1.08–1.26) 0.0001⁎ Apo-B (g/L) 0.893 ± 0.273 0.773 ± 0.215 0.996 ± 0.278 0.0001 ApoB/ApoA1 ratio 0.702 ± 0.277 0.537 ± 0.172 0.845 ± 0.272 0.0001 Glucose (mmol/L) 5.13 ± 0.472 5.0 ± 0.431 5.25 ± 0.481 0.011 Insulin (pmol/L) 35.4 (13.8–61.2) 33.0 (12.0–64.2) 39.0 (16.4–61.2) 0.813⁎ HOMA-IR 8.37 (3.29–14.7) 7.33 (2.72–14.8) 8.77 (3.99–14.4) 0.411⁎ Large LDL (mmol/L) 0.884 ± 0.339 0.737 ± 0.294 1.02 ± 0.322 0.0001 Small LDL (mmol/L) 0.259 (0.148–0.417) 0.170 (0.093–0.272) 0.334 (0.175–0.551) 0.001⁎ Large/small LDL ratio 3.72 (1.98–5.82) 5.61 ± 6.02 3.94 ± 2.68 0.094 VLDL (mmol/L) 1.12 ± 0.541 0.994 ± 0.469 1.23 ± 0.582 0.035 IDL (mmol/L) ox-LDL (mU/L) 1.17 ± 0.401 60.1 ± 23.2 1.08 ± 0.317 47.2 ± 13.8 1.26 ± 0.451 72.7 ± 23.8 0.024 0.0001
P shows differences between females and males according to student t-test. Data were expressed as mean ± SD. AUC was expressed as [confidence interval 95%].
BMI: Body mass index. WHR: Waist to hip ratio. WHtR: Waist to-height ratio. P < 0.05.
from the previous literature due to the lack of standardization in pre-vious studies of the OFTT in terms of fat quantities, time of blood sampling after the test. The postprandial TG concentrations reported in the literature range between 1.88 and 2.1 mmol/L, although con-centrations as high as 2.4 and 2.8 mmol/L have also been reported in healthy subjects [16]. However, none of the above studies considered gender differences. The 4 h TG concentration in the study group was 1.92 ± 1.11 mmol/L, and a marked difference of 1.42 ± 0.88 and 2.37 ± 1.11 mmol/L was observed between females and males, re-spectively. Furthermore, the expert panel in 2011 stated that a TG concentration ≤2.5 mmol/L at any time after OFTT administration should be considered a desirable postprandial TG response. The panel did not consider gender differences to define the cut-off value. In our study, 19 male subjects (19/51) and 5 female subjects (5/45) were found to be above a cut-off concentration of 2.5 mmol/L. According to this result, 37.2% of males and 11.1% of females in the present study failed to exhibit a desirable response on the basis of the expert panel cut-off value. Therefore we suggest that the cut-off values for females and males should be determined and evaluated separately. Also, post-prandial lipemia is associated with obesity, metabolic syndrome and diabetes mellitus, which are showed various prevalence in different population. Therefore to determine population based cut-off value for postprandial lipemia may be useful.
Secondly, we evaluated the relationship between postprandial li-pemia and the atherogenic tendency of lipid, lipoprotein and their subfraction concentrations in males and females. The mean lipid (TC, TG) and lipoprotein (LDL-C) concentrations in male and female subjects were below the criteria set out by the National Cholesterol Education Program Adult Treatment Panel III (NCEP-ATP III). As expected, these parameters were higher in male subjects than in females (Table 1). In
this reason, these parameters were evaluated separately in the gender subgroups. Lipid and lipoprotein profiles in the upper tertiles exhibited an atherogenic tendency, especially in male subjects. Approximately 50% increase in LDL-C and a 25% decrease in HDL-C concentrations in the upper tertiles compared to the bottom tertiles were determined in both sexes. The median fasting TG value of the entire study group was 0.95 mmol/L. Ourfindings were very similar to those of a recent report by Ozarda et al., who observed a 0.97 mmol/L TG values for the Turkish population in the same age range [17]. Fasting TG concentrations sdLDL and oxLDL exhibited an approximately 2 to 3-fold increase in the upper tertile compared to the bottom tertile in both sexes (Tables 2, 3). Hokanson et al. demonstrated that a 1 mmol/L increase in fasting TG is associated with a 14% increase in the risk of CVD [18]. TG is known not to constitute a component of atherosclerotic plaques. However, ele-vated TG concentrations result in altered lipid metabolism, including decreased HDL-C concentrations and increased remnant-like particles and sdLDL, which are associated with endothelial dysfunction and en-hanced oxidant stress [19]. Remnant particles have been shown to contain not only TGs, but also approximately 40-fold greater con-centrations of cholesterol esters per particle [20]. In addition, when hypertriglyceridemia is present, highly atherogenic sdLDL will be generated. A high prevalence of sdLDL is very common in patients with metabolic syndrome, diabetes mellitus and insulin resistance, which are associated with a high risk for CHD. Therefore, observed alterations above mentioned parameters in the upper tertiles of the study groups may be associated with accelerated atherosclerosis and CVD [1].
Boren et al. more recently evaluated postprandial hypertriglycer-idemia as a coronary risk factor [7]. Data obtained from epidemiolo-gical studies, the Copenhagen City Heart study [1], the Women's Health study [21], the Norwegian study [22] and case-control studies show
Table 2
Anthropometric measurements and biochemical variables in males according to AUC tertiles (n = 17), mean ± SD [min–max].
Tertiles P 1 681 ± 154 [384–916] 2 1108 ± 152 [926–1406] 3 1740 ± 373 [1415–2400]
Age (years) 27 (20–35) 31 (26–42) 42 (34–49)a,b 0.003⁎
BMI (kg/m2) 23.7 ± 2.8 28.0 ± 3.3a 28.9 ± 3.7a 0.0001
WHR 0.88 ± 0.06 0.92 ± 0.06 0.94 ± 0.06a 0.011
WHtR 0.504 ± 0.059 0.559 ± 0.049a 0.580 ± 0.058a 0.001
Postprandial 4 h TG (mmol/L) 1.31 ± 0.340 2.38 ± 0.465a 3.62 ± 0.955a,b 0.0001
TG (mmol/L) 0.796 ± 0.208 1.25 ± 0.278a 2.04 ± 0.613a,b 0.0001 TC (mmol/L) 4.38 ± 0.708 5.10 ± 0.826 6.04 ± 1.45a,b 0.0001 LDL-C (mmol/L) 2.54 ± 0.657 3.26 ± 0.719a 4.01 ± 1.16a,b 0.0001 HDL-C (mmol/L) 1.31 ± 0.184 1.14 ± 0.138a 1.02 ± 0.161a 0.0001 TC/HDL-C ratio 3.40 ± 0.652 4.50 ± 0.740a 5.97 ± 1.40a,b 0.0001 LDL-C/HDL-C ratio 1.98 ± 0.583 2.88 ± 0.647a 3.94 ± 1.06a,b 0.0001 TG/HDL-C ratio 1.42 ± 0.469 2.56 ± 0.742a 4.74 ± 1.97a,b 0.0001 Apo-A1 (g/L) 1.27 ± 0.261 1.19 ± 0.166 1.14 ± 0.114 0.139 Apo-B (g/L) 0.813 ± 0.225 1.0 ± 0.202a 1.21 ± 0.271a,b 0.0001
ApoB/ApoA1 ratio 0.653 ± 0.168 0.855 ± 0.212a 1.10 ± 0.269a,b 0.0001
Glucose (mmol/L) 5.12 ± 0.374 5.12 ± 0.378 5.55 ± 0.588a,b 0.013
Insulin (pmol/L) 35.1 (20.0–52.7) 38.2 (14.7–64.2) 43.7 (13.2–61.2) 0.928⁎ HOMA-IR 8.25 (4.57–12.4) 8.70 (3.21–15.2) 10.1 (4.07–15.5) 0.797⁎ Large LDL (mmol/L) 0.838 ± 0.317 1.08 ± 0.277 1.15 ± 0.301a 0.012
Small LDL (mmol/L) 0.241 ± 0172 0.372 ± 0.270 0.606 ± 0.321a,b 0.001
Large/small LDL ratio 5.02 ± 2.96 4.26 ± 2.84a 2.24 ± 1.22a,b 0.018
VLDL (mmol/L) 0.971 ± 0.387 1.13 ± 0.387 1.63 ± 0.744a,b 0.003 IDL (mmol/L) ox-LDL (mU/L) 1.07 ± 0.291 63.4 ± 23.2 1.32 ± 0.443 71.0 ± 16.0 1.42 ± 0.548 87.4 ± 27.2a 0.072 0.025
P values according to One way ANOVA test, post hoc“Tukey” and “Tamhane's T2” test. Data were expressed as mean ± SD. BMI: Body mass index.
WHR: Waist to hip ratio. WHtR: Waist to-height ratio. P < 0.05.
⁎P values according to Kruskal-Wallis test. Data were expressed as median (interquartile range for 25–75%). aSignificantly different from 1.tertile.
that highly significant associations have been found between hazard ratios for cardiovascular events and increases in non-fasting TG. In addition, the Norwegian study found that a non-fasting TG concentra-tion of 3.47 mmol/L or more was associated with a 5-fold risk of death from coronary heart disease and a 2-fold risk of total death in females compared to a concentration of < 1.49 mmol/L [23].
Various lipid-related indices have been proposed for the prediction of CVD. The ratios of TC to HDL-C and of LDL-C to HDL-C are well-known atherogenic indices. The Helsinki Heart Study showed that an increase in these ratios predicted a greater CVD risk in a wide range of cholesterol and TG concentrations, and that the risk is significantly higher when hypertriglyceridemia is also present [24]. In our study, these ratios gradually increased from the lower to the upper tertiles in both sexes. These changes were predominant in male subjects. Fur-thermore, it has been suggested that age has a significant effect on postprandial lipemia in healthy subjects [25]. Age showed an
increasing tendency from the lower to the upper tertiles (Tables 2 and 3). Similarly, age-related changes in postprandial lipemia have recently been discussed in the literature. Liu et al. [26] suggested that age-re-lated changes in gastric emptying time or intestinal absorption, or both, and age-related insulin resistance may play significant roles in this ef-fect. Our results corroborate these findings, since all lipid and lipo-protein parameters as well as anthropometric measurements and HOMA-IR in male subjects changed in the upper tertile compared to the bottom tertile. Undesirable changes in anthropometric variables, in-cluding enhanced abdominal fat seen in males in the upper tertile, were expected, as previously described [11]. Furthermore, abdominal obe-sity-related parameters such as WHR and WHtR in male subjects were higher than those in females in the present study, thus corroborating reports of greater abdominal obesity and loss of insulin sensitivity in males compared to females [4,27].
Finally, one of the salient features of the present study was that
Table 3
Anthropometric measurements and biochemical variables in females according to AUC tertiles (n = 15), mean ± SD [min–max].
Tertiles P 1 437 ± 54 [324–523] 2 626 ± 58 [528–722] 3 1121 ± 416 [761–2193] Age (years) 24 (19–30) 22 (18–30) 28 (19–31) 0.234⁎ BMI (kg/m2) 23.0 ± 3.3 25.3 ± 5.5 23.6 ± 4.4 0.365 WHR 0.76 ± 0.07 0.77 ± 0.06 0.81 ± 0.09 0.198 WHtR 0.464 ± 0.062 0.497 ± 0.077 0.510 ± 0.096 0.282
Postprandial 4 h TG (mmol/L) 0.793 ± 0.125 1.15 ± 0.190 2.32 ± 1.03a,b 0.0001
TG (mmol/L) 0.573 ± 0.090 0.811 ± 0.210 1.29 ± 0.542a,b 0.0001 TC (mmol/L) 4.31 ± 0.630 4.02 ± 0.487 5.30 ± 0.663a,b 0.0001 LDL-C (mmol/L) 2.29 ± 0.470 2.10 ± 0.455 3.0 ± 0.706a,b 0.0001 HDL-C (mmol/L) 1.71 ± 0.381 1.47 ± 0.195 1.45 ± 0.195a 0.024 TC/HDL-C ratio 2.57 ± 0.313 2.78 ± 0.477 3.73 ± 0.783a,b 0.0001 LDL-C/HDL-C ratio 1.39 ± 0.349 1.46 ± 0.405 2.11 ± 0.644a,b 0.0001 TG/HDL-C ratio 0.808 ± 0.229 1.29 ± 0.395 2.11 ± 1.02a,b 0.0001 Apo-A1 (g/L) 1.46 ± 0.235 1.45 ± 0.357 1.56 ± 0.349 0.591 Apo-B (g/L) 0.656 ± 0.140 0.726 ± 0.196 0.949 ± 0.196a,b 0.0001 ApoB/ApoA1 ratio 0.458 ± 0.118 0.523 ± 0.161 0.639 ± 0.191a 0.013 Glucose (mmol/L) 4.81 ± 0.361 5.0 ± 0.382 5.20 ± 0.473a 0.041 Insulin (pmol/L) 33.0 (12.0–59.2) 36.5 (12.0–69.6) 33.0 (16.6–63.6) 0.990⁎ HOMA-IR 7.05 (2.58–13.0) 8.11 (2.58–17.2) 7.33 (3.51–14.3) 0.861⁎ Large LDL (mmol/L) 0.654 ± 0.211 0.757 ± 0.284 0.799 ± 0.368 0.389 Small LDL (mmol/L) 0.158 ± 0.139 0.228 ± 0.170 0.353 ± 0.272a 0.035 Large/small LDL ratio 8.13 ± 8.88 4.73 ± 2.56 3.95 ± 4.24 0.129 VLDL (mmol/L) 0.828 ± 0.338 1.03 ± 17.5 1.13 ± 0.569 0.211 IDL (mmol/L) ox-LDL (mU/L) 0.913 ± 0.274 40.8 ± 6.92 1.10 ± 0.261 43.0 ± 10.8 1.22 ± 0.347a 59.1 ± 15.4a,b 0.023 0.0001
P values according to One way ANOVA test, post hoc‘Tukey’ and ‘Tamhane's T2’ test. Data were expressed as mean ± SD. BMI: Body mass index.
WHR: Waist to hip ratio. WHtR: Waist to-height ratio. P < 0.05.
⁎P values according to Kruskal-Wallis test. Data were expressed as median (interquartile range for 25–75%). aSignificantly different from 1.tertile.
bSignificantly different from 2.tertile.
Fig. 1. Distribution of postprandial 4 h triglyceride and AUC values in female and male. Lines indicate cut-off levels. Postprandial 4 h triglyceride cut-off levels for female and male were 3.20 mmol/L and 4.59 mmol/L, respectively.
postprandial 4 h TG and AUC values exhibited similar distribution (Fig. 1). Cohen's kappa statistic was used to assess the agreement be-tween AUC values and postprandial 4-hour TG concentrations. While perfect agreement was determined for the female and male subgroups, only moderate agreement was observed for the total study group. In essence, our results supported the expert panel opinion that TG con-centrations 4 h after OFTT provide a good evaluation of the post-prandial TG response [7]. These may thus be preferred over the use of AUC values, a time-consuming process (up to 6 or 8 h) that necessitates the taking of at least 4 blood specimens.
The main limitation of this study was that the low number of sub-jects in the study group due to the difficulty of classic OFTT application. If the number of participants had been higher, AUC could have been categorized according to quartiles instead of tertiles. Further studies in which these disadvantages are eliminated are therefore now required.
In conclusion, ourfindings suggest that postprandial lipemia may display considerable gender differences. The cut-off values for post-prandial TG concentrations in males and females should therefore be determined and evaluated separately. Moreover, postprandial lipemia may be associated with an increased atherogenic tendency by changing lipid, lipoprotein, sdLDL and oxLDL concentrations, especially in males. Additionally, 4 h postprandial TG concentrations were found to be useful and reliable in the evaluation of postprandial lipemia.
AcknowledgmentFunding
This study was supported by the Karadeniz Technical University Research Fund (Project code: BAP11642).Disclosures
None of the authors has any conflicts of interest. References
[1] K.G. Jackson, S.D. Poppitt, A.M. Minihane, Postprandial lipemia and cardiovascular disease risk: interrelationships between dietary, physiological and genetic de-terminants, Atherosclerosis 220 (2012) 22–33.
[2] B.G. Nordestgaard, A. Langsted, S. Mora, G.D. Kolovou, H. Baum, E. Bruckert, G.F. Watts, G. Sypniewska, O. Wiklund, J. Borén, M.J. Chapman, C. Cobbaert, O.S. Descamps, A. von Eckardstein, P.R. Kamstrup, K. Pulkki, F. Kronenberg, A.T. Remaley, N. Rifai, E. Ros, M. Langlois, Fasting is not routinely required for determination of a lipid profile: clinical and laboratory implications including flagging at desirable concentration cut-points a joint consensus statement from the European Atherosclerosis Society and European Federation of Clinical Chemistry and Laboratory Medicine, Eur. Heart J. 37 (2016) 1944–1958.
[3] G.D. Kolovou, D.P. Mikhailidis, J. Kovar, D. Lairon, B.G. Nordestgaard, T.C. Ooi, P. Perez-Martinez, H. Bilianou, K. Anagnostopoulou, G. Panotopoulos, Assessment and clinical relevance of non-fasting and postprandial triglycerides: an expert panel statement, Curr. Vasc. Pharmacol. 9 (2011) 258–270.
[4] A.A. Elte, H.C.T. van Zaanen, A.P. Rietveld, M.C. Cabezas, Novel aspects of post-prandial lipemia in relation to atherosclerosis, Atherosclerosis (Suppl. 2) (2008) 39–44.
[5] K.K. Berneis, R.M. Krauss, Metabolic origins and clinical significance of LDL
het-erogeneity, J. Lipid Res. 43 (2002) 1363–1379.
[6] J. Millán, X. Pintó, A. Muñoz, M. Zúñiga, J. Rubiés-Prat, F.L. Pallardo, L. Masana, A. Mangas, A. Hernández-Mijares, P. González-Santos, J.F. Ascaso, J. Pedro-Botet, Lipoprotein ratios: physiological significance and clinical usefulness in cardiovas-cular prevention, Vasc. Health Risk Manag. 5 (2009) 757–765.
[7] R. Quispe, R.J. Manalac, K.F. Faridi, M.J. Blaha, P.P. Toth, K.R. Kulkarni, K. Nasir, S.S. Virani, M. Banach, R.S. Blumenthal, S.S. Martin, S.R. Jones, Relationship of the triglyceride to high-density lipoprotein cholesterol (TG/HDL-C) ratio to the re-mainder of the lipid profile: the very large database of lipids-4 (VLDL-4) study, Atherosclerosis 242 (2015) 243–250.
[8] T. McLaughlin, G. Reaven, F. Abbasi, C. Lamendola, M. Saad, D. Waters, J. Simon, R.M. Krauss, Is there a simple way to identify insulresistant individuals at in-creased risk of cardiovascular disease? Am. J. Cardiol. 96 (2005) 399–404. [9] A. Cordero, M. Laclaustra, M. León, J.A. Casasnovas, A. Grima, E. Luengo,
B. Ordoñez, C. Bergua, M. Bes, I. Pascual, E. Alegría, Comparison of serum lipid values in subjects with and without the metabolic syndrome, Am. J. Cardiol. 102 (2008) 424–428.
[10] J. Borén, N. Matikainen, M. Adiels, M.R. Taskinen, Postprandial hypertriglycer-idemia as a coronary risk factor, Clin. Chim. Acta 431 (2014) 131–142. [11] C. Couillard, N. Bergeron, D. Prud'homme, J. Bergeron, A. Tremblay, C. Bouchard,
P. Mauriège, J.P. Després, Gender difference in postprandial lipemia: importance of visceral adipose tissue accumulation, Arterioscler. Thromb. Vasc. Biol. 19 (1999) 2448–2455.
[12] M. Ashwell, P. Gunn, S. Gibson, Waist-to-height ratio is a better screening tool than waist circumference and BMI for adult cardiometabolic risk factors: systematic re-view and meta-analysis, Obes. Rev. 13 (2012) 275–286.
[13] K. Szosland, A. Lewinski, In quest for method of insulin resistance assessment in
and third tertiles (3T) of female and male.
Asteriks shows that differences between male and female were statistically significant, *P < 0.05, **P < 0.005. P shows differences between females and males according to student t-test.
Table 4
Correlation coefficients showing the relation between atherogenic indicates and post-prandial lipemia in female and male.
Female (n = 45) Male (n = 51) AUC TG 4 h P AUC TG 4 h P r r TC/HDL-C ratio 0.755 0.697 < 0.001 0.845 0.825 < 0.001 LDL-C/HDL-C ratio 0.698 0.658 < 0.001 0.791 0.784 < 0.001 TG/HDL-C ratio 0.921 0.876 < 0.001 0.921 0.846 < 0.001 ApoB/ApoA1 ratio 0.497 0.489 < 0.01 0.634 0.628 < 0.001 sdLDL 0.380 0.423 < 0.05 0.582 0.577 < 0.001 ox-LDL 0.616 0.585 < 0.001 0.346 0.364 < 0.05
P value according to Pearson and *Spearman tests and indicates for AUC and TG 4 h coefficients.
everyday clinical practice Insulin resistance indices, Diabetol. Metab. Syndr. 10 (2016) 120–125.
[14] J.N.S. Matthews, D.G. Altman, M.J. Campbell, P. Royston, Analysis of serial mea-surements in medical research, Br. Med. J. 300 (1990) 230–235.
[15] G.L. Vega, P.T.S. Ma, N.B. Cater, Effects of adding fenofibrate (200 mg/day) to simvastatin (10 mg/day) in patients with combined hyperlipidemia and metabolic syndrome, Am. J. Cardiol. 91 (2003) 956–960.
[16] G.D. Kolovou, K.K. Anagnostopoulou, S.S. Daskalopoulou, D.P. Mikhailidis, D.V. Cokkinos, Clinical relevance of postprandial lipaemia, Curr. Med. Chem. 12 (17) (2005) 1931–1945.
[17] Y. Ozarda, K. Ichihara, D. Aslan, H. Aybek, Z. Ari, F. Taneli, A multicenter na-tionwide reference intervals study for common biochemical analytes in Turkey using Abbott analyzers, Clin. Chem. Lab. Med. 52 (2014) 1823–1833. [18] J.E. Hokanson, M.A. Austin, Plasma triglyceride level is a risk factor for
cardio-vascular disease independent of high-density lipoprotein cholesterol level: a meta-analysis of population-based prospective studies, J. Cardiovasc. Risk 3 (1996) 213–219.
[19] J.H. Bae, E. Bassenge, K.B. Kim, Y.N. Kim, K.S. Kim, H.J. Lee, K.Y. Park, M. Schwemmer, Postprandial hypertriglyceridemia impairs endothelial function by enhanced oxidant stress, Atherosclerosis 155 (2001) 517–523.
[20] S.D. Proctor, D.F. Vine, J.C. Mamo, Arterial retention of apolipoprotein B(48)- and B(100)-containing lipoproteins in atherogenesis, Curr. Opin. Lipidol. 13 (2002)
461–470.
[21] S. Bansal, J.E. Buring, N. Rifai, S. Mora, F.M. Sacks, P.M. Ridker, Fasting compared with nonfasting triglycerides and risk of cardiovascular events in women, JAMA 298 (2007) 309–316.
[22] A.S. Lindman, M.B. Veierod, A. Tverdal, J.I. Pedersen, R. Selmer, Nonfasting tri-glycerides and risk of cardiovascular death in men and women from the Norwegian counties study, Eur. J. Epidemiol. 25 (2010) 789–798.
[23] I. Stensvold, A. Tverdal, P. Urdal, S. Graff-Iversen, Non-fasting serum triglyceride concentration and mortality from coronary heart disease and any cause in middle aged Norwegian women, BMJ (6915) (1993) 1318–1322.
[24] V. Manninen, L. Tenkanen, P. Koskinen, et al., Joint effects of serum triglyceride and LDL cholesterol and HDL cholesterol concentrations on coronary heart disease risk in the Helsinki Heart Study, implications for treatment, Circulation 85 (1992) 37–45.
[25] J.S. Issa, J. Diament, N. Forti, Postprandial lipemia: influence of aging, Arq. Bras. Cardiol. 85 (2005) 15–19.
[26] H.H. Liu, J.J. Li, Aging and dyslipidemia: a review of potential mechanisms, Ageing Res. Rev. 19 (2015) 43–52.
[27] S. Lemieux, J.P. Després, S. Moorjani, A. Nadeau, G. Thériault, D. Prud'homme, A. Tremblay, C. Bouchard, P.J. Lupien, Are gender differences in cardiovascular disease risk factors explained by the level of visceral adipose tissue? Diabetologia 37 (1994) 757–764.