DEVELOPMENT OF A WEBGIS BASED AIR QUALITY GEOPORTAL FOR MONITORING AND MANAGING AIR QUALITY IN ISTANBUL
Fatih SARI
Selçuk Üniversitesi, Çumra Uygulamalı Bilimler Yüksekokulu, Konya, TURKEY [email protected]
(Geliş/Received: 31.10.2019; Kabul/Accepted in Revised Form: 17.12.2019)
ABSTRACT: This study describes the development of an Air Quality GeoPortal (AQG) via a Web-based Geographic Information System (WebGIS) in Istanbul in Turkey. The system has been developed for online use to present the concentrations of PM10, SO2, NOX, NO, NO2 CO, as well as meteorological data (temperature, humidity, wind speed and direction) based on hourly data from each air quality monitoring station. A prototype system is providing the viewing, querying and downloading of up-to-date air quality maps on web pages via a Web Based GIS system based on Open Geospatial Consortium (OGC) web services. Furthermore, the integration of a Web Map Service-Time (WMS-T) with air quality data allows users to access previous data and related maps by specifying a time value on a web page. Thus, it is possible to download air quality parameters in desktop GIS systems and web pages in map format for a desired time interval. The system architecture is based on open source software integration including GeoServer and OpenLayers functions, MySQL database for data management, with HTML, JavaScript and PHP as programming languages in both the server and client scripting. Furthermore, the user interfaces are programmed to provide user-data interaction via web. The application includes the facility to download air quality data on an hourly basis raster (Tiff, Bmp, and Jpeg) and vector (ShapeFile, GML, Json and CSV) format.
Key Words: Air Quality Monitoring, WebGIS, GeoPortal, Web Services, Interoperability
İstanbul İlinde Hava Kalitesi İzleme ve Yönetimi için WebGIS Tabanlı Hava Kalite GeoPortalı Tasarımı
ÖZ: Bu çalışmada İstanbul ili için WebCBS tabanlı Hava Kalite Geoportalı (HKG) tasarımını içermektedir. Sistem, havada bulunan PM10, SO2, NOX, NO, NO2 CO konsantrasyonlarını ve bununla birlikte meteorolojik parametrelerin de (sıcaklık, nem, rüzgâr hızı ve rüzgar yönü) ölçüm istasyonları bazında saatlik olarak online şekilde görülebilmesini sağlamaktadır. HKG sistemi Open Geospatial Consortium (OGC) web servislerini kullanarak hava kalite haritalarının sunumunu, indirilmesini ve sorgulanmasını sağlayacak şekilde geliştirilmiştir. Ayrıca WMS-T web servis standardının da sisteme entegre edilmesi ile birlikte belirli bir zamana ait haritalara ulaşma ve sorgulama mümkün olabilecektir. Böylelikle istenilen zamana ait hava kalitesi verileri masaüstü CBS yazılımlarında kullanılabilecek yada web sayfasında görüntülenebilecektir. HKG sistemi openlayers ve Geoserver entegrasyonu ile oluşturtulmuş olup MySQL veritabanı yönetim sistemi ve hem sunucu hem de istemci taraflı kodların yazılması için HTML, PHP ve JavaScript kodlarını içermektedir. GeoPortal ara yüzü kullanıcı odaklı olarak ve verilerle etkileşim içerisinde bulunulabilecek şekilde tasarlanmıştır. Uygulama aynı zamanda saatlik hava kalitesi verisini raster (Tiff, Bmp, and Jpeg) ve vektör (ShapeFile, GML, Json and CSV) formatta indirmeye olanak verecek şekilde tasarlanmıştır.
INTRODUCTION
Monitoring and determining air quality is becoming more important in fast developing cities, various authors have reported that rapid economic development, urbanization and population growth in large cities has led to severe air pollution in urban areas (Liu et al., 2008; Guéguen et al., 2011; Ma et al., 2011). As cities expand the level of the emissions of air pollutants increases due to home heating, vehicles and industrial activities. These pollutants include; carbon monoxide (CO), particulate matter (PM10), ground level ozone (O3), nitrogen dioxide (NO2), nitrogen oxides (NOx), and sulfur dioxide (SO2) (Lippmann, 2003; Brunekreef and Holgate, 2002; Kassomenos et al., 2008). The outdoor level of nitrogen dioxide (NO2) is an indicator of any combustion-related process. SO2 and chemical substances such as polychlorinated biphenyls (PCBs) and PAHs are a result of industrial and human activities, such as use of vehicles and residential heating facilities (Cooper et al., 1996; Biterna and Voutsa, 2005). Particulate matter (PM) can carry multiple trace elements and polycyclic aromatic hydrocarbons (PAHs) that can have harmful effects on reproductive health (Zhou et al., 2014). The amount of pollution in cities has an effect on human health with children and the elderly particularly at risk therefore, it is important to monitor air quality continuously to determine the distribution and levels of pollutants. It is estimated that more than 1 billion people are exposed to outdoor air pollution annually. Urban air pollution is linked to up to 1 million premature deaths and 1 million pre-native deaths each year (UNEP, 2015). Douglas et al, (1993) declared that there is a association between particulate air pollution and daily mortality rates and gorund-level ozone O3 and fine particulate matter PM2.5 are associated with increased risk of mortality (Fann et al, 2011).
To ensure the public good, air quality information must be transparently available to all stakeholders, from citizens to authorities to industry. Hence the need for a portal, and its supporting needs for data storage, management, retrieval and visualization. Many cities have continuous ambient air quality stations located in urban areas with measurements typically used to assess the ambient air quality against national standards for air pollutants (Elangasinghe et al., 2014). Since air quality is a public good its socially optimal level of provision cannot be ensured through markets. Therefore, the responsibility for this provision is generally allocated to the environmental authorities, which have to set policies and regulations to mitigate pollution externalities (Westerlund et al., 2014). Air quality monitoring is one of the tools available to these institutions to manage effects of air pollution. Thus, data storage, management, analysis and mapping platform is required to monitor air quality efficiently.
Geographical Information Systems (GIS) plays a major role in interacting with spatial data in the view, analyze, query and storage fields. Thus, GIS facilities allow for the evaluation, modeling, analyzing, determining and mapping of air quality. However, multi-disciplinary projects that work with distributed databases and access the updated data requires an interoperability concept and there must be some protocols to access the spatial data. However, with desktop GIS systems, it is being expensive to get licenses of softwares. Currently, Web based GIS systems (WebGIS) provide a way of interacting with spatial data through internet without installing any software and entirely open source.
In addition to desktop GIS, over the past decade WebGIS have been making rapid progress and due to the innovations and developments in software, hardware and networking, WebGIS have become the preferred system. Fast processing units, a large amount of memory allows the analysis of high-resolution raster images, intensive algorithms, data visualizations and spatial analysis (Kulawiak et al., 2010). Additionally, network bandwidths and sharing large amount of data through the internet makes WebGIS applications more suitable and useful for multi-user systems.
Another concept in the WebGIS structure is the GeoPortal system, which allows users to access spatial data and its metadata via web interfaces. GeoPortal Systems are generated to provide accessing, querying, visualizing functions of spatial data based on WebGIS structure. There are many different GeoPortal definitions are available in the literature which highlight accessing spatial data via the web. BEA (2008) systems defined the GeoPortal as a website, which is only one way to access spatial data and its applications. The Java Portlet specification defines the GeoPortal as personal or common web applications which combine spatial data from different sources or data providers (Abdelnur and Hepper, 2003).
According to the ESRI, (2013), GeoPortal is a system to access spatial data without depending on location, format and data types. The Open Geospatial Consortium (OGC) defines the GeoPortal as a human interface to collect online spatial data sources, spatial datasets and services together (OGC, 2004).
In the literature, there are several GIS based applications that model and analyze air quality to determine air pollution. This research aims to constitute a model to measure air quality and include spatial analysis, data store and GIS based solutions. Although there are several GIS based solutions for determining air quality, unfortunately there are few models that integrate WebGIS solutions and web services to monitor or measure air quality.
It is possible to divide air quality literature into modeling, modeling via GIS and determination via WebGIS. Modelling refers to a set of scientific methods that are used to represent the complicated processes that govern meteorology and the behavior of pollutants in the atmosphere (British Columbia, 2014). The use of GIS adds extra value to air quality modeling with data management, visualization and query functions. Lin and Lin, (2002), Jensen et al., (2001) and Bellander et al., (2001) have developed systems to measure transport and traffic-related air pollution and air quality according to the streets through GIS. Some research on GIS based air quality determining in urban areas has been developed by Puliafito et al., (2003), Cyrys et al., (2005), Elbir et al, (2010), Vienneau et al., (2009), Bealey et al., (2007) and Dalvi et al., (2006) including air quality management systems and GIS based air pollution models. Elbir, (2004), Cinderby and Forrester, (2005) and Lim et al., (2005) have developed GIS based air quality monitoring systems as decision support system and air quality monitoring tools.
Although various authors have developed GIS based solutions for determining air quality the results are never fully used because other users such as local institutes and scientific organizations are unable to access the data. In order to efficiently use and analyze the air quality data, the concept of interoperability should be established for the sharing and accessing data via WebGIS. The limited amount of research into WebGIS (Gkatzoflias et al., 2013) and (Triantafyllou et al., 2006) shows that there is a gap in the field of management and modeling air quality via this system. Real-time Air Quality Index Visual Map (AQI, 2015) is serving air quality index value around the world. The system is only serving AQI values and not including any map illustration of parameters and also download option. The download option is only provided by EarthExplorer (USGS, 2015), however, this system is not serving air quality data and including MODIS land surface temperature and emission data. Tropospheric Emission Monitoring Internet Service (TEMIS, 2015) is supplying air quality parameters with radar illustrations. The data are being provided at world scale and it is possible to query with time parameter. Airnow AQI forecast is applied by Airnow (2015), to vizualizate AQI in America. The system only serves AQI value with limited map illustration.
The Air Quality GeoPortal (AQG) aims to add functionality to air quality researches through a new approach and resolve the problem of both the accessibility of the raw and analyzed air quality data in an innovative way. The main aim of the current study is to create a GeoPortal system based on WebGIS via web services to provide accessible and usable air quality data and maps through the web with user-friendly interfaces. Due to the interoperability platform the AQG system can be easily used by environmental authorities and scientific organizations. Web services and time based web services are used to generate maps through the interaction of web interfaces and OGC standards. One of the important objectives of the AQG is demonstrated by the download service within the GeoPortal which allows users to obtain air quality data in both map and numerical format for desired time interval. Thus, this download service and the WMS-T application, which WMS-T is a OGC standard to retrieve data according to time parameter, fill the gap in the existing air quality research via WebGIS.
Development of the Air Quality GeoPortal
GIS is important in terms of analyzing air quality, however, it is easier to share-view data and establish interoperability concept between all stakeholders via WebGIS. The system aims to provide an infrastructure for air quality data to ensure use of data both web pages or within GIS softwares via WMS or WFS database connection tools. Viewing and downloading options of historic data for both GIS and
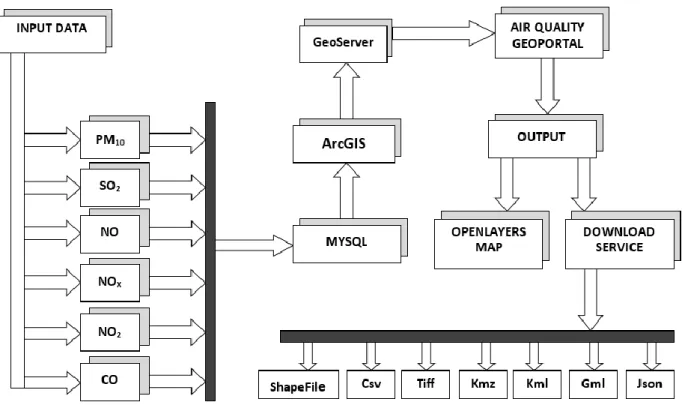
non GIS expertise users become possible with this system. The system is also become a technical platform for all air quality data users without installing any software with adhering to OGC standards. The data to examine air quality will be accessible with a single web site with all other functions as like download ability of common data formats, query according to a time interval and view maps via web pages. These facilities will be achieved by constituting a GeoPortal system based on WebGIS but some options such as download and temporal query should be programmed manually within the GeoPortal system. The details of developed interface and services are explained in this section with the main structure of the GeoPortal given in Fig.1.
Figure 1.Air quality geoportal system structure
As can be seen in Figure 1, The AQG uses several softwares which are orchestrated to constitute AQG including database, GIS, Geographical Data Server and additional JavaScript codes. The output of any software is being an input data to another software and the processes are realized considering the requirements of softwares. Constituted platform requires to consider data formats, coordinate systems, licenses and web protocols to transfer data between softwares.
Study Area
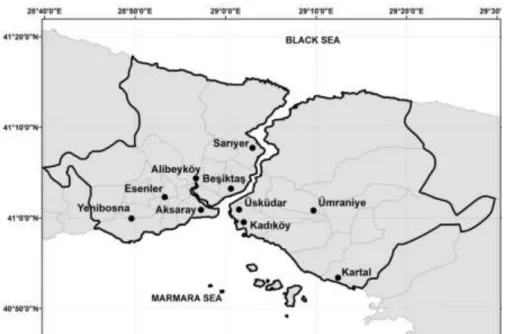
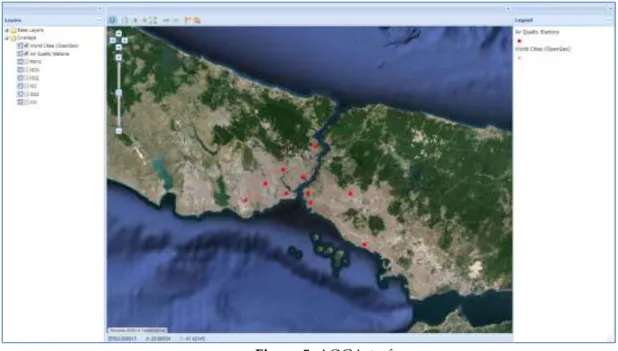
Istanbul has a population of 14,16 million and it is one of fastest growing mega cities. The large population together with the rapid growth of the urban area, inappropriate site selection for industrial facilities, the use of old technologies in industry and vehicles all contribute to air pollution, which is a serious problem in the city. Monitoring the air quality in the city is an essential first step to determining the measures to reduce air pollution. There are ten air quality observation stations located around Istanbul city centre. These stations observe and record ambient temperature, wind direction, wind speed, relative humidity, pressure, rain, PM10, SO2, NO, NO2, NOX and CO values. The stations and the surrounding study area are given in Fig.2.
Figure 2.Study area and monitoring stations
Air Quality Data Preparation
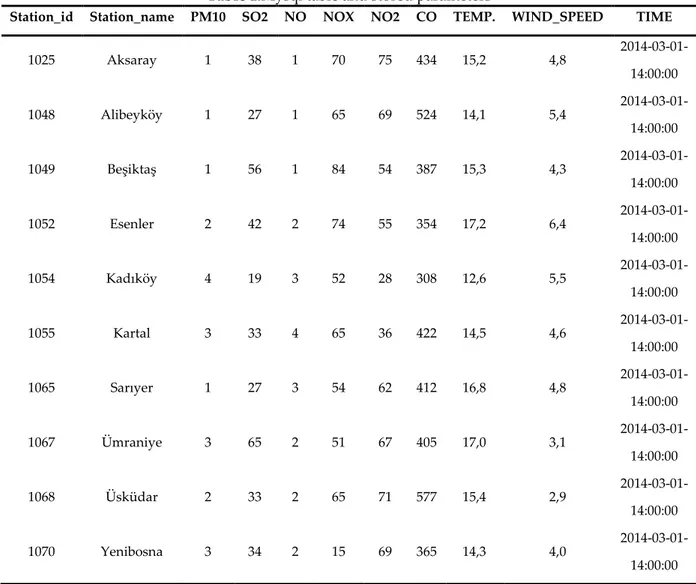
The Air Quality GeoPortal (AQG) retrieve hourly measurements of PM10, SO2, NOX, NO, NO2 and CO from 01.03.2014 to 01.03.2000 for each of the stations. Since the air quality is measured hourly, it is necessary to use a database system. In the current study, the values are stored in MySQL database; both the GeoServer and ArcGIS include connection tools to the MySQL database. The GeoServer software can retrieve data from the MySQL database and present the data via web services. However, presenting table data without any map presentation limits the objective of the AQG thus the MySQL database is used in ArcGIS to produce the maps. The combination of ArcGIS and MySQL constitutes good integration for data management and mapping functions in GIS and WebGIS concept. AQG retrieves data from ArcGIS automatically, thus up-to-dated data can be integrated without any user interact processes. Part of the MySQL table for the measurements taken at 01.03.2014-14:00:00 are given in Table 1.
Table 1.Mysql table and stored parameters
Station_id Station_name PM10 SO2 NO NOX NO2 CO TEMP. WIND_SPEED TIME
1025 Aksaray 1 38 1 70 75 434 15,2 4,8 2014-03-01-14:00:00 1048 Alibeyköy 1 27 1 65 69 524 14,1 5,4 2014-03-01-14:00:00 1049 Beşiktaş 1 56 1 84 54 387 15,3 4,3 2014-03-01-14:00:00 1052 Esenler 2 42 2 74 55 354 17,2 6,4 2014-03-01-14:00:00 1054 Kadıköy 4 19 3 52 28 308 12,6 5,5 2014-03-01-14:00:00 1055 Kartal 3 33 4 65 36 422 14,5 4,6 2014-03-01-14:00:00 1065 Sarıyer 1 27 3 54 62 412 16,8 4,8 2014-03-01-14:00:00 1067 Ümraniye 3 65 2 51 67 405 17,0 3,1 2014-03-01-14:00:00 1068 Üsküdar 2 33 2 65 71 577 15,4 2,9 2014-03-01-14:00:00 1070 Yenibosna 3 34 2 15 69 365 14,3 4,0 2014-03-01-14:00:00 Programming languages
The AQG using Php, JavaScript and Html programming languages with the AQG interfaces and functions are being programmed with JavaScript to provide client-side operations. For temporal queries, the server-side system architecture must be used to send the time variable to server for processing. Thus, the Php programming language is used for the downloading and temporal queries. The AQG interface is programmed with HTML codes and styled with Css files.
Web Services and GeoPortal interface
Web Services are the core objective of Geoportal systems in implementing existing OGC standards for air quality monitoring and serving data to the users such as scientific researchers, institute and organizations staff that are working on air quality, GIS users and citizens. Web service standards are developed under OGC specifications such as Web Map Service (WMS), Web Feature Service (WFS) and Web Coverage Service (WCS). WMS represents spatial data as dynamic images which are referenced geographically (Beaujardiere, 2006). WMS establishes a bridge between clients and servers to obtain the digital image of spatial data. The web services are generated with GeoServer open source software compiled in the Java programming language and includes functions for the sharing, serving and editing
spatial data. GeoServer is supported and developed by several organizations around the world. GeoServer is a reference application of some of the OGC standards as like WFS, WCS and WMS.
GeoServer generates web services pertaining to spatial data including spatial data management and web service configuration interfaces. The GeoServer software is integrated with the OpenLayers JavaScript library to allow the viewing web services on web pages. OpenLayers is a JavaScript Library that is under an open source initiative to develop dynamic map applications on web pages. OpenLayers can be utilized without depending on server computers. Thus, it provides efficient and advanced applications for client-side programming and working with Google Maps API to realize geographical applications on the web.
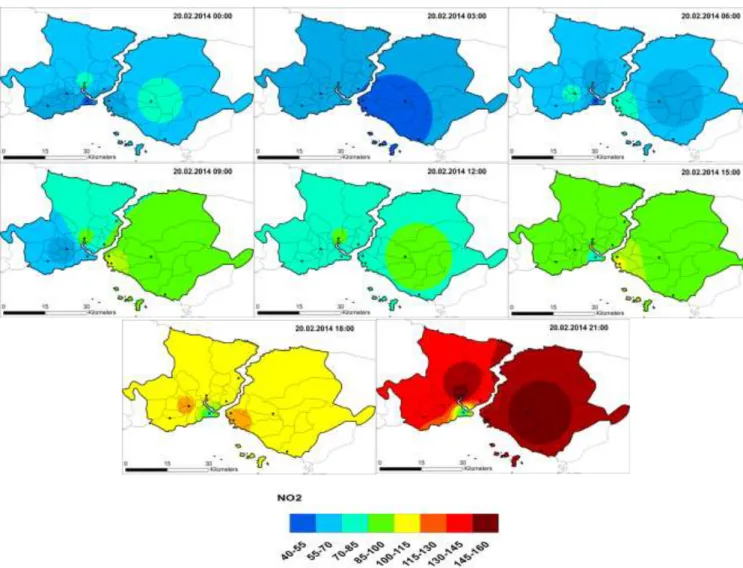
Air quality parameter values are provided in table format in the MySQL database however, presenting air quality parameters in a visual format as a map makes the data understandable and clear for the user. Thus, density maps are produced in ArcGIS software to present air quality as raster image. ArcGIS software has efficient tools to produce maps of good cartographic design. For each variable and time, density maps are produced to be able to constitute web services in raster format in GeoServer. In Fig.3, some examples of the time request results for NO2 values are presented over every 3-hour period for 20.02.2014.
Figure 3.Density maps for NO2 at 20.02.2014 for each 3-hour period
The output raster images (in tif format) are integrated into web services with GeoServer software. In total, six web services (for PM10, SO2, NOX, NO, NO2, CO, temperature and wind speed) were generated within the GeoServer software and integrated into AQG to be able to view and download. For the purpose
of viewing raster image on web pages, an URL must be entered into web browsers. The URL is generated by the GeoServer software which includes web service parameters such as layer name, coordinate system, geographical extent values, symbology file and output format. An example URL is given below.
http://127.0.0.1:8081/geoserver/cite/wms?service=WMS&version=1.1.0&request=Ge tMap&layers=cite:raster&styles=&bbox=30.0,25.0,45.0,70.0&width=550&height=330 &srs=EPSG:4326&format=application/openlayers
The map is simple and provides users with only view functions. A sample map with the GeoServer layer preview option in OpenLayers is given in Fig.4.
Figure 4. Default OpenLayers layer preview option
Since the air quality values were being measured hourly and daily, it was very important to request web services temporally. To achieve this, Web Map Service –Time (WMS-T) standard is used to interact with map services with time parameter. WMS-T is a standard which is similar to WMS specification and requires a time parameter to generate GetMap request. A WMS-T GetMap request is required to define a time variable as “TIME=” code at the end of request. WMS-T supports the time from years to seconds as YY/MM/DD HH:MM:SS. For instance, if a user wishes to display air quality for 23.04.2014 at 14:00 PM, the request is generated as “TIME=2014-04-23 14:00:00”. This system provides access to the air quality value for any desired time within the same web service. The structure also provides a view of the raster images at any time with a single web service. A GetMap request with time variable is given below.
http://127.0.0.1:8081/geoserver/it.geosolutions/wms?service=WMS&version=1.1.0 &request=GetMap&layers=it.geosolutions:raster&styles=&bbox=30.0,25.0,45.0,70. 0&width=550&height=330&srs=EPSG:4326&format=application/openlayers&TIME=2014-04-23T14:00:00:000Z
As can be seen in the URL above, there are too many parameters to define and it is possible to make mistakes when typing the URL. Therefore, it is necessary to develop advanced web applications and use WMS functions to create a script that operates within the interfaces. Thus, clicking or adding a layer will generate the URL and other related functions. The best way to interact with WMS and use all the functions is to utilize the Heron Mapping Client (MC) JavaScript library.
Heron-MC provides a user interface for the GeoPortal and WebGIS applications by supplying JavaScript libraries. Heron-MC supports a flexible and open source development environment for users and developers. Adding new functions and integrate new services into the client is possible and easy with its flexible structure with JavaScript and HTML programming languages. Heron-MC interface is suitable
for use as a GeoPortal interface due to the functions of view, query, display attribute data and other tools with client-side application. Because of GeoPortal system is just a web site, users are not required to download any installation files or setup any software environments.
Heron-MC GeoPortal interface contains the necessary tools to interact with the spatial data and plays a holder role for all the toolbars and operation buttons. The interface consists of a map window to display the spatial data, an attribute table to view attribute data of desired geographic object in spatial dataset, a legend window to display symbology and the legend information of spatial data displayed in the map window, an information bar to display the coordinate system name and coordinate values of the mouse cursor and a map toolbar to interact with the map window to change current the view of the map. The interface is a management platform of the web services and its properties.
Fig.5 shows the AQG interface which consists of five modules. One the left, a layer tree is established in order to o select web services and view. Each layer tree item is related to the web service URL. In the middle of the page, a map window is inserted to view data. In addition, global maps such as Google, Yahoo and Bing Maps can be integrated into the map window. On the right a legend window is inserted to explain the selected layers. At the bottom of the interface, an attribute table window is established to view the attribute data of selected items on the maps.
Figure 5. AQG interface
Sample codes to define the AQG map and web services are given below. map.settings and map.layers define the web service and map relation for each web service. Thus, web service integration is achieved within the AQG interface.
Heron.options.map.settings = {projection: 'EPSG:4326',units: 'm',maxExtent: '-180.0, -90.0, 180.0, 90.0', center: '32.498, 37.884',xy_precision: 3,zoom: 14,theme: null
Heron.options.map.layers = [ new OpenLayers.Layer.WMS
("Air_Quality_25741", "http://193.255.248.21:8080/geoserver/wms?", { layers: "Air:CO_Istanbul", transparent: true, format: "image/gif" },
{isBaseLayer: false, buffer: 0, visibility: false, featureInfoFormat: "application/vnd.ogc.gml"} ),]
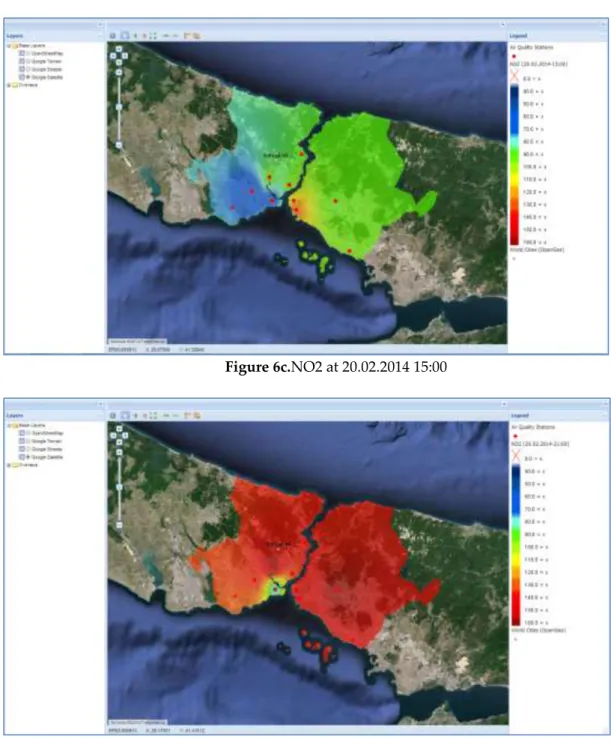
In Figs.6a, 6b, 6c and 6d, the AQG interface is given for NO2 at 20.02.2014. The legend window displays the legend of the selected web services to identify the classes of maps.
Figure 6a.NO2 at 20.02.2014 00:00
Figure 6c.NO2 at 20.02.2014 15:00
Figure 6d.NO2 at 20.02.2014 21:00
To define the time parameter, a calendar is integrated to the GeoPortal interface. Specified time parameter will be added at the end of GetMap URL in “TIME=” format.
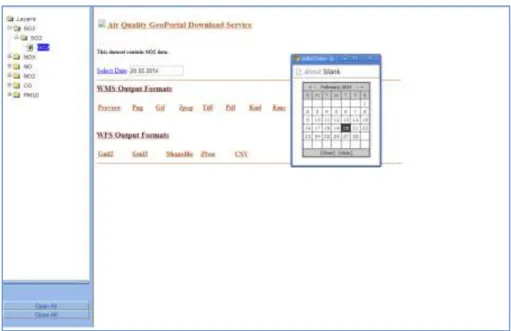
Download Service
As mentioned above, downloading data is an important function in determining air quality. In particular, GIS users and environmental authorities are required to access air quality data within a GIS platform or any other software. To respond to this demand the download service was developed to provide access to the daily historic air quality data. This service is based on GetMap request “FORMAT=” parameter to define the file format.
However, the output format are specified according to the web service type; WMS supports Kml, Kmz and Tiff with WFS supporting Json, Shapefile, Csv and Gml2 file formats. Thus, GetMap requests the
appropriate URL according to the file format. The GetMap request URL for WMS and WFS are given in Table 2.
Table2.WMS and WF output formats
In contrast, the format of time variable is created in keeping with the file format parameter. If the time parameter is not specified, the file will be downloaded in default time which is specified in GeoServer software for each layer in this case the data cannot be downloaded for desired time. Sample URLs for WFS GML2 and WMS KML output formats are given in Table 3.
Table3.WMS and WFS output format URL
Web Service Download URL
WFS http://193.255.248.21:8080/geoserver/ows?service=WFS&version=1.0.0&request=Get Feature&typeName=PORTAL:auAdministrativeBoundaryCountry&maxFeatures=5 0&outputFormat=GML2&TIME=2014-04 23T14:00:00.000Z WMS http://193.255.248.21:8080/geoserver/wms?service=WMS&version=1.1.0&request=G etMap&layers=PORTAL:auAdministrativeBoundaryCountry&styles=&bbox=26.02 4,35.81,44.879,42.092&width=990&height=330&srs=EPSG:4326&format=kml&TIME =2014-04 23T14:00:00.000Z
The download service was developed using the Php programming language to send the user selection file format and generate the GetMap request in the client computers. The generated GetMap request will be sent to the server computer and GeoServer software will process the request. At the same time, in response to the request, the selected file format will sent from the server to the client computer. Since the download service operates by generating GetMap request, it is very easy to add new file formats according to the WMS and WFS output formats considering the desired use. The flexible structure of download service gives functionality to the AQG. The download interface is presented in Fig.7.
Web Service Format Format parameter in URL
WMS Kml format=kml Kmz format=kmz Tiff format=image/tiff WFS Json outputFormat=application/json Shapefile outputFormat=shape-zip Csv outputFormat=csv Gml2 outputFormat=GML2
Figure 7.Download service interface
CONCLUSIONS
The Air Quality GeoPortal (AQG) provides a platform to access and share air quality data. Between institutes and scientific organizations involved in air quality monitoring. The Web interfaces are based on the interoperability concept and the accessing and downloading data options are realized with AQG. The air quality data becomes accessible via web pages within the GIS functions. On the other hand, with sharing WMS addresses, it is possible to use the air quality data in desktop GIS systems. Thus, users can select options to generate map and graphic illustrations, undertake spatial analysis, and make queries in desktop GIS software. AQG is an example of open source software and OGC standard implementation in air quality monitoring. Applying the WMS-T web service standard to air quality data is the main contribution of this study. Furthermore, the interfaces for WMS-T that were developed provides a good example of a model of integration between the WMS-T standard, the programming language (Php) and GeoPortal systems.
Because of air quality has a vital importance on human health, additional to air quality parameters data, some environmental data can be supplied such as traffic density, industrial areas, health status and home heating type distribution data to consider all the factors which are contribute to air pollution. These data can be easily added to the AQG considering the user needs and aims. The availability of all air quality data will contribute to analyze of the predictions and precautions at regional scales.
Recommended future work is related to the field of applying OGC Web Processing Standard (WPS). Applying WPS and developing web interfaces for WPS will add functionality to air quality monitoring in the field of spatial analysis and geographical data processes. Furthermore, the development of web interfaces for WPS according to the users’ air quality monitoring requirements will provide interoperability between the GIS analysis and the functions.
REFERENCES
Abdelnur, & A., Hepper, S. 2003. Java Portlet Specification, Version 1.0, Status: FCS Specification, Specification Lead: Sun Microsystems, Inc., Release: August 29.
Airnow, 2015. Airnow AQI Forecast web site, available at
“http://www.airnow.gov/index.cfm?action=airnow.local_state&stateid=16&mapcenter=0&tabs =0#tabs-0”, (23.02.2015).
AQI, 2015. Real Time Air Quality Index web site available at “http://aqicn.org/map/turkey/#@g/37.6468/38.63/6z”, (23.02.2015).
BEA, 2008. BEA WebLogic Portal, Portal Development Guide, BEA Systems, Inc.
Bealey, W.J., McDonald, E., Nemitz, R., Donovan. R., Dragosits, U., Duffy, T.R., Fowler, D., 2007. Estimating the reduction of urban PM10 concentrations by trees within an environmental information system for planners. Journal of Environmental Management 85, 44–58.
Beaujardiere, J., OpenGIS® Web Map Server Implementation Specification, Version 1.3.0, Open Geospatial Consortium Inc. 2006-03-15.
Bellander, T., Berglind, N., Gustavsson, P., Jonson, T., Nyberg, F., Pershagen, G., Jarup, L., 2001. Using geographic information systems to assess individual historical exposure to air pollution from traffic and house heating in Stockholm. Environmental Health Perspectives 109, 633-639. Biterna, M., Voutsa, D., 2005. Polychlorinated biphenyls in ambient air of NW Greece and in particulate
emissions. Environ. Int. 31, 671-677.
British Columbia, 2014. http://www.bcairquality.ca/assessment/air-modelling.html (April 21, 2014). Brunekreef, B., Holgate, S.T., 2002. Air pollution and health. Lancet 360, 1233-1242. DANE, 2006. Series de
Población 1985-2020. Available at: www.dane.gov.co (April 25, 2012).
Cinderby, S., Forrester, J., 2005. Facilitating the local governance of air pollution using GIS for participation. Applied Geography 25, 143–158.
Cooper, D.A., Peterson, K., Simpson, D., 1996. Hydrocarbon, PAH and PCB emissions from ferries: a case study in the SkagerakeKattegatteÖresund region. Atmospheric Environment. 30, 2463-2473. Cyrys, J., Hochadel, M., Gehring, U., Hoek, G., Diegmann, V., Brunekreef, B., Heinrich, J., 2005. GIS-based
estimation of exposure to particulate matter and NO2 in an urban area: stochastic versus dispersion modeling. Environmental Health Perspectives 113, 987-992.
Dalvi, M., Beig, G., Patil, U., Kaginalkar, A., Sharma, C., Mitra, A.P., 2006. A GIS based methodology for gridding of large-scale emission inventories: Application to carbon-monoxide emissions over Indian region. Atmospheric Environment 40, 2995–3007.
Douglas, W., Pope, C.A., Xu, X., Spengler, D.J., Ware, J.H., Fay, M.E., Ferris, B.G., Speizer, E.F., 1993. An Association between Air Pollution and Mortality in Six U.S. Cities. The New England Journal of Medicine. 329, 1753-1759.
Elangasinghe, M.A., Dirks, K.N., Singhal, N., Costello, S.B., Longley, I., Salmond, J.A., 2014. A simple semi-empirical technique for apportioning the impact of roadways on air quality in an urban neighbourhood. Atmospheric Environment 83, 99-108.
Elbir, T., 2004. A GIS based decision support system for estimation, visualization and analysis of air pollution for large Turkish cities. Atmospheric Environment 38, 4509-4517.
Elbir, T., Mangir, N., Kara, M., Simsir, S., Eren, T., Ozdemir, S, 2010. Development of a GIS-based decision support system for urban air quality management in the city of Istanbul. Atmospheric Environment 44, 441-454.
ESRI, 2013. GIS Portal Technology, ESRI White Paper,
http://www.esri.com/library/whitepapers/pdfs/geospatial-portal-technology.pdf, (10.05.2013). Fann, N., LAmson, A.D., Anenberg, S.C., Wesson, K., Risley, D., Hubbell, B.J., 2011. Estimating the
National Public Health Burden Associated with Exposure to Ambient PM2.5 and Ozone. Risk Analysis. 32, 81-95.
Guéguen, F., Stille, P., Millet, M., 2011. Air quality assessment by tree bark biomonitoring in urban, industrial and rural environments of the Rhine Valley: PCDD/Fs, PCBs and trace metal evidence. Chemosphere 85, 195-202.
Gkatzoflias.D., Mellios.G., Samaras.Z., 2013. Development of a web GIS application for emissions inventory spatial allocation based on open source software tools. Computers & Geosciences, 52, 21-33.
Jensen, S.S., Berkowicz, R., Hansen, H.S., Hertel, O., 2001. A Danish decision-support GIS tool for management of urban air quality and human exposures. Transportation Research Part D: Transport and Environment 6, 229-241.
Kassomenos, P., Papaloukas, C., Petrakis, M., Karakitsios, S., 2008. Assessment and prediction of short term hospital admissions: the case of Athens, Greece. Atmospheric Environment 42, 7078-7086. Kulawiak.M., A.Prospathopoulos.A., Perivoliotis.L., Luba.M., Kioroglou.S., Stepnowski.A., 2010.
Interactive visualization of marine pollution monitoring and forecasting data via a Web-based GIS. Computers & Geosciences 36, 1069-1080.
Lim, L.L., Hughes, S.J., Hellawell, E.E., 2005. Integrated decision support system for urban air quality assessment. Environmental Modelling & Software 20, 947-954.
Lin, M.D., Lin, Y.C., 2002. The application of GIS to air quality analysis in Taichung city, Taiwan, ROC. Environmental Modelling and Software 17, 11-19.
Lippmann, M., 2003. Air pollution and health e studies in the Americas and Europe. In: McGranahan, G., Murray, F. (Eds.), Air Pollution and Health in Rapidly Developing Countries. Stockholm Environment Institute, pp. 35-48.
Liu, S., Tao, S., Liu, W.X., Dou, H., Liu, Y.N., Zhao, J.Y., Little, M.G., Tian, Z., Wang, J., Wang, L., Gao, Y., 2008. Seasonal and spatial occurrence and distribution of atmospheric polycyclic aromatic hydrocarbons (PAHs) in rural and urban areas of the North Chinese Plain. Environ. Pollut. 156, 651-656.
Ma,W.L., Qi, H., Li, Y.F., Liu, L.Y., Sun, D.Z.,Wang, D.G., Zhang, Z., Tian, C.G., Shen, J.M., 2011. Seasonal and spatial variations of air concentrations of polycyclic aromatic hydrocarbons in Northeastern Chinese urban region. Bull. Environ. Contam. Toxicol. 86, 43-49.
OGC, 2004. Geospatial Portal Reference Architecture, A Community Guide to Implementing Standards-Based Geospatial Portals, Version: 0.2, OGC 04-039, OGC Discussion Paper.
Puliafito, E., Guevara, M., Puliafito, C., 2003. Characterization of urban air quality using GIS as a management system. Environmental Pollution 122, 105-117.
TEMIS, 2015. Tropospheric Emission Monitoring
Internet Service web site, available at “http://www.temis.nl/protocols/O3global.html”, (23.02.2015). Triantafyllou, A.G. Evagelopoulos, V., Zoras, S., 2006. Design of a web based information system for
ambient environmental data. Journal of Environmental Management 80, 230–236.
United Nations Environment Programme, (2015). UNEP web site available at “http://www.unep.org/urban_environment/issues/urban_air.asp”, (23.02.2015).
Vienneau, D., Hoogh, K., Briggs, D., 2009. A GIS-based method for modelling air pollution exposures across Europe. Science of the Total Environment 408, 255–266.
Westerlund, J., Urbain, J.P., Bonilla, J., 2014. Application of air quality combination forecasting to Bogota. Atmospheric Environment 89, 22-28.
Zhou, N., Cui, Z., Yang,S., Han, X., Chen,G., Zhou, Z., Zhai,C., Ma, M., Li,L., Cai,M., Li,Y., Ao,L., Shu,W., Liu,J., Cao, J., 2014. Air pollution and decreased semen quality: A comparative study of Chongqing urban and rural areas. Environmental Pollution 187, 145-152.