Selçuk J. Appl. Math. Selçuk Journal of Vol. 13. No. 1. pp. 111-123, 2012 Applied Mathematics
Mathematical Modeling of Vapor Sorption in Pyrene-Labelled Polystyrene LB Thin Film Studied by Surface Plasmon Resonance Spectroscopy
Zikriye Özbek
Balıkesir University, Faculty of Science, Department of Physics, 10100 Balıkesir,Turkiye e-mail: zikriye17@ gm ail.com
Received Date: February 1, 2012 Accepted Date: February 7, 2012
Abstract. Sorption process by surface plasmon resonance (SPR) was studied by exposing polymeric film coated with pyrene-labeled polystyrene (PS) chains to various concentrations of saturated chloroform vapor. It was observed that the reflectivity changes were fast and reversible. The changes in reflectivity implied the swelling behavior of polymeric film during adsorbtion and can be explained by capturing of chloroform molecules. Fick’s law for diffusion was used to quantify real time SPR data for the swelling proces. It was observed that diffusion coefficients (Ds) for swelling obeyed the t1/2law and found to be
correlated with the amount of chloroform content in the cell.
Key words: Langmuir-Blodgett thin films; Polystyrene; Diffusion coefficient. 2000 Mathematics Subject Classification: 35K05, 35K57, 39A05.
1. Introduction
The Langmuir Blodgett (LB) thin film fabrication technique is an excellent method in fabricating well-ordered monolayer or multilayered thin films. It is used to investigate gas sensing performances of thin films [1-3]. LB thin film deposition technique allows the fabrication of various thin films by changing the thin film fabrication conditions such as deposition dipper speed, surface pressure, dipper movement direction. Traditionally Langmuir-Blodgett (LB) balance studies has been used to study long chain polar molecules such as fatty acids and alcohols at the air/solution interface. However, in recent years there has been a resurgence of the technique to examine the adsorption and spread-ing of small particles. Originally, the emphasis was on particles in the micron size range but in more recent studies, the technique has been used to investigate much smaller sized particles. This is partly due to the expanding range of appli-cation for nanoparticles in the area of compose materials such as microelectronic
elements and optical data storage where it is important to produce 2D arrays of particulate species. Todate, several papers have been published describing LB experiments on small particulates such as polystyrene microspheres, mag-netite nanoparticles, cadmium sulphide clusters, silver nanoparticles, platinum and palladium crystallites, etc. [4-6]. Polymeric materials are often used as environmentally sensitive coatings in sensors owing to their ability to absorb a variety of different molecules. The versatility of polymers makes them consum-able in sensor types based on different transduction principles for the detection of a variety of analytes. Polymer chains are flexible, and molecules can easily be absorbed into polymer tissues. This absorbtion process results in a swelling and a mass increase of the polymer materials [7,8].
In this study polymeric film formed from pyrene-labeled polystyrene (PS) chains were dependent to various concentrations of partly saturated chloroform vapors to study swelling mechanism. Using SPR measurement system, variations in the intensity of reflected light was monitored in real time during swelling in which organic vapor is introduced into a gas cell. The organic vapor uptake reasons an increase in the transparency of polymeric film that shows the changes in reflected light intensity during swelling. Fick’s second law for diffusion [9] was deployed to determine the diffusion coefficients for the swelling process. 2. Theoretical Consideration
In most real situations the concentration profile which concentration of atoms / molecules of interest as function of position in the sample and the concentration gradient (the slope at a particular point on concentration profile) are changing with time. The changes of the concentration profile is given in this case by a differential equation, Fick’s second law. A mathematical solution using Fick’s second law of diffusion, equation (1), for calculating the diffusion coefficient, which was assumed to be independent of concentration [9]:
(1) ∂C
∂t = D ∂2C
∂x2
where, C is the concentration of diffusing substances, D is the diffusion coeffi-cient and has dimensions length2time−1and x is the space co-ordinate measured normal to the section. Fick’s second law is complex, 2nd order partial differ-ential equation. To solve it exactly requires numerical simulation. It can be solved analytically (with a mathematical equation) if assumptions are made. The assumptions are known as boundary conditions. There are many solutions to Fick’s second law depending on the specific set of boundary conditions. A standard method of obtaining a solution of a partial differential equation is to assume that the variables are sperable. Thus we may attempt to find a solution of (eq. 1) by putting
where X and T are functions of x and t respectively. Substitution in (eq. 1) yields (3) XdT dt = DT d2X dx2
which may be rewritten
(4) 1 T dT dt = D X d2X dx2
so that we have on the left-hand side an expression depending on t only, while the right-hand side depends on x only. Both sides therefore must be equal to the same constant which, for the sake of the subsequent algebra, is conveniently taken as -λ2D. We have, therefore, two ordinary differential equations
(5) 1 T dT dt = −λ 2 D and (6) 1 X d2X dx2 = −λ 2
of which solutions are
(7) T (t) = ke−λ2Dt
and
(8) X(x) = A sin λx + B cos λx
leading to a solution of (1) of the form
(9) C(x, t) = (A sin λx + B cos λx)e−λ2Dt
where A and B are constants of integration. Since (eq. 1) is a linear equation, the most general solution is obtained by summing solutions of type (eq. 9), we that we have (10) C(x, t) = ∞ X m=1 h
(Amsin λmx + Bmcos λmx)e−λ
2Dti
where Am, Bm, λm are determined by the initial and boundary conditions
for any particular problem. Thus if we are interested in diffusion out of a plane sheet of thickness d, through which the diffusing substance is initially uniformly distributed and the surfaces of which are kept at zero concentration, the conditions are
(12) C(0, t) = 0C(l, t) = 0 The boundary conditions (eq. 12) demand that
(13) Bm= 0, λm=
mπ
d (m : 1, 2, ...) and hence the initial condition (eq. 11) becomes
(14) C(x, t) = ∞ X m=1 Amsin mπx d = C0
By multiplying both sides of (eq. 14) by sin (pπx/d ) and integrating from 0 to d using the relationships
(15) Z d 0 sinmπx d sin pπx d dx = ½ d 2, (m = p) 0, (m 6= p) ¾
we find that terms for which m is even vanish, and Am=4Cπ0.
The final solution is therefore
(16) C =4C0 π ∞ X n=0 1 2n + 1e −(2n+1)2 π2 Dtd2 sin(2n + 1)πx d
where 2n+1 has been substituted for m for convenience so that n takes values 0,1,2,. . . .
Many mathematical models used to describe diffusion assume steady state con-ditions. Steady state conditions assume that diffusant concentrations remain constant at all points on each side or surface of a plastic sheet or membrane. If problem is examine through steady state in -d < x < d range, at this stage;
(17) Cs(x, t) = C0, t ≥ 0
(18) C ( −d, t) = C (d, t) = C1
to change the initial (eq. 17) and boundary conditions (eq. 18), we are examined under these conditions is also a solution
(19) C = C1+ 4(C0− C1) π ∞ X n=0 (−1)n (2n + 1)cos (2n + 1) πx 2d e −(2n+1)2 π2 4d2 Dt
to obtain. This is the case of sorption by a membrane. If the region —d < x < d is initially at uniform concentration C0, and the surfaces are kept a constant
concentration C1, the solution (eq. 19) becomes
(20) C − C0 C1− C0 = 1 − 4 π ∞ X n=0 (−1)n (2n + 1)cos (2n + 1) πx 2d e −(2n+1)2 π2 4d2 Dt
We can replace the concentration terms directly with the amount of diffusant by using: (21) M = Z V CdV
When equation (eq. 20) is considered for a plane volume element and substituted in equation (eq. 21), the following solution is obtained.
(22) Mt M∞ = 1 − 8 π2 ∞ X n=0 1 (2n + 1)2exp(− (2n + 1)2Dπ2 d2 0 t)
where Mtand M?represent the amount of diffusant entering the plane sheet at
time t and infinity, respectively. If error functions are use in the (eq. 22), this equation can be reduced to a simplified form.
(23) Mt M∞ = 1 − 4 π ∞ X n=0 1 (2n + 1)erf c(z) r Dt πd2
using the asymptotic expansion for erfc in (eq. 23) and hence to write
(24) Mt M∞ = 4 π1/2 µ Dt d2 ¶1/2 −Dtd2 − 1 3π1/2 µ Dt d2 ¶3/2 + ... The corresponding useful for small times are
(25) Mt M∞ = 4 s D πd2 0 t1/2
which is called early-time equation and this square root relation can be used to interpret for the swelling data.
3. Experimental Details
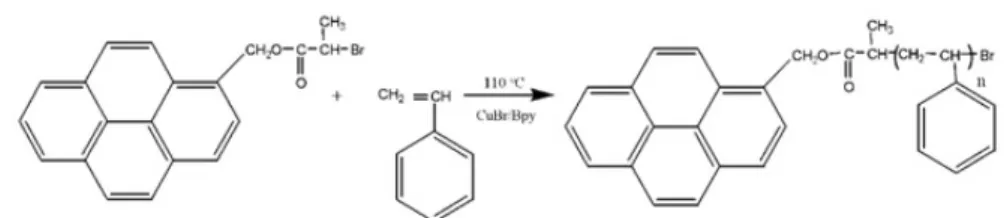
PS with different molecular weights were synthesized by using a pyrene func-tional Atom Transfer Radical Polymerization (ATRP) initiator in the polymer-ization of styrene which was polymerized in bulk at 1100C using
1-Pyrenylmethyl-2-romopropanoate (PMBP) and CuBr/Bpy as the catalyst (Scheme 1). Details and characterization of polymer chains are given in the literature [10].
Computer-controlled NIMA 622 LB trough with an area of 1200 cm2was used to
investigate the monolayer at the air-water interface and the LB film transfer onto the gold coated substrate. Solution of PS in chloroform with a concentration of ∼0.2 mg ml−1 was spread onto ultra pure water subphase to investigate the behavior of PS molecule at air-water interface by taking π-A isotherm graph. The pH value of the subphase is nominally maintained at 6. A time period of 15-20 minutes was allowed for the solvent to evaporate before the area enclosed
by the barriers was reduced. Otherwise, the temperature of the water subphase was controlled using Lauda Ecoline RE 204 model temperature control unit and all experimental data were taken at room temperature.
After taking the π-A isotherm graphs, the floating monolayer at the water sur-face was found to be stable at the sursur-face pressure of 16 mN m−1 for a period
of 15 minutes and this surface pressure value is selected for LB film deposition on coated-gold glass substrates for SPR measurements. The deposition mode for LB film was of the X-type and vertical dipping procedure was performed at the selected surface pressure with a speed of 25 mm min−1 for both the down and up strokes. LB film samples were left to dry after each up stroke. Differ-ent numbers of monolayer were deposited on these substrates under the same surface pressure.
4. Results and Discussion 4.1 Isotherm and Transfer Ratio
The surface pressure versus surface area (π-A graph) is an important graph to understand the characteristic surface behavior of a floating monolayer on the water surface. The area per molecule for a floating monolayer can be calculated using this following relation:
(26) am =
µ A Mω
c NAV
where A is the area of the water surface enclosed by the trough barriers, Mωis
the molecular weight, c is the concentration of the spreading solution, NA is
the Avagadro’s number and V is the volume of solution spread over the water surface. π-A graph obtained from the floating monolayer on the water subphase is given in Fig. 1. The surface pressure starts rising at an area around 3 nm2
until the surface pressure reaches to16 mN m−1. The limiting area per
mole-cule obtained by extrapolating the slope of low compressibility to zero pressure indicates 0.25 nm2.
π-A isotherm measurements were repeated several times using identical and differing volumes of the solution and the results demonstrated good stability and reproducibility of the monolayers at the water surface. The floating monolayer at water surface was found to be stable at a surface pressure of 16 mN m−1that
was selected for LB film deposition procedure. Isotherms of polymer materials with different substituted groups were extensively studied in the literature [11-12]. Our result shows a similar isotherm graph at the air—water interface. A stable LB monolayeris obtained at a pressure of 10-20 mN m−1.
The transfer ratio (τ ) for an LB deposition is also an important parameter to monitor the deposition process and it is defined as the ratio of the area of the LB film removed from the water surface to the area of the substrate moved through the air-monolayer-water surface.
(27) τ = AL AS
where AL is the decrease in the area occupied by the monolayer on the water
surface and AS is the coated area of the substrate. The τ was calculated between
0.90 and 1.00 for X-type LB film. Our results can be concluded that stable and reproducible monolayers of PS were formed on the water surface and that a uniform LB deposition successfully fabricated onto solid substrates.
4.2 Sensing Properties of PS LB Film
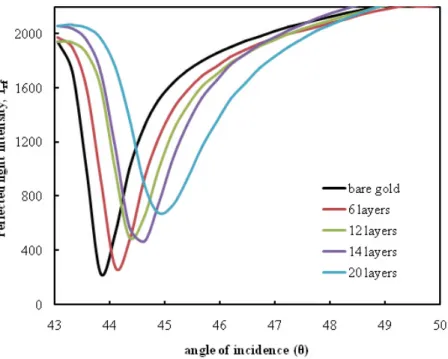
To more draw information into the deposition properties of the multilayer as-semblies, surface plasmon reflectivity scans were taken from PS LB thin films of different thicknesses. SPR measurements were made on the LB films deposited onto gold-coated glass substrates at surface pressure of 16 mN m−1. The LB monolayers were transferred uniformly onto gold-coated glass substrate with X-type deposition. Fig. 2 shows a set of typical SPR curves showing the variations in reflected intensity as a function of incidence angle for LB films. The SPR curve for the bare gold film is also included for reference. The SPR curves of the overlayer containing the LB films become broader and the minimum reflected intensity rises to a higher value as the number of LB layers is progressively increased. Similar SPR curve changes have been observed for novel calixarene LB films [13]. The peak shifts (θ) seen in the angular scans of the plasmon resonance curves of the LB film multilayer assemblies relative to bare gold, in-creased linearly with the number of layers. The multilayer thickness was found to be linearly related to the number of layers deposited, as seen by the linear increase in shift of SPR angles with the number of layers shown in the inset of Fig. 3.
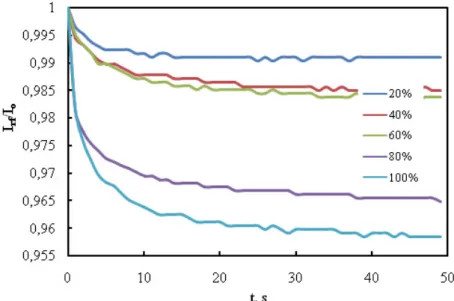
Fig. 4 displays the kinetic measurement where reflected light intensity has been plotted as a function of time when PS LB thin film was exposed to different contents of saturated chloroform vapor in air for 5 min followed by injection of clean air for another 5 min. The response against chloroform vapor is very fast, reversible and reproducible. The response is quickly increased for the few seconds after injection of chloroform vapor and then aptitudes to decrease exponentially. PS LB thin film shows a long term reproducible response to chloroform vapor. In order to quantify the data given in Fig. 5, one has to take the polymer film parameters due to swelling. Fig. 5 represents the normalized intensity of reflected light against swelling time where the consolidation process involves setting starting times to t = 0 for each swelling cycles. As seen in Fig. 5, the reflected light intensity, Irf decreased as the time of vapor exposure
is increased. It is also seen that changes in Irf against the time of vapor
exposure decreased very fast as the chloroform percentage concentration injected into the gas cell is increased. These behaviors can be declared with the chain interdiffusion between polymer chains during vapor exposure. As the saturated chloroform vapors penetrate into polymeric film, the polymer chains interdiffuse and transparency of the polymeric film increases, which results in the decrease
of intensity of light reflected from the polymeric film. These results can be related to the amounts of diffusant entering the polymeric film Mt; that is, Irf
should be inversely proportional to Mt[14]. Equation (25) now can be written
as (28) µ Mt M∞ ¶ ∼ µ I rf (t) Irf (∞) ¶−1 = 4 s D πd2 0 t1/2
where Irf (t)and Irf (∞)are intensities of reflected light at any time, t and
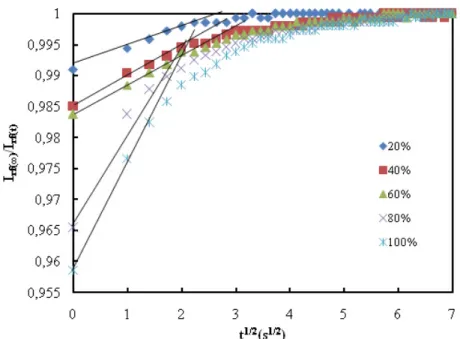
satu-ration point in Irf, respectively. The normalized Irf intensities [Irf (∞)/Irf (t)]
are plotted in Fig. 6 for the square root of swelling time according to eq. (28). The slopes of the linear relations in Fig. 6 produce the diffusion coefficients, Ds
for the swelling of polymeric film and those values are plotted in Fig. 7 versus saturated chloroform vapor content. It can be seen that diffusion coefficients, Ds is increased as the vapor content increased in the cell. In another words, a
decrease in the vapor content prevents the film from swelling and the diffusion of chloroform molecules into polymeric film slows down.
5. Conclusion
PS is successfully deposited onto glass and quartz crystal substrates by Langmuir-Blodgett thin film deposition technique. A value of the area per molecule is found to be 2.25 nm2 using isotherm graph taken at the water surface and this
floating monolayer is successfully deposited onto the solid substrates with a high transfer ratio between 0.90- 1.00. This material gives a large response to chlo-roform and isopropyl alcohol vapors than other vapors. The responses in terms of frequency change to the exposure of chloroform and isopropyl alcohol vapors are fast, large and reversible.
In conclusion, we introduced a model to utilize the sorption behavior of PS LB thin film under exposure to different saturated chloroform vapor content in dry air. It is understood that the penetration of organic vapor molecules into the polymeric film is fast and the interdiffusion of polymer chains increases as the organic vapor content in air increases. This behavior can be interpreted in terms of the solubility parameter, δ of swelling agent and polymeric film. A decrease of saturated chloroform vapor content in the cell prevents the polymeric film from swelling since organic solvent chloroform and PS both have the same solubility parameter (δ = 19 MPa1/2) [15]. In another words, by increasing organic vapor
content in the cell, swelling agent becomes a good solvent for the PS film. As a result, polymer-solvent interaction plays a dominant role during swelling processes. The PS LB film may find potential applications in the development of room temperature vapor sensors for chloroform vapor. Therefore, gas sensors based on PS are very promising for environmental and industrial applications.
References
1. Xiang, H., Tanaka, K. and Kajiyama, T., “Gas-sensing properties of dilithium octacyanophthalocyanine Langmuir-Blodgett films”, Langmuir, 18, 9102, (2002). 2. Valli, L., “Phthalocyanine-based Langmuir—Blodgett films as chemical sensors”, Adv. Colloid Interfac., 116, 13-44, (2005).
3. Capan, R., Ozbek, Z., Goktas, H., Sen, S., Ince, F., Ozel, M.E., et al., “Character-ization of Langmuir-Blodgett films of a calix[8]arene and sensing properties towards volatile organic vapors”, Sensors and Actuators B, 148, 358-365, (2010).
4. Si, P., Mortensen, J., Komolov, A., Denborg, J. and Møller, P. J., “Polymer coated quartz crystal microbalance sensors for detection of volatile organic compounds in gas mixtures”, Analytica Chimica Acta, 597, 223—230, (2007).
5. Lee, J.C. and Lee, D. W., “Flexible and tactile sensor based on a photosensitive polymer”, Microelectronic Engineering, 87, 1400—1403, (2010).
6. Chang, C.C., Pai, C.L., Chen, W.C. and Jenekhe, S.A., “Spin coating of conjugated polymers for electronic and optoelectronic applications”, Thin Solid Films, 479, 254— 260, (2005).
7. Ha, S.C., Yang, Y., Kim, Y. S., Kim, S. H., Young Jun Kim, Y.J. and Cho, S. M., “Environmental temperature-independent gas sensor array based on polymer composite”, Sensors and Actuators B, 108, 258—264, (2005).
8. Giordano, M., Russo, M., Cusano, A., Mensitieri, G. and Guerra, G., “Syndiotactic polystyrene thin film as sensitive layer for an optoelectronic chemical sensing device”, Sensors and Actuators B, 109, 177—184, (2005).
9. Crank, J., The Mathematics of Diffusion, Second ed., Clarendon Press, Oxford, (1975).
10. Erdogan, M., Hepuzer, Y., Cianga, I., Yagcı, Y. and Pekcan, O., “Diffusion of Pyrene End-Capped Polystyrene Prepared via Atom Transfer Radical Polymerization into Polystyrene Gels in the Presence of Toluene”, J. Phys. Chem. A, 107, 8363-8370, (2003).
11. Ogi, T., Ohkita, H., Ito, S. and Yamamoto, M., “Preparation of porphyrin mono-and multi-layer films based on the polymer Langmuir—Blodgett method”, Synthetic Metals, 84, 195-196, (1997).
12. Li, S., Clarke, C.J., Eisenberg, A. and Lennox, R.B., “Langmuir films of polystyrene-b-poly(alkyl acrylate) diblock copolymers”, Thin Solid Films, 354, 136-141, (1999). 13. Ozbek, Z., Capan, R., Goktas, H., Sen, S., Ince, F.G., Ozel, M.E., et al., “Optical parameters of calix[4]arene films and their response to volatile organic vapors”, Sensors and Actuators B, 158, 235— 240, (2011).
14. Erdogan, M., Capan, I. Tarimci, C. and Hassan, A.K., “Modeling of vapor sorption in polymeric film studied by surface plasmon resonance spectroscopy”, Journal of Colloid and Interface Science, 323, 235—241, (2008).
15. Erdogan, M., Ozbek, Z., Capan, R. and Yagci, Y., “Characterization of Polymeric LB Thin Films for Sensor Applications”, Journal of Applied Polymer Science, 123, 2414—2422 (2012).
Figures
Scheme1. Synthesis of pyrene labelled polystyrene by Atom Transfer Radical Polymerization
Figure 2. SPR curves of PS LB films with increase in thickness
Figure 4. The variation of intensity of reflected light as afunction of time when the PS LB film is exposed to various concentrations of saturated chloroform vapor
Figure 6. Plot of reflected light intensity versus the square root of swelling time, t1/2 s. Solid lines represent the fit of the data to eq.(28)
Figure 7. The dependence of the swelling diffusion coefficients, Ds versus saturated chloroform vapor content