EXAMINATION OF THE RELATIONSHIP BETWEEN ATTITUDE AND
PERCEIVED USABILITY OF SOFTWARE IN A CONTEXT-DRIVEN
SPECIFIC SCENARIO
ALP YÖRÜK
M.B.A., Business Administration, Işık University 2002 B.S., Mechanical Engineering, Istanbul Technical University, 1999
Submitted to the Graduate School of Social Sciences in partial fulfillment of the requirements for the degree of
Doctor of Philosophy in
Contemporary Management Studies
EXAMINATION OF THE RELATIONSHIP BETWEEN ATTITUDE AND PERCEIVED USABILITY OF SOFTWARE IN A CONTEXT-DRIVEN SPECIFIC
SCENARIO
Abstract
Literature regarding human and computer interaction is enormous in size. Since computers have started to play an important role in our everyday life, researchers have focused on improving the interaction between these two entities. The usability of computer & software systems has been the main area of interest. Various techniques have been developed to measure usability. Some researchers have focused on objective usability whereas some have focused on the psychological aspect by examining subjective usability. When the objective is to examine a potential set of users’ perceived usability, the context dependent nature of this specific literature even added to the difficulties. This research supplies an in-depth view of usability and computer attitude literatures, and offers computer attitude as an important variable which impacts perceived usability. A field study has been conducted in a population of 26 universities’ students in Istanbul to test the model. The research findings indicate that computer attitude is an important variable that does have a significant effect on perceived usability.
KULLANICININ BĠLGĠSAYAR TUTUMU ĠLE ALGILANAN KULLANICI DOSTLUĞU ARASINDAKĠ ĠLĠġKĠNĠN SPESĠFĠK BĠR SENARYO
ÜZERĠNDEN ĠNCELENMESĠ
Özet
Ġnsan ve bilgisayar arasındaki etkileĢimi inceleyen literature oldukça geniĢtir. Bilgisayarların günlük hayatımız içerisinde önemli bir rol oynamaya baĢladığı andan beri, araĢtırmacılar bu iki varlık arasındaki etkileĢimi iyileĢtirme konusunda çalıĢmalara odaklanmıĢlardır. Bilgisayar & yazılım sistemlerinin kullanıcı dostluğu bu çalıĢmalara konu olmuĢ önemli odak noktalarından biridir. Kullanıcı dostluğu, gerek objektif, gerekse, subjektif; psikolojik boyutu ile incelenebilir. Amacın potansiyel bir kullanıcı kitlesinin algıladığı kullanıcı dostluğunun incelenmesi olduğu durumlarda, bu literatürün spesifik durumlar bazındaki doğası iĢin zorluk seviyesini de arttırır. Bu araĢtırma, kullanıcı dostluğu ve bilgisayar tutumu literatürlerinde geniĢ bir taramayı içermekte ve bilgisayar tutumunu, algılanan kullanıcı dostluğunu etkileyen önemli bir değiĢken olarak önermektedir. Ġstanbul’daki 26 üniversiteyi kapsayan ana kütleyi temel alan bir saha çalıĢması ile önerilen model test edilmiĢtir. AraĢtırma bulguları; bilgisayar tutumunun algılanan kullanıcı dostluğu üzerinde anlamlı bir etkisi olduğuna iĢaret etmektedir.
Acknowledgements
There are many people I would like to thank for their precious value and support throughout this entire journey. First of all, I thank Murat Ferman, my professor and dissertation supervisor. He has inspired me throughout this thesis both intellectually and motivationally. Without his precious support it would not have been possible to complete this work.
Many thanks to Metin Çakıcı, my professor in Master of Business Administration program. He has shared his expertise on marketing research and statistics and paved the way for me to materialize research model.
I would also like to thank to Emrah Cengiz, my professor in MBA program. He has supplied his objective and valuable views on the subject and made it possible to refine my approach to the research.
Above all, most valuable and precious, my mother, Nilgün Sarıcan… I owe everything, my entire being, my whole life to this wonderful lady. She has been there when there was nobody. She always has been an inspiration for anybody who has been around her.
Table of Contents
Abstract ii
Özet iii
Acknowledgements iv
Table of Contents v List of Figures viii List of Tables x 1 Introduction 1
2 Literature Review 5
2.1 Literature Review Regarding Usability……….. 5
2.1.1 Introduction to Usability / What is Usability? ……… 5
2.1.2 Different Definitions of the Concept Usability………... 7
2.1.2.1 Schakel’s Definition of Usability……….... 9
2.1.2.2 Nielsen’s Definition of Usability……….... 10
2.1.2.3 ISO 9126’s Definition of Usability………... 12
2.1.2.4 ISO 9241’s Definition of Usability…………... 16
2.1.3 How Different Definitions Overlap Each Other? ... 20
2.1.4 Measuring Usability………... 22
2.1.4.1 Usability Testing……….. 23
2.1.4.2 Usability Inspection………. 24
2.1.4.3 Usability Inquiry……….. 24
2.1.4.3.1 QUIS: Questionnaire for User Interface Satisfaction (Chin, 1988)……….. 29
2.1.4.3.2 PEUE: Perceived Usefulness and Ease of Use (Davis 1989)……… 33
2.1.4.3.4 NAU: Nielsen’s Attributes of Usability
(Nielsen, 1993a)………... 40
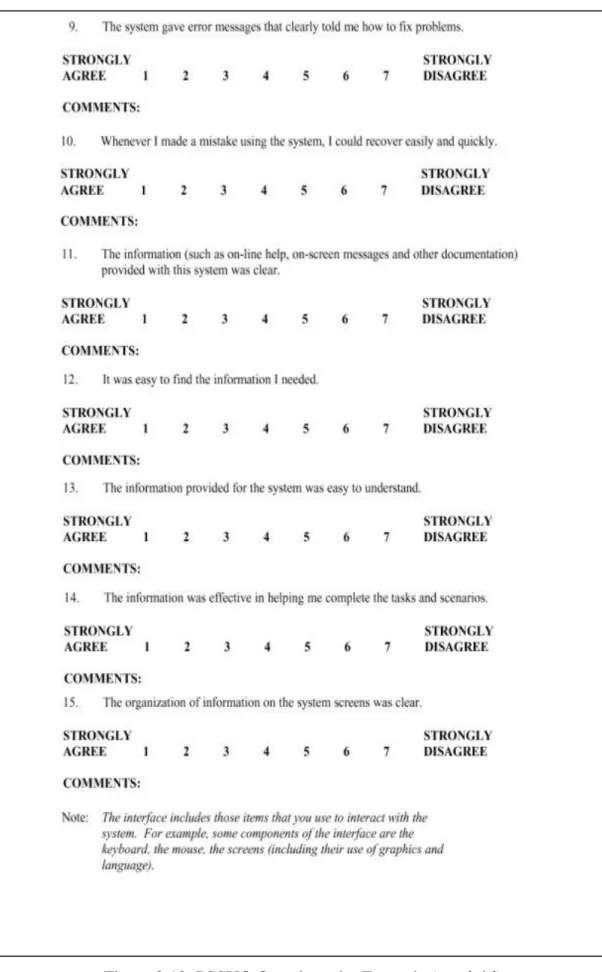
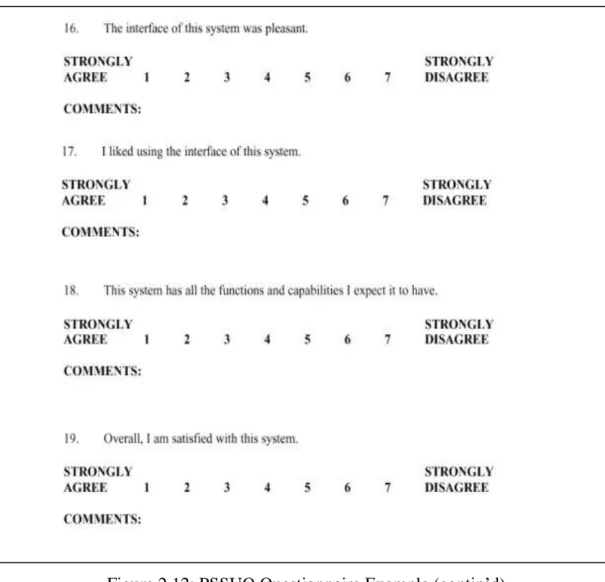
2.1.4.3.5 PSSUQ: Post-Study System Usability Questionnaire (Lewis 1992a)……….. 43
2.1.4.3.6 CSSUQ: Computer System Usability Questionnaire (Lewis 1992b)……….. 47
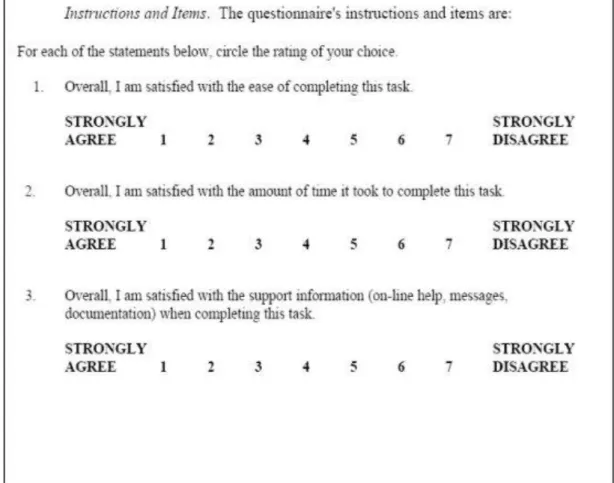
2.1.4.3.7 ASQ: After Scenario Questionnaire (Lewis 1995)……… 49
2.1.4.3.8 SUMI: Software Usability Measurement Inventory (HFRG)………... 50
2.1.4.3.9 MUMMS: Measurement of Usability of Multimedia Software (HFRG)………. 56
2.1.4.3.10 WAMMI: Website Analysis and Measurement Inventory……….... 57
2.1.4.3.11 EUCSI: End User Satisfaction Instrument (Doll, 1994)……….. 59
2.2 Literature Review Regarding Computer Attitude………. 60
2.2.1 Introduction to Computer Attitude ……… 60
2.2.2 Variables that Has Been Studied Regarding Computer Attitude……… ……… 64
2.2.2.1 Computer Experience……… 64
2.2.2.2 Computer Self-Efficacy……… 68
2.2.2.3 Computer Anxiety……… 70
2.2.2.4 Gender……….. 70
2.2.3 Measuring Computer Attitude……… 72
2.2.3.1 Loyd and Gressard (1984) Computer Attitude Measurement Scale……….. 72
2.2.3.2 Kay (1989) CAM Computer Attitude Measurement Scale………. 73
3.3 Research Design……….79
3.3.1 Research Objective………. 79
3.3.2 Research Scenario: Shopping in an Ecommerce Portal…….. 80
3.3.3 Basic Research Design Issues………... 87
3.3.4 Sampling………... 88
3.3.5 Data Collection Method………... 91
3.4 Research Results……… 94
3.4.1 Internal Consistency……… 95
3.4.2 Descriptive Statistics ………... 95
3.4.2.1 Frequency Distributions……… 95
3.4.2.2 Measures of Central Tendencies and Dispersion…. 103 3.4.2.3 Kolmogorov-Smirnoff Tests……… 104 3.4.3 Inferential Statistics………. 106 3.4.3.1 Pearson Correlation……….. 106 3.4.3.2 Hypothesis Testing……….. 108 3.4.3.2.1 Hypothesis 1……… 108 3.4.3.2.2 Hypothesis 2……… 110 3.4.3.2.3 Hypothesis 3……… 112 3.4.3.2.4 Hypothesis 4……… 114 3.4.3.2.5 Hypothesis 5……… 116 3.4.3.2.6 Hypothesis 6……… 118 3.4.3.2.7 Hypothesis 7……… 120 3.4.3.2.8 Hypothesis 8……… 122 3.4.3.2.9 Hypothesis 9……… 124
3.4.4 Evaluation of Research Results……… 127
3.4.5 Implications for Further Research……… 128
4 Conclusion 130
References 132
List of Figures
Figure 2.1 Schakel’s Product Acceptance Definition & Dimensions………... 10
Figure 2.2 Nielsen’s Product Acceptability Definition & Dimensions………. 10
Figure 2.3 ISO 9126-1 Software Quality Model………... 13
Figure 2.4 ISO 9241-11 Usability Model……….. 17
Figure 2.5 Joined Display of ISO 9241-11 and ISO 9126-1 Models………… 18
Figure 2.6 Overview of Usability Definitions………20
Figure 2.7 A QUIS Questionnaire Example………...33
Figure 2.8 Technology Acceptance Model of Davis ……… 34
Figure 2.9 A TAM Questionnaire………. 36
Figure 2.10 Nielsen’s Heuristic Evaluation Questionnaire………. 39
Figure 2.11 Nielsen’s Attributes of Usability Questionnaire……….. 41
Figure 2.12 PSSUQ Questionnaire Example ……….. 45
Figure 2.13 ASQ Questionnaire Example………... 50
Figure 2.14 SUMI Questionnaire Example……… 54
Figure 2.15 Graph of WAMMI Results……….. 58
Figure 2.16 End User Satisfaction Model by Doll……….. 59
Figure 2.17 General Representation of the Literature Review for Computer Attitude and Its Dimensions……… 63
Figure 2.18 An Example of a Questionnaire Which Measures Computer Experience……….. 66
Figure 2.19 Items of Computer Attitude Measurement Scale……… 73
Figure 3.1 Theoretical Framework for a Context Specific Usability Study….. 74
Figure 3.2 Scenario Portal’s Home Page; www.paketticaret.com………... 81
Figure 3.3 Scenario Portal’s Product Category Page for Cellular Phones; www.paketticaret.com... 82
Figure 3.4 Scenario Portal’s Product Comparison Page for Cellular Phones;
www.paketticaret.com... 83
Figure 3.5 Scenario Portal’s Product Page for the Selected Phone; www.paketticaret.com... 84
Figure 3.6 Scenario Portal’s New Membership Registration Page; www.paketticaret.com... 85
Figure 3.7 Scenario Portal’s Checkout Page Which Display the Shopping Basket; www.paketticaret.com... 86
Figure 3.8 Frequency Distribution for Gender……….. 96
Figure 3.9 Frequency Distribution for Departments………. 97
Figure 3.10 Frequency Distribution for Functionality……… 98
Figure 3.11 Frequency Distribution for Efficiency………. 99
Figure 3.12 Frequency Distribution for Interface Usability……… 100
Figure 3.13 Frequency Distribution for Computer Attitude……… 101
Figure 3.14 Frequency Distribution for Usability………... 102
Figure 3.15 Goodness of Fit Test for Functionality……… 104
Figure 3.16 Goodness of Fit Test for Efficiency………. 104
Figure 3.17 Goodness of Fit Test for Interface Usability………...…. 105
Figure 3.18 Goodness of Fit Test for Computer Attitude………...…… 105
List of Tables
Table 2.1 Mean of Ratings Table from a QUIS Analyses………... 30
Table 2.2 Mean of Ratings Table from a QUIS Analyses (2)………….…… 32
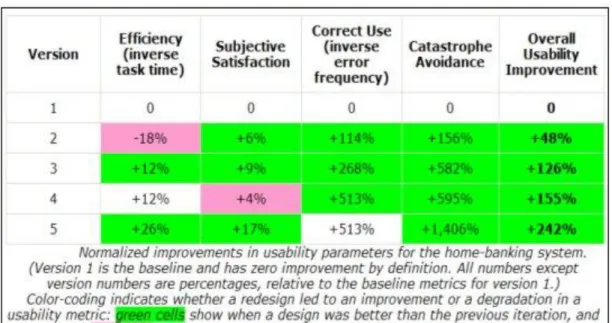
Table 2.3 Improvements in Usability Parameters Measured via Nielsen’s Attributes of Usability for a Home Banking System ………. 42
Table 2.4 Descriptive Statistics for Computer Self-Efficacy and Computer Performance from a Sample Questionnaire……… 69
Table 3.1 Elements of Research Design………. 88
Table 3.2 Sample Distribution amongst Universities within the Population.. 90
Table 3.3 Computed Cronbach’s Alpha for Research Variables……… 95
Table 3.4 Research Variables Descriptive Statistics………... 103
Table 3.5 Pearson Correlation Matrix for Research Variables….………….. 107
Table 3.6 T-Test Output for Hypothesis 1………... 109
Table 3.7 T-Test Output for Hypothesis 2………... 111
Table 3.8 T-Test Output for Hypothesis 3………... 113
Table 3.9 T-Test Output for Hypothesis 4………... 115
Table 3.10 T-Test Output for Hypothesis 5………... 117
Table 3.11 T-Test Output for Hypothesis 6………... 119
Table 3.12 T-Test Output for Hypothesis 7………... 121
Table 3.13 T-Test Output for Hypothesis 8………... 123
Table 3.14 Regression Output for Hypothesis 9……… 125
Chapter 1
Introduction
Literature regarding computers is enormous in size. Since man has discovered this machine which is capable of making computations in an ever increasing performance level, computers and human interaction has been an area of interest. It has been researched by both technical and non-technical disciplines. Computer engineers, IT professionals, MIS graduates, psychologists, management gurus all have published numerous books and articles regarding this machine-to-man interaction. It has been a huge step for man to include computer in his every day activities. This machine which is composed of several electronic equipments has been a tool which was a high-performance calculator first and then throughout its life stage evolved its existence into even a decision making tool! When computers became every day tools of not only a couple of laboratories but of businesses and home users, the quality of interaction between these two entities became a great area of research. Since then man‟s ability to use this tool to full potential and being able to improve both objective performance and subjective perception of quality in use has been the main topic.
Usability of systems (both hardware and software) was and is a great area of research. Everyday companies throughout the globe are investing significant amounts of their resources to improve their products so that customers can find them more satisfactory. This matter is that much important that although a product can be
companies, offering these specific services are trying their best to identify points of improvements which will make it possible for them to improve the end-users perceptions about their products & services.
Usability literature regarding computers has been thoroughly studied starting from the 1980s. Still today usability for a system is a literature which is of great debates. Even on a definition basis, there are several highly acclaimed definitions by respectable authors but still no consensus. It is the very nature of usability that makes it so difficult to come up with a single definition of the concept. The context* dependence of the concept adds to the difficulties to overcome these debates. Even usability and its meaning by different categories of users who are interacting with the very same system can be completely different. Such as an end-user is much more oriented with the interface-quality aspect where as a technical admin, who is responsible for daily maintenance of system equipment, is much more oriented with the ease of maintainability of the system.
When one is to focus on attitudes towards computers, the whole idea and its interpretation becomes even more complex. Attitudes can greatly affect one‟s behaviors towards an object. When this object is a machine which tries to “interfere” with your every day routine and way of life, the issue becomes even more important. Therefore computer attitude sometimes becomes as the main barrier which acts as the main supplement to resistance to change, both for home and also for business users.
This thesis mainly focuses on the relation between computer attitude and usability. Our objective is to explore both of these concepts and their related literature. However defining usability and creating a scenario which makes it possible to analyze this important relationship is a great challenge which also promises important findings. If the literature review makes it possible to analyze this
relationship, one then can become curious to attitude and its impact upon perceived usability (subjective usability).
The author is a professional within the IT software industry. His main responsibilities are system analysis & design. He also develops applications with in a development team for gaining further knowledge regarding coding which makes it possible for him to improve his perception of developers and their tasks. By this way, he can design systems which are more positively welcomed by developers working in the project. His experience is on web-based solutions.
The teams that have worked with the author has developed several acclaimed web-based solutions including CRM systems, Business Flow Management systems, Document Management systems, Internet Sites, E-Commerce sites and etc,. Amongst their client lists, Turkey‟s top associations and companies are existent such as Vestel, ODD (Turkish Automotive Distributors Association) (imported automobiles are making up 70% of the market with ODD being the most important association), HES Cable (World‟s #3 cable manufacturer), Roman (One of the most famous woman-dress designer and chain stores owner in Turkey), Remax-Turkey, GEM (Global Equity Management, a Switzerland based equity management company that has big investments in pharmaceutical industry), DDF (One of the most famous advertising agency in Turkey), Fire of Anatolia (“Anadolu Ateşi”, world wide known Turkish dance group) and several other companies.
Throughout all 100 projects the author has participated within the last 10 years of his professional experience, he has observed several different companies with several different organizational contexts (organization structure, business flows, employees and etc.). One of the most important aspect, he has recognized has been the resistance to change by some certain types of system users towards a new system.
became even more negative after first trials whereas in some cases the attitude became more positive. In some very strange situations these users, who prior to using the system had negative attitudes, refused the opportunity of interacting with the system as much as possible.
Concluding, the author planned examining the above mentioned users‟ attitude and their perception of usability on a scientific platform. Is attitude affecting the perceived level of usability of a system? Do users with negative attitude towards computers perceive lower levels of usability? The answers to these questions will supply great information and will be of great use. If attitude and usability is somehow related then the professionals within the industry, prior to marketing and then developing a system, can analyze the customers‟ potential system users in regard to their computer attitudes. Found information can be shared with top-level managers of the potential customers and if the potential users of interest are found to have negative computer attitudes then the IT Company can be cautious. The IT Company can warn top-level managers that in the existence of users with negative computer attitudes, the perceived level of usability of a system can be lower. The company therefore can choose to come up with objective performance measures which will be selected as the success criteria for evaluation of the final system. An alternative can be to develop a program which will improve attitudes of these users who have negative attitudes towards computers so that when the real system is deployed perceived usability will be higher.
Chapter 2
Literature Review
2.1 Literature Review Regarding Usability
In this part of the thesis, an in-depth examination of different definitions and approaches to the concept of usability is supplied. A brief comparison of these various definitions is also existent. In the following sub sections of the literature review of usability, different techniques developed for measuring the concept is also analyzed with an in-depth examination of questionnaires that have been developed during the last 20 years.
2.1.1 Introduction to Usability / What is Usability?
Usability is an important goal to achieve in all aspects of product design. It is one of the most important criteria of the process. We have heard the following statement, in a variety of products by several different users, numerous times in our lives; “It is really difficult to use this product…” There are products in the market today even with their market launch they are a hit in a single day and there are some products does not matter how much their manufacturers invest upon promoting it is still not welcomed by potential customers. An example of the prior is Apple‟s iPod which became a market leader in less than a year all around the globe. Its success was in its design in the form of both elegance and even to a more important level, the ease to use the product by customers. Being able to operate almost any functionality with its
user is able to operate a significant percentage of the available functionality of the product in a couple of minutes. The physical usability characteristics of the product is subjectively perceived as easily usable by the customer and results in a highly welcoming, positive attitude towards the product. An example of the latter is Linux operating system (an operating system for PCs) which is in some cases freely available or available at a price which is significantly lower than its competitor, Microsoft Windows. Due to the reason that almost all pc users are acquainted with Microsoft Windows operating systems for a much longer period and perceived it as the reference when it comes to the ease of use, the Linux, with its less user friendly operability is perceived in the market as a product which “Technical People” use but not suitable for regular users. Does not matter whether truly the Windows is more user-friendly, still the perception of “User friendliness” of the product translates directly into a share which almost rules the entire market and is a norm. Concluding usability is a criterion which directly impacts a product‟s / service‟s success.
Can we come up with a universally accepted set of attributes / dimensions which constitute the concept of usability? One can quite easily answer this question by examining a couple of different scenarios, which are context dependent upon users. As a first one let‟s take into account a hardware technical service provider in a software system. For the technical operators of the service provider a more usable, and preferred system is one which is easy to maintain, does not produce errors quite frequently, and it is easy to backup and restore the whole system from a previous functioning backup. This view of the technical operators does take into account their expectancies. A highly usable system for them is one which does not make them work for more hours to satisfy their daily routine jobs. Let‟s switch to another users‟ view that are interacting with the very same system as bank operators who are maintaining customer accounts on this very system. For them this system is usable if it is easy to find customer accounts within the database, if it is easy to examine past interactions with the bank, if it is easy to create new customers with not that much of effort and if help in the case of a failure is available with ease and etc. As can be seen when switched to a different user, the perception of “Usability” completely differs.
project which will satisfy the board of directors and in return announced to the shareholders as an important threshold in improving the performance of the bank and thus will boost the shares in the market. For him a highly usable system is one which is the cheapest that satisfies the expected set of functionalities (initial investment is low, and projected return is high, a better IOR), which is the cheapest in maintenance (variable costs) and it should be possible the custom develop new functionalities on to the software package with the internal IT department (internal code quality, documentation, modularity and other technical product properties are of importance, etc,.). Mark and his view of a highly usable system brought cost into the picture as a criterion of consideration. This was not a criterion of decision for the bank operators nor was it for the technical operators. The software interface and its abilities were not important for the technical operators nor was it for the top-level manager, Mark Dickinson but maybe the most important criterion for bank operators who are maintaining customer accounts. Concluding, the concept of usability and its dimensions differ up to a very significant degree depending upon different scenarios which is to be analyzed in-depth in the following pages.
When we focus in to the computers and software, usability is a topic which is highly popular and thus is of great discussion. Due to the very different scenarios of interacting with computer software and systems, there are different users, different views, different hardware setups and other variables which almost make every specific scenario entirely unique. Therefore comparison of findings of different authors under different field / laboratory conditions is impossible. Even the literature still lacks a universally agreed definition of the concept usability.
2.1.2 Different Definitions of the Concept Usability
The term usability was originally derived from the term “user friendly”. But due to the reason that this term had acquired significant subjective connotations “usability”
9241 (ISO 9241-11, 1994), a broader view). Thus the authors with the latter view preferred to name the term usability as “quality in use” (Bevan suggested this term Bevan, 1995b).
When considered the existing literature, it is not easy to find a single universally acceptable definition of this concept. One can quite easily figure out how complicated this can get by understanding that although several authors has worked upon usability for more almost two decades, even now there is lack of consensus in this field. Still there are several authors and international bodies whose definition of usability is widely recognized such as; Shackel (Schakel, 1991), Nielsen (Nielsen, 1993a), ISO (ISO 9126 (ISO 9126, 1991) and ISO 9241 standards). Other definitions of usability which are not to be considered in-depth within this study can be found within the following books & studies: Constantine and Lockwood (Constantine and Lockwood, 1999); Hix and Hartson (Hix, Hartson, 1993); Preece (Preece, Rogers, Sharp, Benyon, Holland, Carey, 1994); Shneiderman (Shneirderman, 1986), Wixon and Wilson (Wixon, Wilson, 1997). The following statement successfully explains the current condition regarding the lack of consensus amongst different authors on defining usability:
Although there is a consensus about the term usability, there are many different approaches to how usability should be measured; hence usability is defined in such a way as to allow these measurements. This definition has resulted in different definitions of usability, because authors have different opinions on how to measure usability. (Folmer and Bosch 2004)
Actually Folmer and Bosch‟s statement conflicts within itself. The authors state that there is consensuses on the term usability but later add that every author in the field has different opinions regarding to what constitutes usability, the dimensions of usability. Thus if every author in the field has different opinions regarding the dimensions of usability then they do in fact have different definitions of usability meaning they do no have a consensus on the term. Thus the overall statement of
the different definitions of usability, the dimensions of the concept for the specific definition will also be provided to supply in-depth view of the author next to his / her definition of the term.
2.1.2.1 Schakel’s Definition of Usability
Schakel is amongst the first to study usability and usability engineering. His definition of usability is as follows:
The usability of a system is the capability in human functional terms to be used easily and effectively by the specified range of users, given specified training and user support, to fulfill the specified range of tasks, within the specified range of scenarios. (Schakel 1991)
This definition takes into account two sides of usability; the relative side and the objective side. The relativity of his definition states that usability is affected by the scenario and users. The objective side states that a system is usable if it is capable of effectively performing to fulfill the specified range of tasks by the users. So if it is possible to fulfill the tasks then the system has high usability. Although Schakel‟s definition clearly states the relativistic behavior of the concept, there is no guidance on how to measure it. This relativistic property of the concept is termed as its context-dependence meaning that any usability measurement is depending upon the user, environment, system and etc. Therefore user‟s properties (such as culture, attitude towards computers) or environmental conditions (lightning, noise... etc.) or system conditions (such as a low hardware performance, for the evaluation of the usability of a software interface) all impact the perceived level of usability. The context-dependent nature of the concept therefore adds to the complexity with subjective evaluations and perceptions of the user. Figure 2.1 displays his complete model where usability is a construct under product acceptance.
Figure 2.1: Schakel‟s Product Acceptance Definition & Dimensions
In Schakel‟s model product acceptance is the highest concept utility, usability, likeability and costs, are its constructs. Usability Construct is of composed of effectiveness, learnability, flexibility and attitude sub-constructs. When compared to other important usability definitions following overlaps are found: Effectiveness is also a criterion in ISO 9241-11, learnability is a criterion in ISO 9126. It is interesting to see that although Schakel mentioned effectiveness under usability, he has not taken efficiency as a construct to usability.
2.1.2.2 Nielsen’s Definition of Usability
Nielsen is also amongst to first to study the concept of Usability. He does not give a precise definition of usability as Schakel does but rather examines it under the concept of product acceptance / acceptability (Figure 2.2) (Nielsen 1993a). His work regarding is as follows:
He has placed usability under the usefulness dimension which is a sub dimension of practical acceptability of a product. The explanation of the concept takes into account 5 different dimensions: learnability, efficiency, memorability, errors and satisfaction.
Learnability: Systems should be easy to learn. Users can rapidly start getting come work done with the system.
Efficiency: Systems should be efficient to use. When a user has fully learned the system, productivity, will be possible on a high level.
Memorability: Systems should be easy to remember, making it possible for casual users to return to the system after some period of not using the system, without having to learn everything all over again.
Errors: The system should have a low error rate, which enables users to make few errors during the use of the system. When they do make errors they can easily recover from them. Catastrophic errors should not occur.
Satisfaction: The system should be pleasant to use; which makes users subjectively satisfied when using it.
This is a real clear definition of the concept. All dimensions offered by Nielsen are system outputs meaning all are performance criterion measured when the real world system is deployed under real world scenarios. This is consistent in terms of being able to measure all dimensions that are offered in the same time horizon (cross-shot measurement) of system interaction.
As Schakel, Nielsen‟s approach also embodies both objective and subjective criterias of evaluation. Learnability, Efficiency, Memorability and Errors are the objective criterias of evaluation while satisfaction is a subjective one.
Satisfaction only overlaps with ISO 9241-11‟s definition. Efficiency overlaps with only ISO 9241-11. Nielsen‟s and Schakel‟s Error dimension also overlaps (which is an effectiveness criterion).
In direct comparison to Schakel, Nielsen‟s explanation of the concept is more detailed and more closely resembles ISO 9126‟s approach.
2.1.2.3 ISO 9126’s Definition of Usability
ISO has published several standards that focus upon usability, amongst them, ISO 9126, ISO 9126-1 and ISO9241-11 are most popular by practioners. ISO 9126 (1991) gave a definition of usability as follows; “Usability is a set of attributes of software which bear on the effort needed for use and on the individual assessment of such use by a stated or implied set of users.” (ISO 9126, 1991)
This definition takes into account the subjective perspective by the assessment of the “implied set of users”. The term “implied set of users”, to a certain degree, reflect the very context dependent nature of the concept which is in harmony with the works of Schakel. Up to here, the ISO 9126‟s definition is consistent with the current views of the authors that worked upon this field. However, “Usability is a set of attributes of software” clearly limits the practioners by downgrading the concept into the properties of the software only. The overall performance perceived is not only limited to the software which is an essential but not the single sub-component of a system (IT-System in this context). Also adding to this very fact, the context dependency which is evident in this definition is only limited to the user however, other factors such as environment, training, and scenario are not taken into account. As a result of these limitations the view of original ISO 9126 has changed considerably throughout the time and transformed it self into an overall quality model by ISO 9126-1 (2000). In this quality model usability plays two different
Figure 2.3: ISO 9126-1 Software Quality Model
In ISO 9126-1 software quality is referred to as “quality in use” and quality in use is defined as; “The capability of the software product to enable specified users to achieve specified goals with effectiveness, productivity, safety and satisfaction in a specified context of use.” (Figure 2.3) (ISO 9126-1, 2000)
The definition of the ISO 9126-1 reflects the very welcomed perception of the concept today. This definition is almost identical to ISO 9241-11 definition except that it adds a further dimension into consideration which is “safety”. According to Bevan the two definitions of ISO (referring to ISO 9126-1 and ISO 9241-11) are complimentary (Bevan, 2001).
The view of ISO 9126-1 encompasses two different roles of usability. These roles are:
Product oriented role: Usability is a part of software design process. This is in harmony with the view of the original ISO 9126 (1991). The concept is an attribute of software quality.
The latter role; “Process oriented role” is referred to as “quality in use”. This is the broad definition of the concept in contrast with the narrow view of the concept where usability is a software attribute in product oriented role. ISO 9126-1 combined the definitions of ISO 9126 (product oriented role) with ISO 9241-11 (process oriented role).
Effectiveness, productivity and safety are objective dimensions offered by this definition where as satisfaction is the subjective one. The context dependence of the concept is also evident by the terms “Specified users”, “Specified context of use” and “Specified goals”. On the dimension of context dependence we find out that ISO 9126 only takes into account “users” where as the successor ISO 9126-1 takes into account also “context of use” and “specified goals”. Thus the ISO 9126-1‟s context dependence is more detailed and satisfactory. One can quite easily come up with the conclusion that every usability study is unique due to the reason that the objectives of the system, the environment (physical, the organization) and the users are almost different in each and every scenario. The following are the dimensions of quality in use according to ISO 9126-1 model;
Functionality: The capability of the software to provide functions which meet stated and implied needs when the software is used under specified conditions.
Reliability: The capability of the software to maintain its level of performance when used under specified conditions.
Usability: The capability of the software to be understood, learned, used and liked by the users, when used under specified conditions.
Efficiency: The capability of the software to provide the required performance, relative to the amount of resources used, under stated conditions.
Maintainability: The capability of the software to be modified. Modifications may include corrections, improvements or adaptation of the software to
Portability: The capability of software to be transferred from one environment to another.
The following are the dimensions of usability which are offered by ISO 9126-1 (2000);
Understandability: The capability of the software product to enable the user to understand whether the software is suitable, and how it can be used for particular tasks and conditions of use.
Learnability: The capability of the software product to enable the user to learn its application.
Operability: The capability of the software product to enable the user to operate and control it.
Attractiveness: The capability of the software product to be attractive to the user. For instance the use of colors or nature of graphical design.
What is most impressive about the redefined and enriched view of the ISO 9126 standard is that (by ISO 9126-1, 2000) it meets the very different definitions required due to their different processes and ways interactions of two different sets of users in a single definition and international standard. These sets of users are; software engineers and the final / end users of the system. The software engineers mostly interact with the system in the design phase where the product is far from market launch and is even on the “drawing board”. At this time of the life-cycle of a software, product engineers are trying to design how the final users will interact (interface design) with the product and will judge whether it is understandable, learnable, operable and attractive to them to a satisfactory degree in contrast with the resources utilized to realize the whole system. For engineers a highly usable system, from their perspective and their objectives is mostly one which is easily portable to
software), can be easily modified to add further functionalities and corrections are easy to apply. However, these criteria are almost non-decisive when we switch to the views of the final / end user who pay more attention to the overall perceived quality of the system. For them the most obvious criterion are functionality, reliability, usability and to efficiency. ISO 9126-1 is capable of defining usability satisfactorily for both of these types of users.
2.1.2.4 ISO 9241’s Definition of Usability
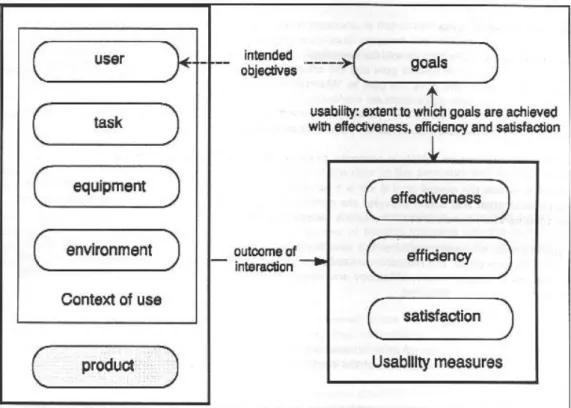
ISO 9241-11 (1994) is amongst several standards that are developed for the purpose of standardizing the way of interaction of a user with computers (Figure 2.4). Chapter 11 of ISO 9241 (Guidance on Usability), focuses on the ergonomic requirements for office work with Visual Display Terminals. This standard has led to guidelines for software interfaces based on research by Macleod (1994) and Bevan (1995a). According to ISO 9241-11 (1994) usability is defined as; “Extent to which a product can be used by specified users to achieve specified goals with effectiveness, efficiency and satisfaction in a specified context of use.”
This definition takes into account objective criterion such as effectiveness and efficiency. Satisfaction is the only subjective criteria suggested. When remembered ISO 9126-1‟s definition of the concept, one can quite easily find out that both definitions are identical except that ISO 9126-1 adds safety. Thus ISO 9241-11 is the prior standard in which usability is defined up to a real satisfactory level which is widely accepted and welcomed by practioners. It is in harmony with the broad view of the concept which clearly states that usability is a design objective of the overall system which is a final goal itself. This broad view is identical to the product-oriented role of the ISO 9126-1.
Figure 2.4: ISO 9241-11 Usability Model
Effectiveness: Measures of effectiveness relate the goals or sub goals of the user to the accuracy and completeness with which these goals can be achieved.
Efficiency: Measures of efficiency relate the level of effectiveness achieved to the expenditure of resources. Relevant resources can include mental or physical effort, time, materials or financial cost. For example, human efficiency could be measured as effectiveness divided by human effort, temporal efficient as effectiveness divided by time or economic effiency as effectiveness divided by cost.
Satisfaction: Satisfaction measures the extent to which users are free from discomfort, and their attitudes towards the use of the product.
ISO 9241-11 provides the following information regarding the dimensions of the concept. Effectiveness is composed of accuracy and completeness. The user should be able to complete his / her goals with accuracy. Efficiency is composed of temporal, humane and financial. This wide view of efficiency takes into account different views of different actors within the organization who are responsible of making the strategic decision to utilize this software product, such as the top-level manager who is mostly concerned with financial efficiency or the actual system user (operator) who is mostly concerned with time efficiency. Satisfaction is composed of comfort and acceptance. One can quite easily refer back to the definitions of Nielsen and Schakel who takes usability as a dimension to the concept of product acceptance and see the correlation with ISO 9241-11‟s acceptance dimension.
The framework of usability according to the ISO 9241-11, which pays much importance to the context dependence (context is composed of user, task, equipment and environment) of the concept, is as follows:
Figure 2.5: Joined Display of ISO 9241-11 and ISO 9126-1 Models
The definition of the concept pays much importance to the context dependence. The context dependence takes into account specified users, specified goals and specified context of use. Therefore any usability definition or measurement of a system in evaluation is dependent to a very important level to the actual users, the goals that are to be achieved, the practical and social environment of usage and other context factors. The following paragraph from the standard clearly explains the level of importance paid to this aspect:
ISO 9241-11 emphasizes that visual display terminal usability is dependent on the context of use and that the level of usability achieved will depend on
and the physical and social environments which may all influence the usability of a product in a work system. Measures of user performance and satisfaction assess the overall work system, and, when a product is the focus on concern, these measures provide information about the usability of that product in the particular context of use provided by the rest of the work system. The effects of changes in other components of the work system, such as the amount of user training, or the improvement of the lightning, can also be measured by user performance and satisfaction. (ISO 9241-11, 1994)
As evident by the above explanation, the usability measurements are context oriented by their nature. It is not possible and wise to compare different measurements of the same particular software product in different organizations as the overall user performance and satisfaction is effected to a very certain degree by the different contexts of utilization. Therefore usability measurements are most useful in scenarios where the objective is to measure the relative utility gained by a single or a tiny improvement utilized within the system in almost the exact identical context. The standard clearly emphasizes against the comparison of different usability measurements directly against each other.
Care should be taken in generalizing the results of any measurement of usability to another context which may have significantly different types of users, tasks, or environments. If measures of usability obtained over short periods of time, the values may not take account of infrequent events which could have a significant impact on usability, for example intermittent system errors. For a general purpose product, it will generally be necessary to specify or measure usability in several different representative contexts, which will be a subset of the possible contexts of the tasks which can be performed. There may be differences between usability in these contexts. (ISO 9241-11, 1994)
The standard supplies in-depth information for a usability professional to identify relevant information in a specific context of use for measuring effectiveness, efficiency and satisfaction.
2.1.3 How Different Definitions Overlap Each Other?
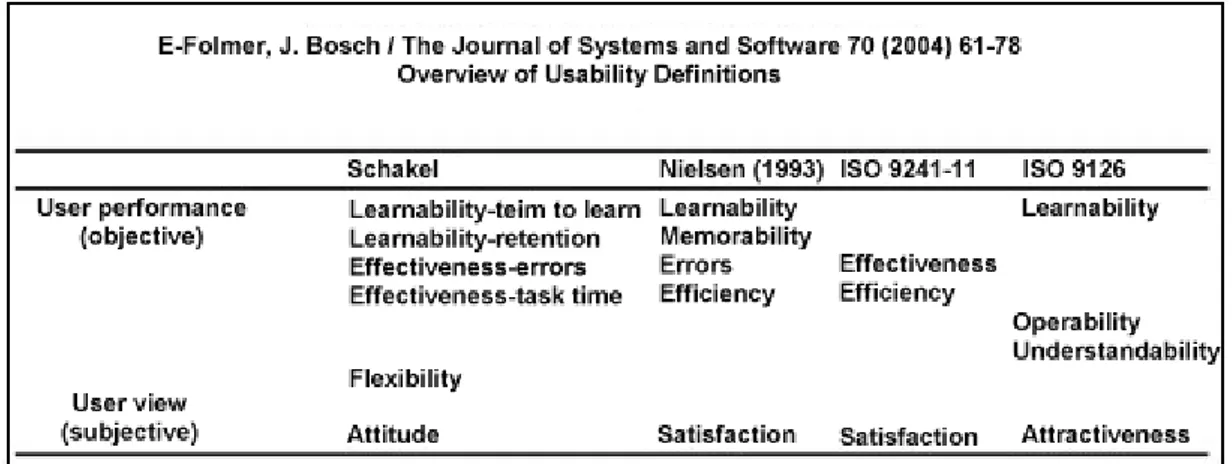
Figure 2.6 taken from Folmer and Bosch (2004) is a good indicator of the overlap between different definitions of usability. However one should be conscious as to the possibility of the variations of different definitions for the proposed dimensions of the concept (I.E learnability of Schakel focuses on “time-to-learn” and “retention” aspects however Nielsen‟s definition of the very same learnability dimension is not that clear and thus there could be differences). It should also be noted that on the following figure it is not entirely correct to directly compare ISO 9241-11‟s view of usability (broad view of usability) with the narrow views of usability of the other authors and / or standards (explained in details later).
Figure 2.6: Overview of Usability Definitions
On a general bases all authors examine usability on two dimensions:
Objective Criterion: A fact which is measurable by some objective data such as time to complete the task, accuracy of the action, time to learn the software and etc,.
Subjective Criterion: A fact which is subjective in nature such as satisfaction with the usage of a software or finding the software attractive (i.e. the
Learnability (exists in 3 of 4 definitions), effectiveness (exists in 3 of 4 definitions), efficiency (exists in 3 of 4 definitions) and satisfaction (exists in all definitions if finding the software attractive and having a good positive attitude software is to be taken into account as satisfaction) are the most popular dimensions.
ISO 9241-11 paved the way to the redefined ISO 9126-1 (2000) standard to evaluate usability from a broader view (process oriented role). ISO 9126-1 (2000) is the only definition which joins two different views on usability in a single framework of evaluation. These views are: the software engineers view (product oriented view) and the end / final users‟ view (quality in use: usability is a final goal to achieve process oriented role).
ISO‟s definitions are complimentary to each other. However when comparing these two standards one should clearly state which different view of ISO 9126-1 is being taken into account due to the reason that ISO 9126-1‟s product oriented view of usability is not the same thing as ISO 9241-11‟s process oriented broader view. This important consideration should also be paid important attention when ISO 9241-11‟s usability definition is to be compared and / or analyzed in contrast with Nielsen‟s and Schakel‟s definitions. Actually ISO 9241-11‟s view of usability (broad view of usability) can be said to be the same construct with product acceptance of Schakel and product acceptability of Nielsen. In this view of the concept; the usability of the overall system / software is the final goal; it should be effective and efficient on an objective basis and users should be satisfied with the overall usage thus meaning that they should be accepting the product as a good solution to their problem domain (as in terms of Nielsen‟s and Schakel‟s definitions in which product acceptance / acceptability is the final goal). On another view when we focus onto usability on a narrower view such as the one in ISO 9126-1‟s product oriented approach (usability dimension of the overall quality in use) Nielsen‟s usability dimension which is a sub-dimension of usefulness and Schakel‟s usability sub-dimension which is a sub-sub-dimension of product acceptance must be taken into account. As a summary; one should not conflict between usability on a narrow view (which is actually the usability of the
view is considered should be made clearly. This is the exact reason why we commented upon the figure taken from Folmer and Bosch (2004). In that figure the narrow view of Nielsen, Schakel and ISO 9126-1 is on comparison with broad view of ISO 11. There is no the so-called “narrow view” of usability in ISO 9241-11.
Delving deeper into different definitions and views of the authors in the field, one sees important problems. The ambiguity of the term resulted different views of usability by different authorities. There is overlapping and interference but lack of consensus. Adding to the complexity level, all authors proposed several dimensions which they claim to explain the concept but even on a dimension basis, the explanations of these dimensions differ thus one can not be sure that learnability of Nielsen means / measures the very same aspect as of learnability of ISO 9126-1. Finally the context dependence nature of the concept makes it impossible to compare different usability tests directly and thus each and every observer in the field tries to improve their perception of usability of a system on their own isolated level (testing, measurements and etc,.). Summing up, all these limitations force us to use usability evaluation / testing methods / tools to investigate relative improvements on a system level and their impact upon relativistic usability of specific context driven scenarios. This is the exact reason why latter definitions of usability, especially the ones by ISO, pay significant attention to context dependence. Both ISO 9241-11 (1998) and redefined ISO 9126-1 (2000) suggests that the context is to be clearly stated with any measurements of usability.
2.1.4 Measuring Usability
The literature regarding usability is full of several different kinds of methods developed for measuring the concept. Some of these methods try to predict / forecast a system‟s usability within the design phase and some try to evaluate an already existing live system for future improvements. Regarding to the stage within the life
Zhang‟s (2001) view usability testing / measurement methods can be classified into three distinct categories. These are:
Usability Testing Usability Inspection Usability Inquiry
2.1.4.1 Usability Testing
This approach requires representative users to complete and test-drive the system on typical tasks that will be performed by the system. The users can work on semi-finished systems / products, therefore it can be deployed within specific stages of the system design cycle for recognizing early usability flows and deploying improvement plans as soon as possible before it gets to costly to redesign the solution. The evaluators evaluate the results of the users for deciding upon improvements. This testing method is especially suitable for measuring the interface usability of a system (There for it measures the narrow view of usability (interface usability) not the broad view, as existent in ISO 9126-1, of usability). Some methods which are utilized within this classification are;
Coaching method (Nielsen, 1993a)
Performance measurement (Nielsen, 1993a; Soken, Reinhart, Vora, Metz, 1993)
Remote Testing (Hartson, Castillo, Kelso, Kamler, Neale, 1996) Teaching method (Vora and Helander, 1995)
2.1.4.2 Usability Inspection
This approach requires the availability of specialists, experts. These experts examine the system and judge whether the user interface follow established usability principles (such as colors within the interface, help dialog boxes, error messages, interaction via a mouse and keyboard, etc.). This approach does not require the availability of representative and / or actual system users. As usability testing, this classification is also focused on the narrow view of usability and the methods available are convenient for utilization while the system is within the design stage. Some methods which are commonly utilized under this classification are:
Heuristic evaluation (Nielsen 1994b).
Cognitive walkthrough (Wharton, Rieman, Lewis, Polson 1994). Perspective-based inspection (Zhang, Basili, Shneiderman 1998).
Standards inspection / guideline checklists (Wixon , Jones, Tse, Casaday 1994).
2.1.4.3 Usability Inquiry
This approach requires the availability of the actual finished system and the actual users interacting with the system. The evaluators try to gather information / actual feedbacks from the actual users from their actual perception of the relative usability of the system. The gathered data can be both objective and subjective. An example to an objective criterion is; “Time to complete the task” which is quantifiably measurable and an example to a subjective criterion is; “The level of satisfaction”. This classification can both measure the narrow view and / or broad view of usability regarding to the testing approach and the data gathered. Some of the methods that are deployed in this approach are:
Field observation (Nielsen 1993a).
Interviews / Focus Groups (Nielsen, 1993a). Surveys (Alreck and Settle 1994).
Logging Actual Use (Nielsen 1993a). Proactive field Study (Nielsen 1993a).
The inquiry methods are widely utilized within the industry. The methods mainly aim to measure the experiences of actual users in a real world scenario and use the gathered data for improving the system for a better experience. Therefore they are mainly used for measuring the improvements and their impact upon perceived level of usability of a specific system. Different measurements of different systems can not be compared against each other as each system is a complete different scenario that is composed of different goals, objectives, hardware, users, environment and etc.
One should clearly understand that for a software solution these three classification of usability measurement are used accordingly in each different stages of the software life-cycle (i.e.; usability testing and / or inspection is utilized while the system is being developed (design-stage), usability inquiry methods are used when the actual system is developed and potential improvements are analyzed and / or investigated). Within inquiry methods questionnaires are the most popular. There are significant numbers of questionnaires developed within the literature. All these questionnaires are psychometrically evaluated by different authors throughout the time. Most popular ones are:
QUIS: Questionnaire for user interface satisfaction (Chin, Diehl, Norman, 1988).
PEUE: Perceived usefulness and ease of use (Davis 1989). NHE: Nielsen‟s heuristic evaluation (Nielsen 1993a).
CSUQ: Computer system usability questionnaire (Lewis 1995). ASQ: After scenario questionnaire (Lewis 1995).
SUMI: Software usability measurement inventory (HFRG 2002).
MUMMS: Measurement of usability of multimedia software (HFRG 2002). WAMMI: Website analysis and measurement inventory (HFRG 2002). EUCSI: End user satisfaction instrument (Doll, Torkzadeh 1994).
All these questionnaires are developed upon the authors‟ view and favored usability definition and thus one should be cautious and pay attention to the authors‟ view of usability before using them. This is the exact reason to why each usability measurement pays significant amount of time to first explain their favored definition of usability first and then detail the measurement method, instrument and etc.
Zhang‟s (2001) classification of usability is not the only classification available. Another good classification of usability measurement methods is by Gediga, Hamborg and Düntsch (?). They classify usability evaluation techniques into two distinct categories:
Descriptive Evaluation Techniques: They are used to describe the status and the actual problems of software in an objective, reliable and valid way. These techniques are user based and can be subdivided into several approaches:
o Behavior based evaluation techniques record user behavior while working with a system which “produces” some kind of data. These procedures include observational techniques and “thinking-aloud” protocols.
o Opinion based evaluation methods aim to elicit the user‟s (subjective) opinions. Examples are interviews, surveys and questionnaires.
o Usability Testing stems from classical experimental design studies. Nowadays, Usability testing (as a technical term) is understood to be a
amount of experimental control, usually chosen by an expert. Observe that all descriptive evaluation techniques require some kind of prototype and at least one user. Note furthermore that the data gathered by a descriptive technique need some further interpretation by one or more experts in order to result in recommendations for future software development.
The predictive evaluation techniques have as their main aim to make recommendations for future software development and the prevention of usability errors. These techniques are expert or at least expertise – based, such as Walkthrough or inspection techniques. Even though the expert is the driving power in these methods, users may also participate in some instances.
Note that predictive evaluation techniques must rely on “data”. In many predictive evaluation techniques, such “data” are produced by experts who simulate “real” users. The criteria objectivity and reliability, which are at the basis of descriptive techniques, are hard to apply in this setting. Because validity must be the major aim of evaluation procedures, there are attempts to prove the validity of predictive evaluation techniques directly, e.g. by comparing “hits” and “false alarm” rates of the problems detected by a predictive technique
It is easy for one to see that Gediga, Hamborg and Düntsch‟s “Descriptive evaluation techniques” classification covers “Usability Inquiry” of Zhang‟s (2001) classification. As such their predictive evaluation techniques cover “Usability Testing” and “Usability Inspection” of Zhang‟s (2001) classification.
Depending upon the objective of any research study either a single or a combination of the above mentioned classifications can be deployed. If one‟s approach is to develop guidelines then usability testing and / or inspection methods which mainly
more appropriate. Depending upon the specific techniques of interest objective and / or subjective data is to be gathered. It should also be pointed out that each technique is to be utilized and fine-tuned to the specific scenario of testing. Another important aspect is that, one should clearly state the definition of interest before making any attempts to measure usability of a specific system.
When one‟s aim is to examine the impact of usability upon an already existing system for examining correlations with specific variables of interest and / or for future improvement recommendations, the inquiry methods comes into play. Especially questionnaires in inquiry methods are of great interest within the literature. These measurement tools are easy to apply (in contrast to the methods which require specific hardware setups for data gathering such as the one in: “Physiological responses to different web page designs” (Ward, Marsden 2003), this article examines one‟s heart rate and other physiological parameters and their variability against different web page designs) and are good at capturing subjective data from users. It is important to assess subjective data such as satisfaction on usability inquiry methods as at this level (the software is fully developed and actual users are interacting with the final system) as user satisfaction and their perceived level of the actual system is the real criteria regarding to the perceived performance of the final system. Therefore evaluating a system‟s performance solely on objective performance criteria such as time to complete a task is inappropriate as the users can resist using a system which they do not favor and / or dislike and / or dissatisfied although objective performance is on a high level.
Focusing onto questionnaires in usability inquiry classification of Zhang‟s (2001); one finds the following questionnaires mostly used in usability studies; QUIS (Chin 1988), PSSUQ (Lewis 1992a), CSUQ (Lewis 1995), ASQ (Lewis 1995), SUMI (HFRG 2002), MUMMS (HFRG 2002), WAMMI (HFRG 2002). We will focus onto each questionnaire and supply the details in the following headlines.
2.1.4.3.1 QUIS: Questionnaire for user interface satisfaction (Chin, 1988)
Chin‟s, 1998 work regarding user interface satisfaction is on comparing the relative perceived usability of a liked versus disliked software and a Command Line System (CLS, like old dos based environment) versus a Menu Driven Application (MAD, much like today‟s windows environment). The original work of Chin was conducted on 150 users. The questionnaire (QUIS) contains several semantic differential scale items. Examples to some of the bipolar adjectives are:
Terrible, Wonderful Difficult, Easy
Frustrating, Satisfying Dull, Stimulating Rigid, Flexible
Confusing, Very Clear Inconsistent, Consistent Unhelpful, Helpful
The reliability of Chin‟s original work was 0.94 (Cronbach‟s alpha) (QUIS version 5.0, 21 items). Earlier versions of QUIS was a long questionnaire (there were several versions of QUIS, QUIS 3.0 consisted of 103 item ratings with a Cronbach‟s alpha of 0.94, QUIS 4.0 consisted of 70 items with a Cronbach‟s alpha of 0.89). The interitem alpha values of QUIS 5.0 ranged from .933 to .939. Further versions decreased the number of items significantly. Originally Chin tried to examine the discriminatory power of the questionnaire by examining the differences between questionnaire responses on liked versus disliked and CLS versus MDA software. Factor analysis of QUIS found 4 factors and Chin has named these factors as: Learning, Terminology and Information flow, System Output and System Characteristics.
The mean differences between liked and disliked software can be examined on each specific items in Table 2.1.
In overall reactions liked software rated significantly higher results than disliked software. In 3 items this result was significant at the level of p<.001. Easy / difficult was the only item that produced a result which was not significant (p<.05). For the component questions (the latter 21 items under the headings screen, terminology and system information, learning, system capabilities) some of the items were significant at the level p<.05, none of the items were significant at the level of p<.001.
The mean differences between CLS and MDA software can be examined on each specific item in the figure in the next page. In general, all the MDA mean ratings were higher than CLS. All of the overall reaction items were significant on t-test mostly at the level of p<.0001. The single exception was difficult / easy. One can remember that this was the case for difficult / easy also on the comparison of liked versus disliked software. In 21 component questions, 8 were significant at the level of p<.001.
Generally, Chin‟s QUIS 5.0 discriminated MDA versus CLS better than liked versus disliked software. Chin‟s attempt to measure the user interface satisfaction in 1998 was amongst the first in the field. Chin, Diehl and Norman established a reliable questionnaire which was able to measure existent satisfaction of a system user on 4 factors. Therefore it proved important value for examining an existing product on 4 dimensions and pointing out the relative points of consideration which have to be focused for improving the product. It is a good tool to either compare different products amongst or a latter version of the same product with an earlier version for measuring the impact of modifications on satisfaction.
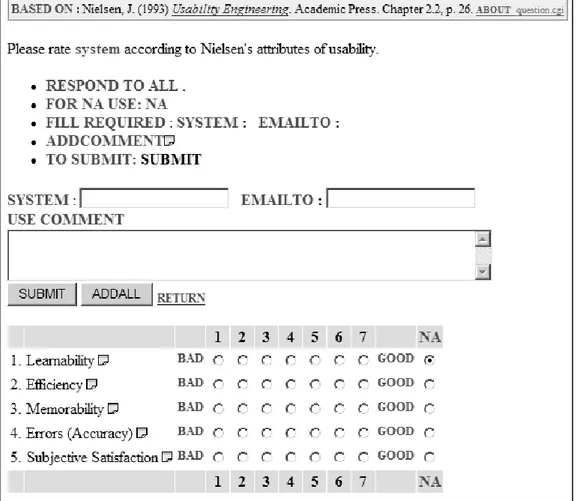
QUIS 5.0 questionnaire of Chin (1988) can be examined in Figure 2.7. It contains 6 overall reaction items and 21 main component items under 4 factors.
Figure 2.7: A QUIS Questionnaire Example
purchase) on a trial period therefore is an important and respected tool in Management Information Systems.
Figure 2.8: Technology Acceptance Model of Davis*
Its reliability and validity has been tested several times throughout the literature (William, Doll, Xiaodong 1998). Most of the research which focused on this matter focused on Davis‟s instruments ability to act as invariant between different contexts such as amongst users with different computer experiences, different organizations and different types of applications (such as word processing, spreadsheets, database applications, etc.). Davis‟s latter work showed that TAM was capable of explaining the %40 or variance in intentions to use of a specific application in a specific context (Venkatesh, Davis 2000). TAM focuses on two beliefs of system users, perceived usefulness and perceived ease of use. These two beliefs, according to TAM, will result and can predict computer acceptance behavior.
TAM posits that two particular beliefs, perceived usefulness and perceived ease of use, can predict computer acceptance behavior. Perceived usefulness is defined as the prospective user's subjective probability that using a specific application system will increase his or her job performance within an organizational context. Perceived ease of use refers to the degree to which the prospective user expects the target system to be free of effort. Perceived usefulness and ease of use are meant to be fairly general determinants of user acceptance. Davis et al. (1989) described them as belief sets that are meant to be readily generalizable to different computer systems (applications) and user
populations. They argued that the ability to take robust, well-formed measures of the determinants of user acceptance early in the development process (i.e., initial exposure data) can have an impact on system acceptance by enabling developers to weed out bad systems, refine the rest, and generally cut the risk of delivering finished systems that get rejected by users. (Hendrickson, Deng 1998)
Figure 2.9 displays an instrument that is deployed in a study which examines the social influences for TAM in a course delivery system (Shen, Laffey, Lin, Huang 2006). Perceived usefulness and perceived utility each is measured by six, 7-point Lickert scale items.
Figure 2.9: A TAM Questionnaire
Davis‟s PEUE instrument is a great tool which is validated several times throughout the literature and has been found to be both reliable and valid. This instrument is convenient for being deployed in organizational contexts where one‟s aim is to choose amongst available Information System products and want to discriminate between ones which will be favored by potential users to their high perceived