NON-AGRICULTURAL UNEMPLOYMENT CONTINUES
TO INCREASE RAPIDLY
Seyfettin Gürsel*, Zümrüt İmamoğluand Ayşenur Acar
Abstract
Seasonally adjusted labor market data shows that non-agricultural unemployment rate increased by 0.5 percentage point in the period of June 2014 compared to the period of May 2014, and reached 12 percent. In this period, we observe employment loses in all sectors, with the exception of the service sector. Employment growth could not counterbalance the increase in labor force, hence non-agricultural unemployment increased in this period. Non-agricultural unemployment rate that has stagnated in the range of 10-11 percent since January 2011, reached 12 percent in this period. Our forecasting model based on Kariyer.net data indicates that non-agricultural
unemployment will continue to increase in the next period.
Slowing down in annual increases in non-agricultural employment
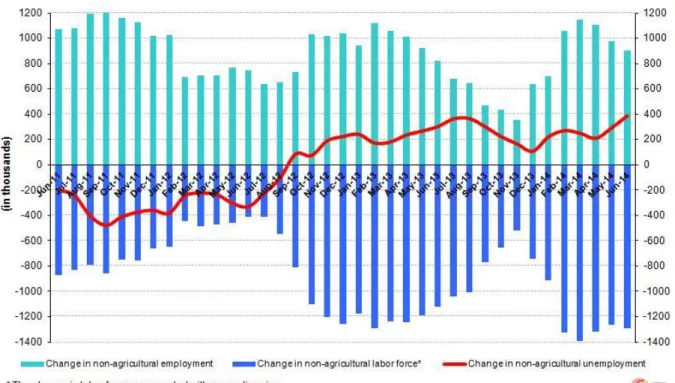
According to the data released by TurkSTAT, non-agricultural labor force increased by 1 million 288 thousand (5.9 percent) and non-agricultural employment increased by 904 thousand (4.6 percent) in the period of June 2014 (Figure 1). Consequently, the number of persons unemployed in non-agricultural sectors increased by 384 thousand. Annual increases in agricultural employment slowed down compared to the increases in non-agricultural labor force. While non-non-agricultural labor force has been increasing over 1 million since the last two periods, increases in non-agricultural employment has been below 1 million. Hence, number of unemployed increased in this period. Slowdown in the growth rate is reflecting on the labor market.
Figure 1 Year-on-year changes in non-agricultural labor force, employment and unemployment
Source: TurkSTAT,Betam
*Prof. Dr. Seyfettin Gürsel, Betam, Director, [email protected]
Zümrüt İmamoğlu, PhD, Betam, Research Associate, [email protected] Ayşenur Acar, PhD, Betam, Research Assistant, [email protected]
Labor Market Outlook:
September 2014
www.betam.bahcesehir.edu.tr
2
Non-agricultural unemployment continues to increase
According to seasonally adjusted data, non-agricultural labor force increased by 104 thousand in the period of June 2014 compared to the period of May 2014, and reached 23 million 124 thousand (Figure 2, Table 1).
Non-agricultural employment decreased by 24 thousand and reached 20 million 349 thousand. Hence, the number of persons unemployed in non-agricultural sectors increased by 128 thousand and non-agricultural unemployment rate increased by 0.5 percentage point and reached 12 percent. Given that the non-agricultural unemployment rate has been stagnating in the range of 10 to 11 percent, the increase to 12 percent is sizeable. We would like to remind our readers that non-agricultural unemployment rate reached its peak rate (16.9 percent) during 2009 financial crisis, then it rapidly decreased to the range of 10-11 percent. This rapid increase raises worries about the labor market. Moreover, unemployment forecasting model of Betam indicates that non-agricultural unemployment will continue to increase in the period of July 2014.
Figure 2 Seasonally adjusted non-agricultural labor force, employment and unemployment
Source: TurkStat,Betam
According to Kariyer.net data, non-agricultural unemployment will continue to increase in the
next period
Our calculations based on the seasonally adjusted application per vacancy statistics calculated using Kariyer.net1
series accurately predicted the direction of unemployment for the periods of May and June 2014. Parallel to our expectations , unemployment rapidly increased in these two periods. The seasonally adjusted application per vacancy statistics calculated using Kariyer.net are presented in Figure 3. The application per vacancy has
increased since January 2011, continued to increase on July and August. According to the forecasting results, non-agricultural unemployment will increase in the period of July 2014 as well. Unemployment rate will continue to increase in the next period due to economic contraction observed in the second quarter of 2014
1 Betam has been calculating application per vacancy using series released by Kariyer.net for a while. Seasonal and calendar adjustment
procedure is applied to application per vacancy series. A decrease in applications per vacancy may be caused by an increase in vacancies or by a decrease in the number of applications. An increase in vacancies signals economic growth while decreasing number of applications indicates a decrease in number of people looking for a job. Monthly labor market series released by TurkStat is the average of three months. Therefore, application per vacancy statistics calculated using Kariyer.net series is the average of three months as well.
Figure 3 Seasonally adjusted non-agricultural unemployment rate and application per vacancy
Source: Kariyer.net, TurkStat,Betam
Employment losses in all sectors, with the exception of service sector
Seasonally adjusted labor market series show that employment decreased in all sectors (except service sector) in the period of June2014 (Table 2, Figure 4).2Service employment that has been decreasing since the last three
periods, decreased by 54 thousand in the period of June 2014. Similarly, manufacturing employment that has been slightly decreasing in the period of May 2014, decreased by 32 thousand. Service employment increased by 62 thousand compared to the previous period. However, employment loses in manufacturing and construction sectors could not compensate the increase in manufacturing employment, hence non-agricultural employment decreased by 24 thousand. Employment losses in manufacturing and construction sectors could be taken as response of the economic slowdown in Turkey.
2Employment in each sector is seasonally adjusted separately. Hence the sum of these series may differ from the seasonally adjusted series of
www.betam.bahcesehir.edu.tr
4
Figure 4 Employment by sectors (in thousands)3Source: TurkStat,Betam
Table 1 Seasonally adjusted non-agricultural labor force indicators (in thousands)
Labor force Employment Unemployment Unemployment rate Monthly changes
May-11 20166 17766 2400 11.9% Labor force Employment Unemployment
June-11 20190 17808 2382 11.8% 25 42 -17 July-11 20225 17919 2306 11.4% 34 111 -77 August-11 20208 17985 2223 11.0% -17 66 -83 September-11 20234 18109 2125 10.5% 26 124 -98 October-11 20172 18014 2158 10.7% -61 -95 34 November-11 20249 18163 2086 10.3% 76 149 -73 December-11 20277 18168 2109 10.4% 28 5 23 January-12 20398 18317 2081 10.2% 121 149 -28 February-12 20220 18117 2103 10.4% -178 -200 22 March-12 20403 18281 2122 10.4% 183 164 19 April-12 20569 18471 2098 10.2% 166 190 -24 May-12 20671 18583 2088 10.1% 102 112 -10 June-12 20673 18647 2026 9.8% 2 64 -62 July-12 20782 18704 2078 10.0% 109 57 52 August-12 20861 18754 2107 10.1% 79 50 29 September-12 21085 18871 2214 10.5% 224 117 107 October-12 21202 18976 2226 10.5% 117 105 12 November-12 21360 19096 2264 10.6% 158 120 38 December-12 21455 19138 2317 10.8% 95 42 53 January-13 21541 19236 2305 10.7% 86 98 -12 February-13 21492 19214 2278 10.6% -49 -22 -27 March-13 21582 19273 2309 10.7% 90 59 31 April-13 21756 19406 2350 10.8% 173 133 40 May-13 21802 19447 2355 10.8% 46 41 5 June-13 21820 19463 2357 10.8% 18 16 2 July-13 21836 19412 2424 11.1% 16 -51 67 August-13 21926 19448 2478 11.3% 90 36 54 September-13 21983 19477 2506 11.4% 57 29 28 October-13 22031 19586 2445 11.1% 48 109 -61 November-13 22038 19592 2446 11.1% 7 6 1 December-13 22256 19830 2426 10.9% 218 238 -20 January-14 22517 20018 2499 11.1% 262 188 74 February-14 22822 20289 2533 11.1% 305 271 34 March-14 22898 20356 2542 11.1% 75 67 8 April-14 22935 20389 2546 11.1% 37 33 4 May-14 23020 20373 2647 11.5% 86 -16 102 June-14 23124 20349 2775 12.0% 104 -24 128
6
Table 2 Seasonally adjusted employment by sector (in thousands)Agriculture Manufacturing Construction Service Monthly changes
May-11 5310 4915 1660 11191 Agriculture Manufacturing Construction Service
June-11 5368 4826 1680 11301 58 -89 20 110 July-11 5385 4846 1706 11367 17 20 26 66 August-11 5445 4816 1761 11408 60 -30 55 41 September-11 5377 4866 1762 11480 -68 50 1 72 October-11 5410 4823 1681 11510 33 -43 -81 30 November-11 5403 4870 1671 11622 -7 47 -10 112 December-11 5328 4873 1636 11659 -75 3 -35 37 January-12 5334 4864 1709 11745 6 -9 73 86 February-12 5278 4808 1563 11746 -56 -56 -146 1 March-12 5226 4850 1578 11853 -52 42 15 107 April-12 5255 4930 1651 11890 29 80 73 37 May-12 5301 4908 1725 11951 46 -22 74 61 June-12 5259 4900 1745 12001 -42 -8 20 50 July-12 5256 4926 1737 12041 -3 26 -8 40 August-12 5246 4892 1764 12097 -10 -34 27 56 September-12 5310 4911 1780 12179 64 19 16 82 October-12 5351 4917 1784 12274 41 6 4 95 November-12 5361 5003 1804 12289 10 86 20 15 December-12 5345 5051 1778 12309 -16 48 -26 20 January-13 5332 5073 1814 12349 -13 22 36 40 February-13 5301 5023 1801 12389 -31 -50 -13 40 March-13 5287 5083 1784 12406 -14 60 -17 17 April-13 5278 5176 1805 12425 -9 93 21 19 May-13 5219 5200 1749 12498 -59 24 -56 73 June-13 5194 5163 1781 12519 -25 -37 32 21 July-13 5188 5146 1729 12537 -6 -17 -52 18 August-13 5201 5117 1755 12576 13 -29 26 39 September-13 5195 5096 1780 12602 -6 -21 25 26 October-13 5109 5090 1853 12643 -86 -6 73 41 November-13 5070 5064 1806 12721 -39 -26 -47 78 December-13 5058 5131 1898 12801 -12 67 92 80 January-14 5404 5232 1951 12835 346 101 53 34 February-14 5535 5359 2018 12912 131 127 67 77 March-14 5609 5365 1980 13011 74 6 -38 99 April-14 5577 5373 1902 13114 -32 8 -78 103 May-14 5582 5364 1854 13155 5 -9 -48 41 June-14 5510 5332 1800 13217 -72 -32 -54 62