I44 IEEE TRANSACTIONS ON BROADCASTING, VOL 42, NO 2, JUNE 1996
C O M P U T E R AIDED FREQUENCY PLANNING
F O R
THE
RADIO AND TV BROADCASTS
A. Altintag, 0. Ocali, S. T o p p , S. G. Tanyer', and H. Kijymen
Bilkent University, Department of Electrical and Electronics Eng., Bilkent, 06533, Ankara, Turkey, *Ankara University, Department of Electronics Eng., Tandogan, 06100, Ankara, Turkey.
Abstract-The frequency planning of the VHF and UHF
broadcasts in Turkey is described. This planning is done with t h e aid of computer databases and digital terrain map. The frequency offset is applied whenever applica- ble t o increase t h e channel capacity. The offset assign- ment is done through Simulated Annealing algorithm. The international rules and regulations concerning Turkey are also considered.
Introduction
The introduction of terrestrial VHF and UHF broadcast is not new. However, especially in many developing countries, this broadcast has been uuder the monopoly of the government. Only recently, the private broadcasting became a reality, even though in a de facto, and disorganized manner in many occasions. This brought up the need to have a nationwide re-planning, allocation, and management of the broadcast frequencies. The pressure from the public as well as the international agreements require that the planning has t o be done in the shortest possible time with realistic and applicable goals. Therefore, an integrated approach with maximum utilization of computers and relevant databases has to be followed.
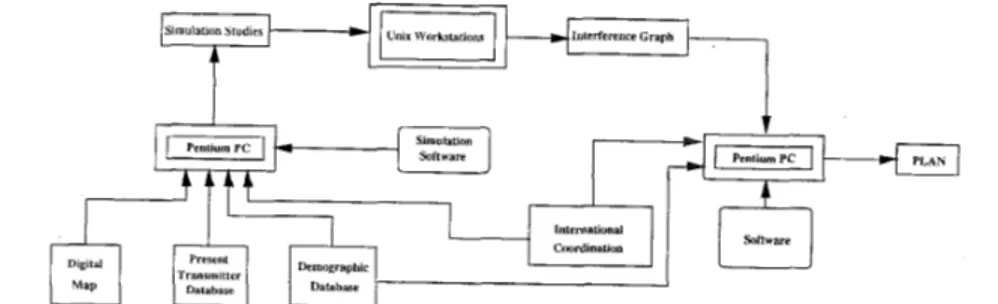
For the planning of Turkish broadcast spectrum, we have used five main computer tools and databases. The first one is a prop- agation simulation software which models the propagation enai- ronment and calculates the attenuation of the field strength over a given terrain. The second one is the geographical database of the planning region. This includes a digital terrain map of the country. The third is the demographical database. The forth is the list of all present transmitters and their electronic and geo- graphical parameters. The last one is the international rules and agreements concerning the region. All of these tools are either acquired or produced and they have been properly integrated t o have an optimum frequency allocation.
Publisher Item Identifier: S 0018-9316(96)07166-1
The main purpose is to maximize the interference free cover- age area for each transmitter. To this end, for each transmitter propagation simulation studies are obtained. From these studies, channel assignment can be done by considering the international coordination agreements. However, for TV broadcasts a better option is to use frequency offsets to get the maximum number of available channels. This is done using a Simulated Annealing algorithm. In [l], the Simulated Annealing algorithm is used for the efficient frequency assignment, but for a different problem. The flowchart of the approach is summarized in Fig.(l).
In addition to the channel assignment plan, the population in the coverage area and the services provided to any town in the country is determined. This information is used for the licencing fees to be charged to the stations and also for the classification of broadcasters into the national, regional, or local categories.
Tools
of Planning.
The necessary ingredient of a computer aided frequency plan- ning is the prediction of field strength variation over the terrain due to a given transmitter. This requires a propagation simula- tion software which utilizes the topography of the terrain. For- tunately, different commercial software from various sources are aT-ailable for this purpose. The next step is to decide on the propagation models to be used. At present, a number of differ- ent propagation models are available and the comparative ad- vantages of these models are still under investigation
[a].
The most widely known models are prepared by the CCIR of ITU[3] and the FCC of US Government (part 73, broadcast). These models are based on intensive experimental measurements in the
VHF
and UHF bands. The terrain effect on the propagation is included in these models only statistically. The actual topografic structure may cause strong reflections and diffractions which can also be added to these models. For the coverage area studies, weFigure 1. T h e f l o w c h a r t of t h e frequency p l a n n i n g .
145
Figuire 2.
Coilerage
area contour plot of
the Camlzca (Istanbul) station
in
the
VHF.
have x c e p t e d and used such a model based on FCC measure- ments and augmented by reflection and diffraction contributions of the terrain. As is well known, C U R attenuation curves begin at 10 km. away from the transmitter, making it unsuitable for coverage estimates. We have made some measuments in Ankara and in Istanbul, and the measured Keld strengths were within 10 dB of the computer generated data (obtained through the adopted propagation model.
Around the transmitter, we can. define an area, in which the field strength is strong enough to give a satisfactory grade of sound or picture quality. We can call this area as “the coverage area”. Similarly, “co-channel and adjacent channel interference areas” are defined such that in these areas either the same or the adjacent channels may not be used by any other transmitter. To
he able to transmit the same or adjacent channels, the relevant protection ratios between the desired and undesired (interference) field strengths have t o be satisfied. These protection ratios are listed in the EBU [4]-[5] publications. A sample T V coverage area contour plot is given in Fig.(2) for a T V transmission station in the VHF band in Istanbul. A better insight is gained through a gray scale plotting of the field strength around the transmitter. Fig.(3) shows such a plot for the same station around Istanbul. Here it is easier to identify the effect of the topography on the field strength distributions. It is noted that the field strength values are calculated over radial lines centered at the transmitter location. This analysis is valid when the reflection and diffrac- tions from the vertical discontinuities are small. Fortunately, most natural topographic boundaries are not vertical as opposed to man made buildings. So, the limitation t o radial lines (2-D) is expected to work well especially outside highly populated urban areas [6].
The next step is to decide the transmitter locations, transmit- ter powers and antenna characteristics. In practice, this is usually done by the demand of the public. Therefore, the coverage starts from densely to sparse1,y populated areas. The same logic is ap- plied here and the aim is set to cover all cities and towns over a threshold population. Also, all the information about the trans-
mitter locations of the existing broadcasters are collected into a database, and this database is consulted whenever necessary for the proper selection of the transmitter locations. Transmitter powers are set according to the intended viewer population.
Processing of
Study Files
After the specification of the transmitter, the results of elec- tromagnetic field simulations are obtained as study files, which contain field strengths as dB
pV/m,
over radial lines centered at the transmitting locations. For T V planning, simulations are performed a t frequencies that are chosen as representatives for each band. Angular and radial resolution of these study files vary for different transmitting sites depending on demographic requirements. Performing the electromagnetic simulation studies with the terrain information is the most time consuming part of the planning.It must be noted that it is sufficient to obtain these study files for one tra.nsmission power only. For powers other than the simulated value, the field strengths are easily computed as
A F = A P (1)
where A P , and A F stand for dB changes in the transmission power and the field strengths, respectively. The simulations are performed using omnidirectional antennas, and angular depen- dences of the emitted R F power from the actual planned antennas are easily incorporated similarly.
In storing these study files, field strengths a t the simulation points are hardlimited between the values -128 and +127 dB, and quantized to integers, so that they can be stored in byte sized variables. The large number of transmitter sites makes such a data reduction necessary. Using these files, the field strengths at arbitrary coordinates are obtained by interpolation.
In this project about 1000 TV transmitting sites are planned, whose study files required a storage space of approximately 0.6
146
Figure
3.
Gray
s c d eplotting
ofth,e
field
strength around
Camlzca
(Istanbul) station
in the VHF. Geographical land-sea borders and
the
metropolitan area are s h o w n
by
white contours. For illustration purposes increasing levels
of
ERP is
shown by
alter-
nu,ting black and white
colors.
Gigabytes after such a reduction described above.
Interference
Graph
The interference graph G ( a ) for a given protection ratio (Y is a
connectivity graph of transmitters over a region. Two transmit- ters on this graph are connected if one of them broadcasts strong enough signals to cause interference in the coverage area of the other. This connection is called an edge. The direction of the edge is from the interferer to the interfered transmitter. Fig.(4) illustrates the determination of the existence of an edge between the two transmitters i and j . Let the coverage area of transmit- ter j is the elliptic region enclosed by the solid elliptic curve. Let the capital letters A , B, ... denote populated sites [sites with a population over a minimum) in this coverage area. Let Fi(2A) de- note the field strength in decibels, at a populated site A located at world coordina.te ? A , that is caused by the ith transmitter. An edge
Ei,
from node i to node j is introduced if transmitter i interferes with transmitter j . So, an edge Eij indicates that there exist a t least one populated point 5 p(P
= A, B, ...) in the coverage area of the jth transmitter such thatwhere cv is the protection ratio and 6, is related to the quality of the signal received by a receiver located at site A. Hence, if (Y is
the co-channel protection ratio and in the interferencegraph G ( a ) there is an edge between two nodes, the same channel should not be used on these two nodes. Significance of a world coordinate
Z
is det.ermined by using demographic information about that point, e.g. the population around that point, the proximity of that point to a road, lake, or a military area etc.. Mountain tops are the points that interference occurs most likely. Fortunately,they usually are not demographically critical. The interference graph is generated for various protection ratios using the study files and a demographic database of Turkey.
Repeating the same channel is highly desirable for efficient utilization of the spectmm. For TV broadca.sts, it is possible to lower the eo-channel protection ratio and reduce the number of edges in the interference graph by using frequency offset between transmitters. For practical reasons, three nonprecision offset val- ues ( S M , 0, 8P) are used. If different offsets can be assigned to two different transmitting sites, the co-channel protection ratio drops by 12 dB.
Using the study files, the interference graph is generated for two values of co-channel protection ratio a1, a 2 , corresponding
to co-channel protection values with and without offsets, respec- tively. Naturally cyI
<
cu2, and, if there exists an edge Eij in G ( a l ) the same edge exists also in G ( a Z ) , but the converse does not necessarily hold. Let I denote the set of edges that exist in G(cu2) but not in G(a1). After assigning offsets to transmit- ters, the resultant interference graph6
is formed by adding edges E,, EE
to G(cYI) under the condition that the same offset is as- signed to zth and jth transmitters. Let M ( 6 ) define the total number of edges in graphg.
The offsets must be assigned such thatM ( G )
is as small as possible. There are also some con- straints in assigning offsets to transmitters. These constraints are determined by rights and restrictions that are specified by in- ternational agreements (Stockholm 1961) and by specifications of some of the transmitters that are already operational in Turkey.The task of minimizing
M ( 6 )
under the above mentioned constraints by assigning offsets to transmitters is a combinatorial optimization problem. This problem belongs to the class of NP-complete problems and there is no known algorithm that can find the exact minimizing offset combination for 1000 transmitters in
147 likely for the algorithm t o accept a configuration that increases the cost. The process of decreasing T over iterations is called "cooling schedule" in the Simulated anealing terminology. De- creasing the temperature too fast may give rise the algorithm to be stuck a t a local minimum that is too far from the absolute minimum. The algorithm on the other hand takes a long time if the temperature is decreased too slowly.
Various methods are proposed in the literature for determin- ing the initial value of T and the cooling schedule [8]. Simulated Annealing takes a reasonable amount of time (a few minutes com- pared to several hours for finding G ( a ) and weeks to complete the electromagnetic simulations in a Sparc 20). Hence, the easiest way of determining the cooling schedule and the initialvalue of T is trial and error, and monitoring the value of the cost function versus T over the iterations. The algorithm eventually reaches a statistical steady state if the iterations are performed at a fixed T . A good idea is to decrease the temperature just before the statistical steady state is reached. If the temperature is decreased sufficiently slowly then the final cost should be very close to the minimum cost that occurs until then, and different runs with the same cooling schedule should result in very close optimal values as the solution.
i
Figure
4.T h e Interference graph G ( a ) which
i sused
t o determine
the e:cistence of a n edge between
two
trunsmtters
i
and
j .
a reasonable time. Observe that the total search space consists of 3"" combinations. Simulated Annealing is employed for finding acceptable solutions to this problem. There is a vast amount of literature on the method of Simulated Annealing [7], so we suffice to present its application to the offset assignment problem.
Offset Assignment by Using
Simulated Annealing.
Initially, a random (offset combination which complies with the constraints is generated and M ( G ) is evaluated. Then the following steps are repeated for a gradually decreaslng parameter T(temperature) until it reaches a final predetermined value.
i) Choose a transmitter randomly and generate a random off set value for that transmitter that complies with the con- straints.
11) Compute the change in cost function
AM(6)
= M ( B n e w ) - M(Bold). ( 3 ) iii) Accept the new configuration with the probability P com-puted as
The above algorithm generates a sequence of configurations with statistically decreasing costs.
Observe that during iterations .a new configuration is imme- diately accepted if it decreases the cost, otherwise it is acceptcd with a probability that 'decreases exponentially by an increase in the cost. It is this nonzero probability that enables the algorithm to escape from the local minima. As T decreases, it becomes less
The final (nearly optimal) offset assignment yields the desired interference graph with minimal number of edges. The resultant interference graph is then passed to another program that assigns channels to transmitting sites.
Channel Assignment For
Transmitters
A
program has been developed for channel assignment for all transmitters in a network. This program uses three differ- ent kinds of input data. One of them is the interference graph. The second type of data fed t o the program is a list of forbidden channels for each transmitter. Due to the international agree ments like Stockholm 1961 Plan, some channels cannot be used in the transmitters throughout the border area of a country. For this reason, the program assigns channels from a set of allowed channels to each transmitter. The third type of data used by the program is the demographic database including the population of cities, towns, and villages. By means of this database, the pro- gram assigns more channels to those transmitters whose coverage area includes bigger population.Using these input data, firstly, the program tries to assign a minimumnumher of channels to every transmitter in the network. This minimum number of channel is given by the user. Then, the program starts to assign additional channels to each transmitter by increasing the number of channels one by one. At this point, if there are several alternatives, a new channel is assigned to that transmitter whose coverage area has the biggest population.
Generated Outputs
The frequency plan i s a list of transmitter sites with geo- graphic and technical properties. The geographical properties consist of the coordinates, the height above the sea level, and the antenna height. The technical properties consist of the transmit-
148
ler power, maximum effective radiated power in all directions. assigned frequency, polarization, offset, and the vertical tilt an- gle. For Ihe Turkish T V network, a total of 21 652 frequencies at 880 transmitter sites are listed. For the FM Radio network, a total of 30629 frequencies at 800 transmitter sites are listed.
In addition to the plan, two databases are generated for li- censing purposes. In the first one, for each transmitting station a list of places down t o smallest inhabited districts in the coverage area are given together with total population. For each provincial district, a list of transmitting stations and channels that can be viewed are listed in the second one. Various statistics like average number of channels per transmitting site that can be viewed, etc. can be extracted from those databases.
Conclusions
A computer aided frequency planning is presented for the
VHF and UHF broadcasts. The approach has utilized the Sim- ulated Annealing algorithm for the optimization of number of broadcast channels. It is seen that, this has resulted in a very fast and efficient way of channel assignment. The approach can be generalized to similar mobile and fixed networks.
* * *
Par1 of this paper has been presented in NATO-AGARD Meeting, ‘Digital Communications Systems: propagation eflects, technical solutions, systems design”, Sept.1995, Athens, Greece.
References
A. Quellmalz, A. Knallmann, B. Muller, “Efficient Freq- uency Assignment with Simulated Annealing”
IEE ICAP’95, Eindhoven, The Netherlands, 4-7 April 1995.
R. Grosskopf, “Comparison of Field-Strength Prediction Methods in UHF Range”, EBU Review-Technical, No.229,
June 1988.
“VHF and UHF propagation curves for the frequency range from 30 t o 1000 MHz - Broadcasting services”, CCIR Recommmendation 370-5, Vo1.5, XVIth Plenary As- sembly, Dubrovnik 1986.
“VHF/FM planning parameters and methods”, Tech.3236- -
E, European Broadcasting Union, Technical Centre, Brus-
seis, July 1982.
“Planning parameters and methods for terrestrial television broadcasting in the VHF/UHF bands”, Tech.3254-E, Euro- pean Broadcasting Union, Technical Centre, Brussels, May 1988.
R. Grosskopf, “Prediction of Urban Propagation Loss”, IEEE Trans. Antennas and Propagation, Vo1.42, No.5, May 1994.
E.H.L. Aarts, and P.J.M. van Laarhoven, Simulated Annealing: Theory and Applications, Reidel, Dordrecht, 1987.
[8] B. Hajek, ‘Tooling Schedules for Optimal Annealing”, Mathematics of Operations Research, Vo1.13, 1988.