REPORT
Utilizing Ethnic-Specific Differences
in Minor Allele Frequency to Recategorize
Reported Pathogenic Deafness Variants
A. Eliot Shearer,1 Robert W. Eppsteiner,1,18 Kevin T. Booth,1,18 Sean S. Ephraim,2,18 Jose´ Gurrola, II,1
Allen Simpson,1 E. Ann Black-Ziegelbein,1Swati Joshi,3 Harini Ravi,3 Angelica C. Giuffre,3 Scott Happe,3
Michael S. Hildebrand,4 Hela Azaiez,1 Yildirim A. Bayazit,5 Mehmet Emin Erdal,6
Jose A. Lopez-Escamez,7 Irene Gazquez,7 Marta L. Tamayo,8 Nancy Y. Gelvez,8 Greizy Lopez Leal,8
Chaim Jalas,9 Josef Ekstein,10 Tao Yang,11 Shin-ichi Usami,12 Kimia Kahrizi,13 Niloofar Bazazzadegan,13
Hossein Najmabadi,13 Todd E. Scheetz,2,14,15 Terry A. Braun,2,14,15 Thomas L. Casavant,2,14,15
Emily M. LeProust,3,19 and Richard J.H. Smith1,16,17,*
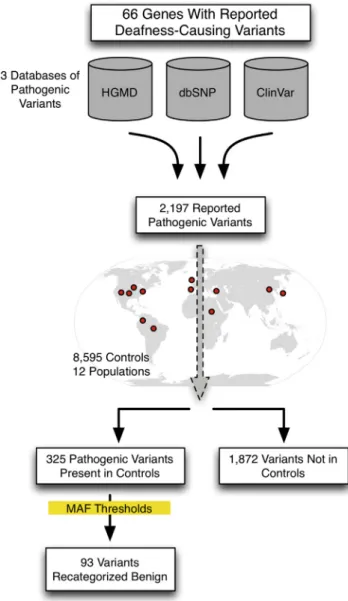
Ethnic-specific differences in minor allele frequency impact variant categorization for genetic screening of nonsyndromic hearing loss (NSHL) and other genetic disorders. We sought to evaluate all previously reported pathogenic NSHL variants in the context of a large number of controls from ethnically distinct populations sequenced with orthogonal massively parallel sequencing methods. We used HGMD, ClinVar, and dbSNP to generate a comprehensive list of reported pathogenic NSHL variants and re-evaluated these variants in the context of 8,595 individuals from 12 populations and 6 ethnically distinct major human evolutionary phylogenetic groups from three sources (Exome Variant Server, 1000 Genomes project, and a control set of individuals created for this study, the OtoDB). Of the 2,197 reported pathogenic deafness variants, 325 (14.8%) were present in at least one of the 8,595 controls, indicating a minor allele frequency (MAF)>0.00006. MAFs ranged as high as 0.72, a level incompatible with pathogenicity for a fully penetrant disease like NSHL. Based on these data, we established MAF thresholds of 0.005 for autosomal-recessive variants (excluding specific variants in GJB2) and 0.0005 for autosomal-dominant variants. Using these thresholds, we recategorized 93 (4.2%) of reported pathogenic variants as benign. Our data show that evaluation of reported pathogenic deafness variants using variant MAFs from multiple distinct ethnicities and sequenced by orthogonal methods provides a powerful filter for determining pathogenicity. The proposed MAF thresholds will facil-itate clinical interpretation of variants identified in genetic testing for NSHL. All data are publicly available to facilfacil-itate interpretation of genetic variants causing deafness.
The advent of massively parallel sequencing has shifted the bottleneck in human genetics from data acquisition to variant interpretation. Accurate evaluation of genetic variants for pathogenicity is crucial to advance our under-standing of disease processes and is a requirement for clinical diagnostics. Whole-exome sequencing and tar-geted gene panels based on tartar-geted genomic enrichment and massively parallel sequencing are becoming common-place and for some Mendelian diseases, including breast and ovarian cancer, degenerative eye disease, and hearing loss, they have become the ideal test and are now used routinely for clinical diagnostic testing.1–3These tests regu-larly produce hundreds or thousands of variants that
require categorization and interpretation to assess their likelihood of causing disease. Correct interpretation is crucial when test results are used to direct clinical care.
Hearing loss (HL) is the most common sensory deficit in humans, affecting 1 in 500 children4and 360 million peo-ple worldwide (World Health Organization Deafness Esti-mate Online Report). The majority of HL is genetic and nonsyndromic (NSHL, not associated with other clinical phenotypes). Genetic diagnosis for NSHL is particularly challenging given limited phenotypic variability and extreme genetic heterogeneity; increased use of massively parallel sequencing resulting in thousands of variants identified per individual has highlighted these challenges.
1Molecular Otolaryngology & Renal Research Labs, Department of Otolaryngology—Head and Neck Surgery, University of Iowa Carver College of Medicine, Iowa City, IA 52242, USA;2Department of Biomedical Engineering, University of Iowa, Iowa City, IA 52242, USA;3Agilent Technologies, Cedar Creek, TX 78612, USA;4Epilepsy Research Centre, Department of Medicine, University of Melbourne, Heidelberg, VIC 3084, Australia;5Department of Otolaryngology, Faculty of Medicine, Medipol University, Istanbul 34083, Turkey;6Department of Medical Biology and Genetics, University of Mersin, Mersin 33160, Turkey;7Otology and Neurotology Group CTS495, Center for Genomic and Oncological Research (GENyO), Granada 18012, Spain;8 Insti-tuto de Gene´tica Humana, Pontificia Universidad Javeriana, Bogota´ 11001000, Colombia;9Bonei Olam, Center for Rare Jewish Genetic Disorders, Brooklyn, NY 11204, USA;10Dor Yeshorim, The Committee for Prevention of Jewish Genetic Diseases, Brooklyn, NY 11211, USA;11Department of Otorhinolaryn-gology—Head and Neck Surgery, Xinhua Hospital, and the Ear Institute, Shanghai Jiaotong University School of Medicine, Shanghai 20025, China; 12
Department of Otorhinolaryngology, School of Medicine, Shinshu University, Matsumoto, Nagano 390-8621, Japan;13Genetics Research Centre, University of Social Welfare and Rehabilitation Sciences, Tehran 1985713834, Iran;14Center for Bioinformatics and Computational Biology, University of Iowa, Iowa City, IA 52242, USA;15Department of Ophthalmology and Visual Sciences, University of Iowa, Iowa City, IA 52242, USA;16Interdepartmental PhD Program in Genetics, University of Iowa, Iowa City, IA 52242, USA;17Department of Molecular Physiology & Biophysics, University of Iowa Carver College of Medicine, Iowa City, IA 52242, USA
18These authors contributed equally to this work
19Present address: Twist Biosciences, San Francisco, CA 94158, USA *Correspondence:[email protected]
To date more than 70 genes and more than 2,000 causal variants have been implicated in NSHL. As with other genetic diseases, the vast majority of reported pathogenic NSHL variants were so designated based on five primary criteria: (1) cosegregation with the phenotype ideally with linkage analysis, (2) absence in 200 or more control chromosomes from the same ethnicity, (3) conservation of the affected nucleotide or amino acid through evolu-tion, (4) predicted functional effect of the mutaevolu-tion, and (5) corroborative in vitro or in vivo functional data.
Absent, however, has been a sixth criterion—one that would require assessment of the variant in the context of a large number (thousands) of controls from varying eth-nicities. This omission is noteworthy because the majority of human genetic variation is accounted for by ethnicity-specific differences.5,6Our group and others have hypoth-esized that evaluation of variants in this context can reduce or eliminate false positives. Massively parallel sequencing techniques have for the first time delivered
the ability to sequence a heretofore-unobtainable number of control individuals from different ethnicities with data freely available to the scientific community.
In the first application of a large amount of control data to evaluate a human genetic disease, Norton et al. pro-posed a disease-specific iterative approach: use a large number of controls to determine the minor allele fre-quency (MAF) of known pathogenic variants and thereby determine a MAF cut-off that can be used for evaluation of future variants.7The authors used data from the Exome Variant Server (EVS), which includes two ethnically distinct populations, to resolve false positives. Another recent study disqualified ten reported X-linked disability genes using similar methods and data from the EVS.8 Most recently, a gene with variants reported to cause NSHL, MYO1A (MIM 601478), has been disqualified through the use of EVS and lack of cosegregation of previ-ously reported pathogenic variants in this gene.9
Incorrect classification of genetic variants as pathogenic is not limited to only one or a few genetic diseases—it is a systemic issue in human genetics. Cassa et al. evaluated all of the mutations present in the Human Gene Mutation Database (HGMD), the most comprehensive repository of pathogenic human mutations, in the context of control data from the 1000 Genomes Project.10The authors found that 3.5% of variants present in HGMD have a MAF> 0.05, which is implausible for a highly penetrant Mendelian disease.
Our goal in this study was to evaluate all reported path-ogenic deafness variants in the context of a large number of controls from multiple ethnicities in order to recatego-rize any clearly benign variants based on MAF in controls and establish MAF thresholds to aid interpretation of vari-ants discovered in the future (Figure 1).
We sought to evaluate pathogenic variants present in 66 genes with variants reported to cause NSHL and NSHL-mimic syndromes (genetic causes of syndromic hearing loss that mimic NSHL at presentation such as Usher syndrome, the most common cause of deaf-blind-ness; see Table S1 [available online] for a complete gene list). Reported pathogenic deafness variants were obtained from three sources: HGMD (Professional v.2013.4), NCBI ClinVar, and dbSNP v.138 (the latter publically available databases were accessed in February 2014). When neces-sary, variants were converted to HGVS nomenclature using Mutalyzer to generate genomic coordinates.11 The final comprehensive list of reported pathogenic deafness vari-ants included all varivari-ants categorized as fully penetrant pathogenic or probable-pathogenic in any of the databases (DM or DM? in the case of HGMD).
In total, we obtained 2,197 variants designated as path-ogenic or probable-pathpath-ogenic by any of three databases. As shown in Figure S1, the majority of these variants were identified in HGMD alone (1,572; 71.6%), seven were unique to ClinVar, and none were unique to dbSNP. The three databases shared 454 (20.7%) of the reported pathogenic variants.
There was disagreement between databases in the cate-gorization of 96 variants. All differences were between HGMD and the other two databases, ClinVar and dbSNP, which agreed in all cases. HGMD categorized 87 variants pathogenic while the other two databases categorized the same variants as pathogenic (41), probable-nonpathogenic (20), or probable-nonpathogenic (26). HGMD cate-gorized 9 variants as probable-pathogenic while the other two databases categorized these variants as pathogenic.
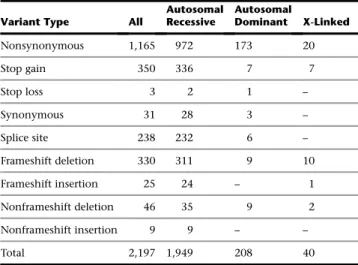
Of the 2,197 reported pathogenic deafness variants, 1,165 were nonsynonymous, 350 were stop gain, 330 were frameshift deletions, 238 were splice site mutations, 46 were non-frameshift deletions, 31 were synonymous, 25 were frameshift insertions, 9 were nonframeshift inser-tions, and 3 were stop loss (Table 1). When divided by the mode of inheritance, there were 1,949 autosomal-reces-sive, 208 autosomal-dominant, and 40 X-linked recessive pathogenic variants.
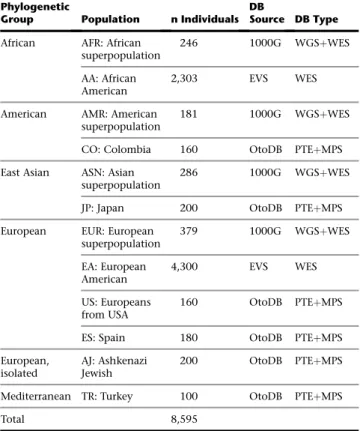
In total, we ascertained 8,595 control individuals from 12 populations and 6 major phylogenetic groups of human evolutionary history using three orthogonal massively parallel sequencing methods. The populations ranged in size from 100 to 4,300 individuals (Table 2). Con-trol data were obtained from three sources: (1) the NHLBI Go Exome Sequencing Project (ESP), made available on the Exome Variant Server (EVS) version ESP6500SI-V2 ac-cessed 2/2014, (2) the 1000 Genomes Project (1000G) release 1000GApr2012, and (3) the OtoDB, the OtoSCOPE Control Database, data from 1,000 normal hearing con-trols from six populations, which we generated for this project by pooled targeted genomic enrichment (methods described in detail below). A summary of the controls used in this study is provided inTable 2.
The EVS database includes 6,503 individuals from two populations—4,300 European Americans (EA) and 2,203 African Americans (AA)—and was established to study in-dividuals on the extremes of cardiovascular phenotypes as well as control individuals. Whole-exome sequencing
(WES) was performed on these samples with a target average coverage>803. Coverage statistics for the genes targeted in this study were calculated using BED files pro-vided by the ESP.
The 1000G database includes 1,092 individuals from 4 superpopulations (large populations comprised of several subpopulations, generally from the same geographic region and shown to be closely related in evolutionary history): 246 samples from the African superpopulation (AFR), 181 samples from the American superpopulation (AMR), 286 in-dividuals from the Asian superpopulation (ASN), and 379 individuals from the European superpopulation (EUR). Variant calls were obtained from a combination of WES and low-coverage whole-genome sequencing (WGSþWES). Coverage statistics for genes targeted in this study were calculated from BAM files for ten individuals.
The OtoDB includes 1,000 normal-hearing individuals from six populations sequenced using pooled targeted genomic enrichment and massively parallel sequencing (PTEþMPS). The populations included (1) 200 Ashkenazi Jews living in New York (AJ), (2) 160 Colombians origi-nating from different cities around the country including Bogota´ and the central region, the Atlantic coast, and the north, west, and southwest regions of the country (CO), (3) 200 Japanese students attending Shinshu University in Matsumoto (JP), (4) 160 European Americans from Iowa, USA (US), (5) 180 Spanish from Almerı´a and Granada (ES), and (6) 100 Turks, primarily from the Southern and Mediterranean Sea regions (TR). All samples were from in-dividuals with no self-reported hearing loss, and in the case of Japanese samples, subjects had audiometric testing showing no evidence of hearing loss. Individuals from the EVS and 1000G databases, in contrast, were not evalu-ated for hearing loss and therefore are not true ‘‘controls’’ but rather representative cross-sections of their derivative populations. Human ethics and institutional review board (IRB) policies were followed at each institution where samples were collected and informed consent was ob-tained. All methods were approved by the IRB at the University of Iowa.
To sequence the 1,000 OtoDB controls, we used a pooled targeted genomic enrichment method that entailed gener-ating 50 pools, each of which included 20 DNA samples (40 alleles per pool). We then performed targeted genomic enrichment and massively parallel sequencing as described using automation equipment.3We captured the exonic re-gions of 66 genes with variants causing NSHL, targeting in total 1,344 regions and 521,647 bp of the genome (Table S1). Molecular barcodes were added to each pool of 20 DNA samples. Five pools were then multiplexed and sequenced in a single flow-cell of the Illumina HiSeq using 100 bp paired-end reads (100 samples per flow-cell). We sought to generate a sequencing depth-of-coverage suffi-cient for variant calling for each allele present in the pool for all targeted regions (103 per sample or 2003 per pool). We analyzed the pooled data sets using a local installation of the open-source Galaxy software12 and the following
Table 1. Previously Reported Pathogenic Deafness-Causing Variants
Variant Type All
Autosomal Recessive Autosomal Dominant X-Linked Nonsynonymous 1,165 972 173 20 Stop gain 350 336 7 7 Stop loss 3 2 1 – Synonymous 31 28 3 – Splice site 238 232 6 – Frameshift deletion 330 311 9 10 Frameshift insertion 25 24 – 1 Nonframeshift deletion 46 35 9 2 Nonframeshift insertion 9 9 – – Total 2,197 1,949 208 40
steps: read mapping with Burrows-Wheeler Alignment (BWA),13 duplicate removal with Picard, local realign-ment with GATK,14and variant calling with SAMtools.15 Coverage statistics were calculated with BEDTools.16 Vari-ant frequency in each pool was assigned using vipR, a pre-viously validated method that accurately calls variants in pooled data sets using skellam distributions.17We ran vipR using default parameters except we enabled indel call-ing. Annotation of identified variants was performed with ANNOVAR.18
For the pooled OtoDB control set, the average pool depth of coverage was 7,846 for an average inferred per-sample depth of coverage of 3923. To validate pooled sequencing and the vipR analysis method, we used Sanger sequencing and genotyped 12 single-nucleotide changes in 100 persons comprising 5 pools including 7 variants showing the minimum frequency in the pool (1 allele in 40, frequency of 0.025). We found a sensitivity of 0.971 and specificity of 0.989 when using Sanger sequencing as the gold standard (Table S2).
As expected, coverage statistics for the 66 targeted NSHL genes varied by data source due to the different sequencing methods used (Table S3). Because coding variants comprise the majority of pathogenic mutations, we focused on exons and found thatR13 exonic coverage of these genes was 68.9%, 82.6%, and 99.8% with EVS, 1000 Genomes,
and OtoDB, respectively. When restricted to coding exons only,R13 coverage was 88.7%, 93.8%, and 99.4% (Table S3). Average overall coding depth of coverage was 246, 90, and 475 for EVS, 1000 Genomes, and OtoDB, respec-tively. These data provided the source for annotation of the identified pathogenic variants.
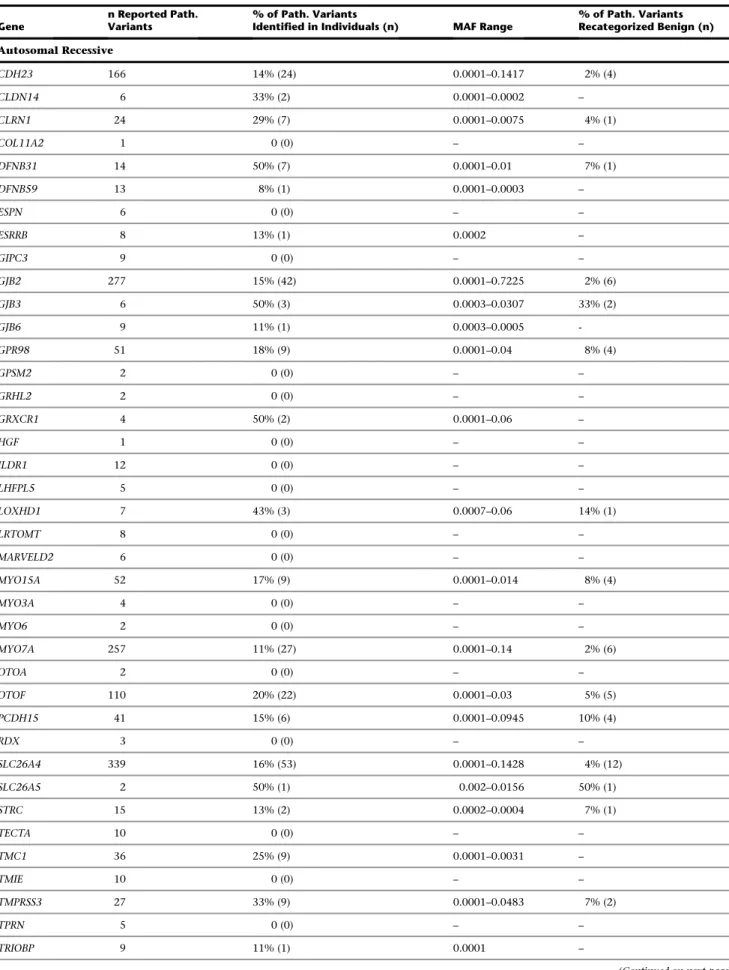
Of the 2,197 pathogenic variants obtained from the three databases, we found 325 variants (14.8%) in controls. Fifty-seven of these variants (17.5%) were present in all three databases (Figure S2). By inheritance pattern, 296 and 29 pathogenic variants were associated with auto-somal-recessive and autosomal-dominant NSHL, respec-tively. There were no reported X-linked NSHL variants in controls. In aggregate, of the 42 autosomal-recessive and 20 autosomal-dominant NSHL genes we screened, 24 recessive and 9 dominant genes contained pathogenic var-iants in controls (Table 3).
As shown inTable 3, the proportion of pathogenic vari-ants in controls varied by gene and was highest at 86% for MYO1A. Variants in this gene were recently discounted as causing autosomal-dominant NSHL.9Other genes with a high proportion of pathogenic variants found in controls include 50% for DFNB31 (MIM 607084), GJB3 (MIM
603324), GRXCR1 (MIM 613283), SLC26A5 (MIM
604943), and DIAPH1 (MIM 602121). The minor allele fre-quencies (MAF) for these variants ranged from the limit of detection, which was 0.00006, to 0.72 for GJB2 (MIM 121011; RefSeq accession number NM_004004; c.79G>A [p.Val27Ile]) in the Japanese population of OtoDB, a variant that is commonly considered nonpathogenic but is labeled as probable-nonpathogenic by ClinVar and dbSNP and probable-pathogenic by HGMD. We noted that several variants had MAF levels implausible for a fully penetrant Mendelian disease like deafness.
The remaining 1,872 variants (85.2%) were not identi-fied in the 8,595 controls consistent with extreme rarity (<1/17,190 alleles or a MAF < 0.00006) and indicating an increased likelihood of pathogenicity. The distribution of pathogenic variants by MAF is shown in Figure 2. We evaluated variants using the maximum MAF (Max MAF), the highest MAF in any one of the 12 populations studied. Detailed data for each variant including MAF per popula-tion are provided online in full at the Deafness Variapopula-tion Database (seeWeb Resourcessection).
Based on these data, we sought to identify appropriate MAF cut-offs for autosomal-recessive and autosomal-domi-nant NSHL. For severe-to-profound autosomal-recessive congenital NSHL, there are a wealth of data showing that the most common genetic cause in most world popula-tions are mutapopula-tions in GJB2, with specific variants like c.35delG and c.167delT having exceptionally high fre-quencies in the European and Jewish populations, respec-tively. The aggregate GJB2 mutation carrier frequency in these populations is typically 1%–2%.
We used these data to create an empirically based cut-off for autosomal-recessive NSHL by first positing a MAF of 0.01 for any autosomal-recessive NSHL-causing variant in
Table 2. Populations Used in This Study Phylogenetic
Group Population n Individuals
DB
Source DB Type
African AFR: African
superpopulation
246 1000G WGSþWES
AA: African American
2,303 EVS WES
American AMR: American
superpopulation
181 1000G WGSþWES
CO: Colombia 160 OtoDB PTEþMPS
East Asian ASN: Asian superpopulation
286 1000G WGSþWES
JP: Japan 200 OtoDB PTEþMPS
European EUR: European
superpopulation 379 1000G WGSþWES EA: European American 4,300 EVS WES US: Europeans from USA 160 OtoDB PTEþMPS
ES: Spain 180 OtoDB PTEþMPS
European, isolated
AJ: Ashkenazi Jewish
200 OtoDB PTEþMPS
Mediterranean TR: Turkey 100 OtoDB PTEþMPS
Total 8,595
Abbreviations are as follows: 1000G, 1000 Genomes Project; EVS, Exome Variant Server; OtoDB, OtoSCOPE Control Database; WGS, whole-genome sequencing; WES, whole-exome sequencing; PTE, pooled targeted enrich-ment; MPS, massively parallel sequencing.
Table 3. Previously Reported Pathogenic Deafness-Causing Variants Identified in All Individuals Studied by Gene
Gene
n Reported Path. Variants
% of Path. Variants
Identified in Individuals (n) MAF Range
% of Path. Variants Recategorized Benign (n) Autosomal Recessive CDH23 166 14% (24) 0.0001–0.1417 2% (4) CLDN14 6 33% (2) 0.0001–0.0002 – CLRN1 24 29% (7) 0.0001–0.0075 4% (1) COL11A2 1 0 (0) – – DFNB31 14 50% (7) 0.0001–0.01 7% (1) DFNB59 13 8% (1) 0.0001–0.0003 – ESPN 6 0 (0) – – ESRRB 8 13% (1) 0.0002 – GIPC3 9 0 (0) – – GJB2 277 15% (42) 0.0001–0.7225 2% (6) GJB3 6 50% (3) 0.0003–0.0307 33% (2) GJB6 9 11% (1) 0.0003–0.0005 -GPR98 51 18% (9) 0.0001–0.04 8% (4) GPSM2 2 0 (0) – – GRHL2 2 0 (0) – – GRXCR1 4 50% (2) 0.0001–0.06 – HGF 1 0 (0) – – ILDR1 12 0 (0) – – LHFPL5 5 0 (0) – – LOXHD1 7 43% (3) 0.0007–0.06 14% (1) LRTOMT 8 0 (0) – – MARVELD2 6 0 (0) – – MYO15A 52 17% (9) 0.0001–0.014 8% (4) MYO3A 4 0 (0) – – MYO6 2 0 (0) – – MYO7A 257 11% (27) 0.0001–0.14 2% (6) OTOA 2 0 (0) – – OTOF 110 20% (22) 0.0001–0.03 5% (5) PCDH15 41 15% (6) 0.0001–0.0945 10% (4) RDX 3 0 (0) – – SLC26A4 339 16% (53) 0.0001–0.1428 4% (12) SLC26A5 2 50% (1) 0.002–0.0156 50% (1) STRC 15 13% (2) 0.0002–0.0004 7% (1) TECTA 10 0 (0) – – TMC1 36 25% (9) 0.0001–0.0031 – TMIE 10 0 (0) – – TMPRSS3 27 33% (9) 0.0001–0.0483 7% (2) TPRN 5 0 (0) – – TRIOBP 9 11% (1) 0.0001 –
GJB2. Our data, for example, gave a maximum MAF of 0.0108 and 0.01 for GJB2 (RefSeq NM_004004): c.35delG and c.167delT, respectively. Next, we assumed the exis-tence of a single mutation in a second gene that accounts for roughly one-quarter of all remaining recessive NSHL, a very liberal assumption given the documented genetic het-erogeneity. The MAF of this variant would be 0.005. We then hand-curated the 83 recessive NSHL variants with MAFs> 0.005 for plausibility of pathogenicity and recate-gorized 73 variants as benign (Figure 2andTable S4).
To evaluate the predicted effects of nonsynonymous changes, we used six pathogenicity prediction algori-thms derived from dbNSFP v.2.319 and annotated with ANNOVAR: SIFT, Polyphen2_HVAR, LRT, MutationTaster, MutationAssessor, and FATHMM. We used these methods to evaluate variants individually and as part of a com-posite pathogenicity score. For the comcom-posite score (path_composite), a score of 1 point was assigned for each tool indicating pathogenicity or likely pathogenicity. Because pathogenicity predictions were not available for
every variant for each tool, the sum was divided by the total number of predictions available for that variant to create a ratio from 0 to 1. We also used the MetaLR score, a radial support-vector machine (SVM) method trained with a hand-curated list of causative variants and scored using several available pathogenicity tools. MetaLR is part of the ANNOVAR suite and initial studies have shown that its performance is superior to other pathogenicity prediction tools.
To test the plausibility of this MAF threshold for auto-somal-recessive NSHL in an outbred population, we used these methods to evaluate the recessive variants we recate-gorized as benign and compared this score to the pathoge-nicity score for pathogenic variants (Figure S3andTable S5). Autosomal-recessive NSHL variants recategorized as benign had a significantly lower pathogenicity score for seven of the eight methods used including the composite score and SVM score (p< 0.05). These data support the re-categorization of these variants as benign and the MAF threshold we propose. Table 3. Continued Gene n Reported Path. Variants % of Path. Variants
Identified in Individuals (n) MAF Range
% of Path. Variants Recategorized Benign (n) USH1C 24 29% (7) 0.0001–0.06 8% (2) USH1G 9 0 (0) – – USH2A 354 13% (47) 0.0001–0.1743 5% (17) Autosomal Dominant ACTG1 11 0 (0) – – COCH 16 6% (1) 0.0001 – COL11A2 2 0 (0) – – CRYM 2 0 (0) – – DFNA5 2 0 (0) – – DIAPH1 2 50% (1) 0.0035 50% (1) DSPP 2 0 (0) – – GJB2 30 3% (1) 0.01 3% (1) GJB3 9 44% (4) 0.0001–0.02 44% (4) GJB6 3 33% (1) 0.0002–0.0006 33% (1) KCNQ4 19 0 (0) – – MYH14 6 17% (1) 0.0007–0.01 17% (1) MYH9 1 0 (0) – – MYO1A 7 86% (6) 0.0002–0.1125 57% (4) MYO6 6 0 (0) – – MYO7A 7 0 (0) – – POU4F3 7 0 (0) – – TECTA 39 18% (7) 0.0001–0.0031 10% (4) TMC1 3 0 (0) – – WFS1 34 21% (7) 0.0001–0.0232 12% (4)
Of the 177 dominant pathogenic deafness variants, 77 were present in controls. To establish a threshold for autosomal-dominant NSHL, we used a hypothesis-based method because no single mutation comprises the major-ity of autosomal-dominant NSHL in any given population. We assumed Hardy-Weinberg equilibrium as well as the following generally accepted values: 1 in 500 prevalence of NSHL, 80% genetic, 70% nonsyndromic, 20% domi-nant, and 56 dominant loci. These assumptions predict that if there is only a single pathogenic variant in a given autosomal-dominant NSHL gene, its MAF can be no higher than 1/2,000 or 0.0005. We then used this threshold to
recategorize 20 variants as benign (Table S4). Pathogenicity prediction scores were lower for 7 of 8 methods, and signif-icantly lower for 4 of 8 methods including the composite score and SVM score, again supporting this recategoriza-tion of the variants (Figure S3andTable S5).
Of the 93 variants we reclassified as benign, HGMD contained calls for all but four (89) and classified 100% of these as pathogenic or probable-pathogenic (Table S4
andFigure S4). In comparison, ClinVar and dbSNP con-tained 41 of these variants but classified only 19 (46%) as pathogenic. Our data indicate that although the HGMD database contains more variants, it is not editable by users and therefore may contain more false positives.
The importance of filtering against a large and diverse control population is illustrated by our ability to recatego-rize variants based on the populations used. Every popula-tion used in this study, regardless of size, contained variants above the MAF thresholds and therefore contributed to re-categorization of variants (Figure 3). The contribution of each population to recategorization of variants varied from 38 variants above MAF threshold for the EVS African American population to 10 variants above MAF threshold for the OtoDB Japanese population (Figure 3). In addition, the number of unique variants above MAF varied from 0 to 5, with all populations but one (OtoDB_JP) contributing at least one unique ethnicity-specific variant above the set MAF threshold (Figure 3). The size of the control popula-tion did not correlate with the number of variants above MAF threshold (r2¼ 0.15).
Of the 93 recategorized variants in this study, only 26% would have been found to be above the proposed thresh-olds when using a single population database—EVS Euro-pean Americans, which contains 4,300 individuals, the highest number of any database used in this study. How-ever, by including other individuals of European descent sequenced with the other two orthogonal platforms (1000G EUR and OtoDB ES and US), 44% of the variants rose above the cut-offs, reflecting differences in coverage metrics and platform-specific weaknesses. As we added in-dividuals from other ethnicities, we further improved our ability to detect and therefore recategorize variants from 52% (after addition of Turkish and Ashkenazi Jewish OtoDB individuals) to 64% after addition of Asian individ-uals (1000G ASN and OtoDB JP) to 73% after addition of American individuals (1000G AMR and OtoDB CO) and finally to 100% after addition of African individuals (EVS AA, 1000G AFR). These data support the need to generate multiple ethnically discrete population databases on a va-riety of different platforms and indicate that it may be more important to have a large number of populations from disparate ethnicities sequenced with orthogonal plat-forms rather than a few populations of enormous size.
Interpretation of genetic variants is of primary concern for clinical diagnosis and human genetics research, and the MAF thresholds we propose—0.005 and 0.0005 MAF for autosomal-recessive and autosomal-dominant NSHL variants, respectively—provide thresholds for interpreting
Figure 2. Distribution of Pathogenic Variants by Maximum Minor Allele Frequency in 12 Populations
Autosomal-recessive (A) and autosomal-dominant (B) variants. Dashed red line indicates MAF cut-offs for each inheritance mode. Asterisk (*) indicates that the count extends beyond the axis.
newly identified variants. Although these thresholds are conservative, in clinical testing each variant should be in-terpreted in the context of the phenotype and family his-tory and with knowledge of the contribution of specific deafness-causing variants to disease in the particular popu-lation being studied.
Our study confirms the findings recently disqualifying variants in MYO1A as a cause of deafness,9as four of the seven variants (57%) in MYO1A exceeded the MAF cut-off we propose for autosomal-dominant NSHL and two more fall immediately below this cut-off. MYO1A had more variants recategorized as benign than any other gene with variants reported to cause NSHL (Table 3). Our data also suggest that particular attention should be paid to two other genes with variants reported to cause NSHL that we believe are questionable, namely GJB320 and SLC26A5.21 These genes should be evaluated further to determine whether variants in these genes truly cause fully penetrant deafness.
This study has two important limitations. First, CNVs were not included, and as we recently showed, their contri-bution to NSHL is significant.22A better understanding of the pathogenicity of CNVs is needed. However, a large number of controls must be analyzed using a reliable and sensitive method to detect CNVs before this question can be answered. Second, we did not ascertain all possible pathogenic NSHL-causing variants. Although we did attempt to collate a comprehensive list of reported patho-genic deafness variants, invariably some variants have been missed. For example, in the case of the Leiden-Open Variant Database (LOVD), we could not reliably retrieve variants in bulk from this database. This limitation underscores the importance of standardizing the recording of genetic data and making it freely accessible to improve clinical care and research.
Ideally, each variant identified by genetic testing should be evaluated in the context of the ethnic-specific preva-lence of NSHL in the derivative population and also the variant-specific MAF in a large number of ethnically diverse populations. This study represents an important
step toward this goal but it is beyond the scope of this pa-per to provide prevalence data for NSHL in the different populations we studied. Although 1,872 variants (85.2%) were not identified in the populations we studied, support-ing their role in human deafness, we cannot unequivocally ensure their pathogenicity as they could be present at high MAF in populations we have not queried.
In conclusion, our results validate the use of multiple platforms and multiple ethnicities in filtering and ascribing significance to genetic variants associated with NSHL. We recategorized 93 previously reported pathogenic deafness variants as benign. The MAF thresholds we propose will facilitate the interpretation of newly discovered variants in the context of NSHL. To further this goal, all data pre-sented here are provided in the Deafness Variation Data-base (seeWeb Resources), a freely available and regularly updated database of all variants in known deafness genes.
Supplemental Data
Supplemental Data include four figures and five tables and can be found with this article online athttp://dx.doi.org/10.1016/j.ajhg. 2014.09.001.
Acknowledgments
This work was supported by NIDCD 1F30DC011674 to A.E.S. and NIDCD RO1s DC003544, DC002842, and DC012049 to R.J.H.S. Colombian individuals and samples were obtained as part of the project ‘‘Frecuencias de variantes codificantes especı´ficas de genes entre diferentes poblaciones,’’ supported by Pontificia Universidad Javeriana, Grant ID4775 (Bogota´, Colombia).
Received: June 28, 2014 Accepted: September 8, 2014 Published: September 25, 2014
Web Resources
The URLs for data presented herein are as follows: 1000 Genomes,http://browser.1000genomes.org
Figure 3. Contribution of Each Population to Recategorization of 93 Previously Reported Pathogenic Variants
The count for each population is the number of variants found in each population above MAF threshold. Values for total, recessive, and dominant variants are shown along with the number of variants above the MAF unique to that single population (Unique). Number of individuals per population are listed in parenthesis on the x axis, also seeTable 1.
ANNOVAR,http://www.openbioinformatics.org/annovar/
ClinVar,https://www.ncbi.nlm.nih.gov/clinvar/
dbSNP,http://www.ncbi.nlm.nih.gov/projects/SNP/
Deafness Variation Database,http://deafnessvariationdatabase.org
Galaxy,https://usegalaxy.org/
Human Gene Mutation Database,http://www.hgmd.org/
Mutalyzer,https://mutalyzer.nl/index
NHLBI Exome Sequencing Project (ESP) Exome Variant Server,
http://evs.gs.washington.edu/EVS/
Online Mendelian Inheritance in Man (OMIM), http://www. omim.org/
RefSeq,http://www.ncbi.nlm.nih.gov/RefSeq
World Health Organization Deafness Estimate,http://www.who. int/pbd/deafness/estimates/en/
References
1. Walsh, T., Lee, M.K., Casadei, S., Thornton, A.M., Stray, S.M., Pennil, C., Nord, A.S., Mandell, J.B., Swisher, E.M., and King, M.C. (2010). Detection of inherited mutations for breast and ovarian cancer using genomic capture and massively parallel sequencing. Proc. Natl. Acad. Sci. USA 107, 12629–12633. 2. Shanks, M.E., Downes, S.M., Copley, R.R., Lise, S., Broxholme,
J., Hudspith, K.A., Kwasniewska, A., Davies, W.I., Hankins, M.W., Packham, E.R., et al. (2012). Next-generation se-quencing (NGS) as a diagnostic tool for retinal degeneration reveals a much higher detection rate in early-onset disease. Eur. J. Hum. Genet. 21, 274–280.
3. Shearer, A.E., Black-Ziegelbein, E.A., Hildebrand, M.S., Epp-steiner, R.W., Ravi, H., Joshi, S., Guiffre, A.C., Sloan, C.M., Happe, S., Howard, S.D., et al. (2013). Advancing genetic testing for deafness with genomic technology. J. Med. Genet. 50, 627–634.
4. Smith, R.J., Bale, J.F., Jr., and White, K.R. (2005). Sensorineural hearing loss in children. Lancet 365, 879–890.
5. Moore, C.B., Wallace, J.R., Wolfe, D.J., Frase, A.T., Pendergrass, S.A., Weiss, K.M., and Ritchie, M.D. (2013). Low frequency variants, collapsed based on biological knowledge, uncover complexity of population stratification in 1000 genomes proj-ect data. PLoS Genet. 9, e1003959.
6. Tennessen, J.A., Bigham, A.W., O’Connor, T.D., Fu, W., Kenny, E.E., Gravel, S., McGee, S., Do, R., Liu, X., Jun, G., et al.; Broad GO; Seattle GO; NHLBI Exome Sequencing Project (2012). Evolution and functional impact of rare coding variation from deep sequencing of human exomes. Science 337, 64–69. 7. Norton, N., Robertson, P.D., Rieder, M.J., Zu¨chner, S., Ramper-saud, E., Martin, E., Li, D., Nickerson, D.A., and Hershberger, R.E.; National Heart, Lung and Blood Institute GO Exome Sequencing Project (2012). Evaluating pathogenicity of rare variants from dilated cardiomyopathy in the exome era. Circ Cardiovasc Genet 5, 167–174.
8. Piton, A., Redin, C., and Mandel, J.L. (2013). XLID-causing mutations and associated genes challenged in light of data from large-scale human exome sequencing. Am. J. Hum. Genet. 93, 368–383.
9. Eisenberger, T., Di Donato, N., Baig, S.M., Neuhaus, C., Beyer, A., Decker, E., Mu¨rbe, D., Decker, C., Bergmann, C., and Bolz,
H.J. (2014). Targeted and genomewide NGS data disqualify mutations in MYO1A, the ‘‘DFNA48 gene’’, as a cause of deaf-ness. Hum. Mutat. 35, 565–570.
10. Cassa, C.A., Tong, M.Y., and Jordan, D.M. (2013). Large numbers of genetic variants considered to be pathogenic are common in asymptomatic individuals. Hum. Mutat. 34, 1216–1220.
11. Wildeman, M., van Ophuizen, E., den Dunnen, J.T., and Taschner, P.E. (2008). Improving sequence variant descrip-tions in mutation databases and literature using the Muta-lyzer sequence variation nomenclature checker. Hum. Mutat. 29, 6–13.
12. Goecks, J., Nekrutenko, A., and Taylor, J.; Galaxy Team (2010). Galaxy: a comprehensive approach for supporting accessible, reproducible, and transparent computational research in the life sciences. Genome Biol. 11, R86.
13. Li, H., and Durbin, R. (2009). Fast and accurate short read alignment with Burrows-Wheeler transform. Bioinformatics 25, 1754–1760.
14. McKenna, A., Hanna, M., Banks, E., Sivachenko, A., Cibul-skis, K., Kernytsky, A., Garimella, K., Altshuler, D., Gabriel, S., Daly, M., and DePristo, M.A. (2010). The Genome Analysis Toolkit: a MapReduce framework for analyzing next-generation DNA sequencing data. Genome Res. 20, 1297–1303.
15. Li, H., Handsaker, B., Wysoker, A., Fennell, T., Ruan, J., Homer, N., Marth, G., Abecasis, G., and Durbin, R.; 1000 Genome Project Data Processing Subgroup (2009). The Sequence Align-ment/Map format and SAMtools. Bioinformatics 25, 2078– 2079.
16. Quinlan, A.R., and Hall, I.M. (2010). BEDTools: a flexible suite of utilities for comparing genomic features. Bioinformatics 26, 841–842.
17. Altmann, A., Weber, P., Quast, C., Rex-Haffner, M., Binder, E.B., and Mu¨ller-Myhsok, B. (2011). vipR: variant identifica-tion in pooled DNA using R. Bioinformatics 27, i77–i84. 18. Wang, K., Li, M., and Hakonarson, H. (2010). ANNOVAR:
functional annotation of genetic variants from high-throughput sequencing data. Nucleic Acids Res. 38, e164. 19. Liu, X., Jian, X., and Boerwinkle, E. (2013). dbNSFP v2.0: a
database of human non-synonymous SNVs and their func-tional predictions and annotations. Hum. Mutat. 34, E2393– E2402.
20. Xia, J.H., Liu, C.Y., Tang, B.S., Pan, Q., Huang, L., Dai, H.P., Zhang, B.R., Xie, W., Hu, D.X., Zheng, D., et al. (1998). Muta-tions in the gene encoding gap junction protein beta-3 associ-ated with autosomal dominant hearing impairment. Nat. Genet. 20, 370–373.
21. Liu, X.Z., Ouyang, X.M., Xia, X.J., Zheng, J., Pandya, A., Li, F., Du, L.L., Welch, K.O., Petit, C., Smith, R.J., et al. (2003). Pres-tin, a cochlear motor protein, is defective in non-syndromic hearing loss. Hum. Mol. Genet. 12, 1155–1162.
22. Shearer, A.E., Kolbe, D.L., Azaiez, H., Sloan, C.M., Frees, K.L., Weaver, A.E., Clark, E.T., Nishimura, C.J., Black-Ziegelbein, E.A., and Smith, R.J.H. (2014). Copy number variants are a common cause of non-syndromic hearing loss. Genome Med 6, 37.